Annual Technology Baseline 2017
National Renewable Energy Laboratory
Recommended Citation:
NREL (National Renewable Energy Laboratory). 2017. 2017 Annual Technology Baseline. Golden, CO: National Renewable Energy Laboratory. http://atb.nrel.gov/.
Please consult Guidelines for Using ATB Data:
https://atb.nrel.gov/electricity/user-guidance.html
Hydropower
Levelized Cost of Energy (LCOE) Projections
Levelized cost of energy (LCOE) is a simple metric that combines the primary technology cost and performance parameters, CAPEX, O&M, and capacity factor. It is included in the ATB for illustrative purposes. The focus of the ATB is to define the primary cost and performance parameters for use in electric sector modeling or other analysis where more sophisticated comparisons among technologies are made. LCOE captures the energy component of electric system planning and operation, but the electric system also requires capacity and flexibility services to operate reliably. Electricity generation technologies have different capabilities to provide such services. For example, wind and PV are primarily energy service providers, while the other electricity generation technologies provide capacity and flexibility services in addition to energy. These capacity and flexibility services are difficult to value and depend strongly on the system in which a new generation plant is introduced. These services are represented in electric sector models such as the ReEDS model and corresponding analysis results such as the Standard Scenarios.
The following three figures illustrate the combined impact of CAPEX, O&M, and capacity factor projections across the range of resources present in the contiguous United States. The Current Market Conditions LCOE demonstrates the range of LCOE based on macroeconomic conditions similar to the present. The Historical Market Conditions LCOE presents the range of LCOE based on macroeconomic conditions consistent with prior ATB editions and Standard Scenarios model results. The Normalized LCOE (all LCOE estimates are normalized with the lowest Base Year LCOE value) emphasizes the effect of resource quality and the relative differences in the three future pathways independent of project finance assumptions. The ATB representative plant characteristics that best align with recently installed or anticipated near-term hydropower plants are associated with NPD 4. Data for all the resource categories can be found in the ATB data spreadsheet.
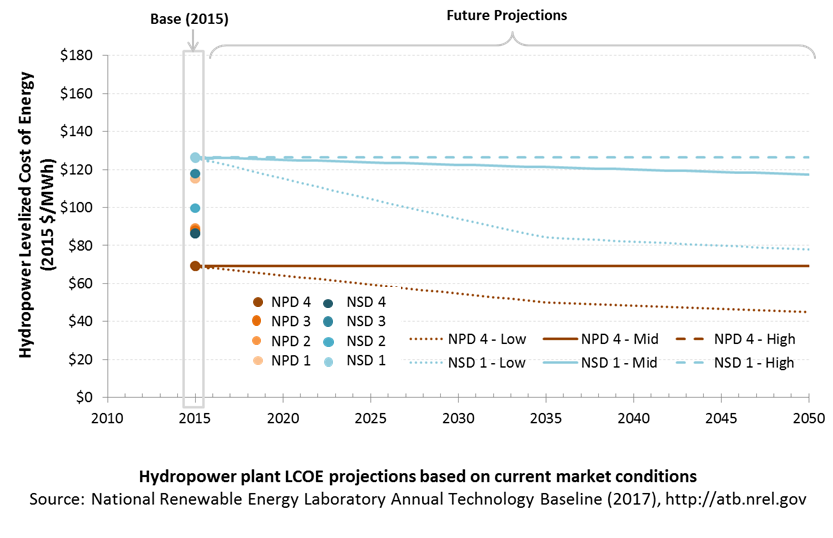
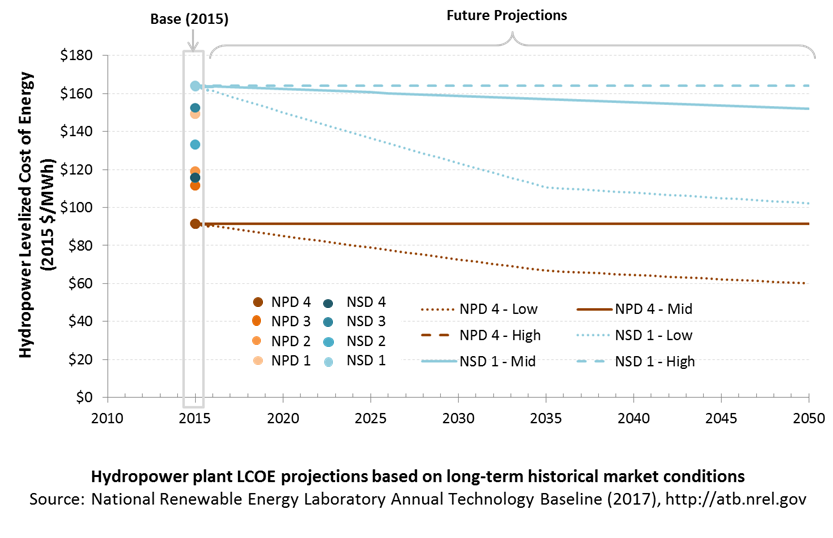
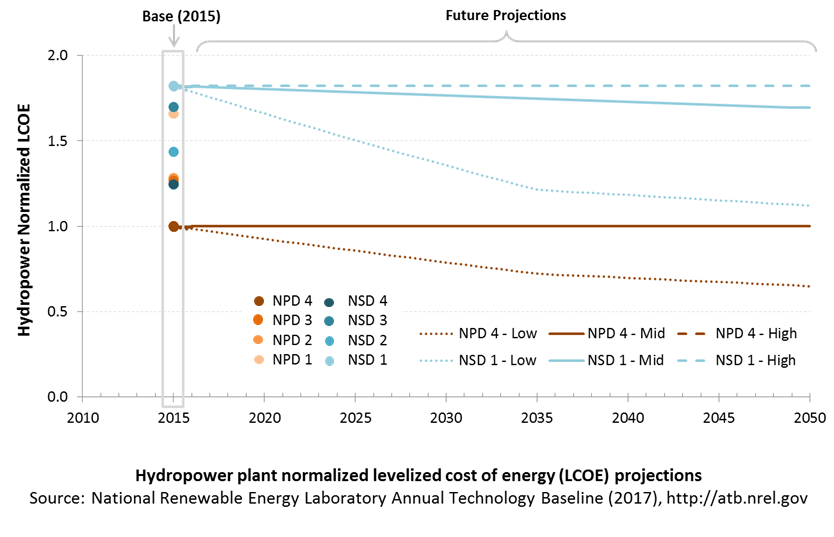
Values are in 2015$.
The methodology for representing the CAPEX, O&M, and capacity factor assumptions behind each pathway is discussed in Projections Methodology. The three pathways are generally defined as:
- High = Base Year (or near-term estimates of projects under construction) equivalent through 2050 maintains current relative technology cost differences
- Mid = technology advances through continued industry growth, public and private R&D investments, and market conditions relative to current levels that may be characterized as "likely" or "not surprising"
- Low = Technology advances that may occur with breakthroughs, increased public and private R&D investments, and/or other market conditions that lead to cost and performance levels that may be characterized as the "limit of surprise" but not necessarily the absolute low bound.
To estimate LCOE, assumptions about the cost of capital to finance electricity generation projects are required. For comparison in the ATB, two project finance structures are represented.
- Current Market Conditions: The values of the production tax credit (PTC) and investment tax credit (ITC) are ramping down by 2020, at which time wind and solar projects may be financed with debt fractions similar to other technologies. This scenario reflects debt interest (4.4% nominal, 1.9% real) and return on equity rates (9.5% nominal, 6.8% real) to represent 2017 market conditions (AEO 2017) and a debt fraction of 60% for all electricity generation technologies. An economic life, or period over which the initial capital investment is recovered, of 20 years is assumed for all technologies. These assumptions are one of the project finance options in the ATB spreadsheet.
- Long-Term Historical Market Conditions: Historically, debt interest and return on equity were represented with higher values. This scenario reflects debt interest (8% nominal, 5.4% real) and return on equity rates (13% nominal, 10.2% real) implemented in the ReEDS model and reflected in prior versions of the ATB and Standard Scenarios model results. A debt fraction of 60% for all electricity generation technologies is assumed. An economic life, or period over which the initial capital investment is recovered, of 20 years is assumed for all technologies. These assumptions are one of the project finance options in the ATB spreadsheet.
These parameters are held constant for estimates representing the Base Year through 2050. No incentives such as the PTC or ITC are included. The equations and variables used to estimate LCOE are defined on the equations and variables page. For illustration of the impact of changing financial structures such as WACC and economic life, see Project Finance Impact on LCOE. For LCOE estimates for High, Mid, and Low scenarios for all technologies, see 2017 ATB Cost and Performance Summary.
Areas identified as having potential cost reduction opportunities associated with the Low cost projection include:
- Widespread implementation of value engineering and design/construction best practices
- Modular "drop-in" systems that minimize civil works and maximize ease of manufacture reduce both capital investment and O&M expenditures
- Use of alternative materials in place of steel for water diversion (e.g., penstocks)
- Implementation of standardized "smart" automation and remote monitoring systems to optimize scheduling of maintenance
- Research and development on environmentally enhanced turbines to improve performance of the existing hydropower fleet
- Efficient, certain, permitting, licensing, and approval procedures.
The Hydropower Vision study (DOE 2016) includes roadmap actions that result in lower-cost technology.
References
EIA (U.S. Energy Information Administration). 2017. Annual Energy Outlook 2017 with Projections to 2050. Washington, D.C.: U.S. Department of Energy. January 5, 2017. http://www.eia.gov/outlooks/aeo/pdf/0383(2017).pdf.