Annual Technology Baseline 2018
National Renewable Energy Laboratory
Recommended Citation:
NREL (National Renewable Energy Laboratory). 2018. 2018 Annual Technology Baseline. Golden, CO: National Renewable Energy Laboratory. http://atb.nrel.gov/.
Please consult Guidelines for Using ATB Data:
https://atb.nrel.gov/electricity/user-guidance.html
Offshore Wind
Plant Cost and Performance Projections Methodology
ATB projections were derived from the results of a survey of 163 of the world's wind energy experts Wiser et al. (2016). The survey was conducted to gain insight into the possible future cost reductions, the source of those reductions, and the conditions needed to enable continued innovation and lower costs (Wiser et al. (2016)). The expert survey produced three cost reduction scenarios associated with probability levels of 10%, 50%, and 90% of achieving LCOE reductions by 2030 and 2050. In addition, the scenario results include estimated changes to CAPEX, O&M, capacity factor, project life, and weighted average cost of capital (WACC) by 2030.
For the ATB, three different technology cost scenarios were adapted from the expert survey results for scenario modeling as bounding levels:
- Constant Technology Cost Scenario: no change in CAPEX, O&M, or capacity factor from 2015 to 2050; consistent across all renewable energy technologies in the ATB
- Mid Technology Cost Scenario: LCOE percentage reduction from the Base Year equivalent to that corresponding to the Median Scenario (50% probability) in the expert survey (Wiser et al. (2016))
- Low Technology Cost Scenario: LCOE percentage reduction from the Base Year equivalent to that corresponding to the Low scenario (10% probability) in the expert survey (Wiser et al. (2016)).
Expert survey estimates were normalized to the ATB Base Year starting point in order to focus on projected cost reduction instead of absolute reported costs. The percentage reduction in LCOE by 2020, 2030, and 2050 from the expert survey's Median and Low scenarios are implemented as the ATB Mid and Low cost scenarios. This is accomplished by utilizing survey estimates for changes to capacity factor and O&M costs by 2030 and 2050. The corresponding CAPEX value to achieve the overall LCOE reduction is computed. The percentage reduction in LCOE by 2030 and by 2050 was applied equally across all TRGs. The overall reduction in LCOE by 2050 for the Mid cost scenario is 39% and for the Low cost scenario is 51%.
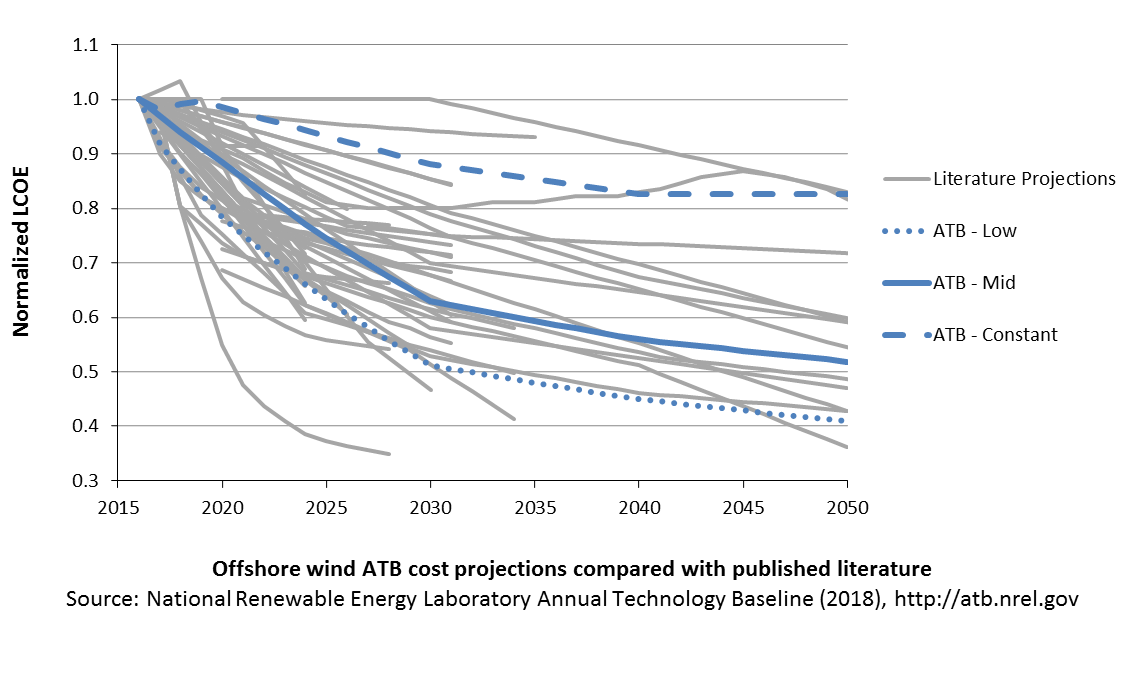
A broad sample of cost of offshore wind energy projections provides context for the ATB Constant, Mid, and Low technology cost projections. Based on a TRG4 resource classification,[1] the ATB Mid cost projection, which corresponds to the median scenario from the Wiser et al. (2016) expert survey, results in LCOE reductions that are fairly aligned with the median scenarios of external studies (BNEF (2017c); IRENA (2016b); Catapult (2016); Lazard (2017)). EIA (2017b) estimates higher cost levels in the period 2022-2041, while BNEF (2018) estimates lower cost levels for the U.S by the mid-2020s. These external studies were reviewed to validate the baseline estimates and projections derived for the ATB. Generally, while some published studies as well as recent tender awards for European projects to be installed by the mid-2020s suggest significant near-term cost reduction (see e.g., Musial et al. (2017)), it is likely that the United States will lag due to a different development stage of the U.S. supply chain and port infrastructure.
The relative costs of mid-depth water plants and deep water, or floating, offshore wind plants are maintained constant throughout the scenarios for simplicity. Some hypothesize that unique aspects of floating technologies, such as the ability to assemble and commission turbines at the port, could reduce the cost of floating technologies relative to fixed-bottom technologies.
References
2H 2017 Offshore Wind Market Outlook. Presentation by Tom Harries, accessed through BNEF subscription services.
Innovation Outlook: Off shore Wind. Abu Dhabi: International Renewable Energy Agency.
Lazard's Levelized Cost of Energy Analysis: Version 11.0. November 2017. New York: Lazard. https://www.lazard.com/perspective/levelized-cost-of-energy-2017.
Levelized Cost and Levelized Avoided Cost of New Generation Resources in the Annual Energy Outlook 2017.
U.S. Offshore Wind. Presentation by Tom Harries, accessed through BNEF subscription services.
Catapult. 2016. Cost Reduction Monitoring Framework. Quantitative Assessment Report. 19 December 2016.
Musial, W., P. Beiter, P. Schwabe, T. Tian, T. Stehly, P. Spitsen. 2017. 2016 Offshore Wind Technologies Market Report. U.S. Department of Energy Office of Energy Efficiency and Renewable Energy. DOE/GO-102017-5031. August 2017. https://www.energy.gov/sites/prod/files/2018/08/f35/2016%20Offshore%20Wind%20Technologies%20Market%20Report.pdf
Wiser, Ryan, Karen Jenni, Joachim Seel, Erin Baker, Maureen Hand, Eric Lantz, and Aaron Smith. 2016. Forecasting Wind Energy Costs and Cost Drivers: The Views of the World's Leading Experts. Berkeley, CA: Lawrence Berkeley National Laboratory. LBNL-1005717. June 2016. https://emp.lbl.gov/publications/forecasting-wind-energy-costs-and.