Annual Technology Baseline 2018
National Renewable Energy Laboratory
Recommended Citation:
NREL (National Renewable Energy Laboratory). 2018. 2018 Annual Technology Baseline. Golden, CO: National Renewable Energy Laboratory. http://atb.nrel.gov/.
Please consult Guidelines for Using ATB Data:
https://atb.nrel.gov/electricity/user-guidance.html
Residential PV Systems
CAPEX Definition
Capital expenditures (CAPEX) are expenditures required to achieve commercial operation in a given year. For residential PV, this is modeled for a host-owned business model only.
For the ATB-and based on EIA 2016a and the NREL Solar-PV Cost Model (Fu et al. (2017)) - the distributed residential solar PV plant envelope is defined to include:
- Hardware
- Module supply
- Power electronics, including inverters
- Racking
- Foundation
- AC and DC wiring materials and installation
- Balance of system (BOS)
- Site and/or roof preparation
- Permitting, inspection, and interconnection costs
- Project indirect costs, including costs related to engineering, distributable labor and materials, construction management start up and commissioning, and contractor overhead costs, fees, and profit
- Financial costs
- Owners costs, such as development costs, legal fees, insurance costs.
CAPEX can be determined for a plant in a specific geographic location as follows:
Regional cost variations are not included in the ATB (CapRegMult = 1). Because distributed PV plants are located directly at the end use, there are no grid connection costs (GCC = 0). In the ATB, the input value is overnight capital cost (OCC) and details to calculate interest during construction (ConFinFactor).
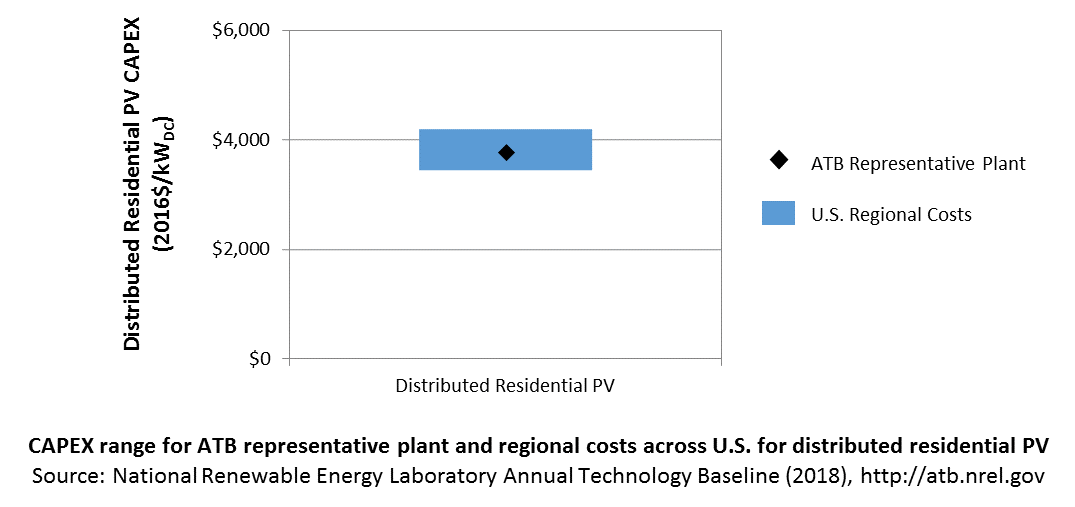
In the ATB, CAPEX represents a typical distributed residential/commercial PV plant and does not vary with resource. Regional cost effects associated with labor rates, material costs, and other regional effects as defined by EIA 2016a expand the range of CAPEX. Unique land-based spur line costs based on distance and transmission line costs are not estimated. The following figure illustrates the ATB representative plant relative to the range of CAPEX including regional costs across the contiguous United States. The ATB representative plants are associated with a regional multiplier of 1.0.
Standard Scenarios Model Results
ATB CAPEX, O&M, and capacity factor assumptions for the Base Year and future projections through 2050 for Constant, Mid, and Low technology cost scenarios are used to develop the NREL Standard Scenarios using the ReEDS model. See ATB and Standard Scenarios.
CAPEX in the ATB does not represent regional variants (CapRegMult) associated with labor rates, material costs, etc., but dSolar does include 134 regional multipliers (EIA 2016a).
References
EIA (U.S. Energy Information Administration). 2016a. Capital Cost Estimates for Utility Scale Electricity Generating Plants. Washington, D.C.: U.S. Department of Energy. November 2016. https://www.eia.gov/analysis/studies/powerplants/capitalcost/pdf/capcost_assumption.pdf.
Fu, Ran, David Feldman, Robert Margolis, Mike Woodhouse, and Kristen Ardani. 2017. U.S. Solar Photovoltaic System Cost Benchmark: Q1 2017. Golden, CO: National Renewable Energy Laboratory. NREL/TP-6A20-68925. https://www.nrel.gov/docs/fy17osti/68925.pdf.