
Concentrating Solar Power
Representative Technology
Concentrating solar power (CSP) technology is currently assumed to be molten-salt power towers. Thermal energy storage (TES) is accomplished by storing hot molten salt in a two-tank system, which includes a hot-salt tank and a cold-salt tank. Stored hot salt can be dispatched to the power block as needed, regardless of solar conditions, to continue power generation and allow for electricity generation after sunlight hours. In the ATB, CSP plants with 10 hours of TES are illustrated. Ten hours is the amount of storage at the Crescent Dunes CSP plant in Nevada, which is representative of most new molten-salt power tower projects.
Molten-salt power towers (with 10 hours of storage) were selected as the representative technology over parabolic trough with synthetic oil-heat transfer fluid for two main reasons. First, most new global capacity of CSP plants in development or under construction are molten-salt power towers; in 2015, 3.7 GWe of molten-salt power towers were in development or under construction ((IRENA 2018), (SolarReserve n.d.)) – compared to 1.3 GWe of parabolic trough (IRENA 2018). Second, current indications are that molten-salt power towers have the greatest cost reduction potential, in terms of both CAPEX and LCOE ((IRENA 2016), (Mehos et al. 2017)). And they are part of the DOE Generation 3 (Gen3) road map for the next generation of commercial CSP plants (Mehos et al. 2017).
Crescent Dunes (110 MWe with 10 hours of storage) was the first large molten-salt power tower plant in the United States. It was commissioned in 2015 with a reported installed CAPEX of $8.96/WAC ((Danko 2015), (Taylor 2016)). No new molten salt storage CSP plants were commissioned in the United States in 2018 or 2019. Molten-salt power tower plants are being bid and built in Chile and Dubai (NREL and SolarPaces n.d.).
Resource Potential
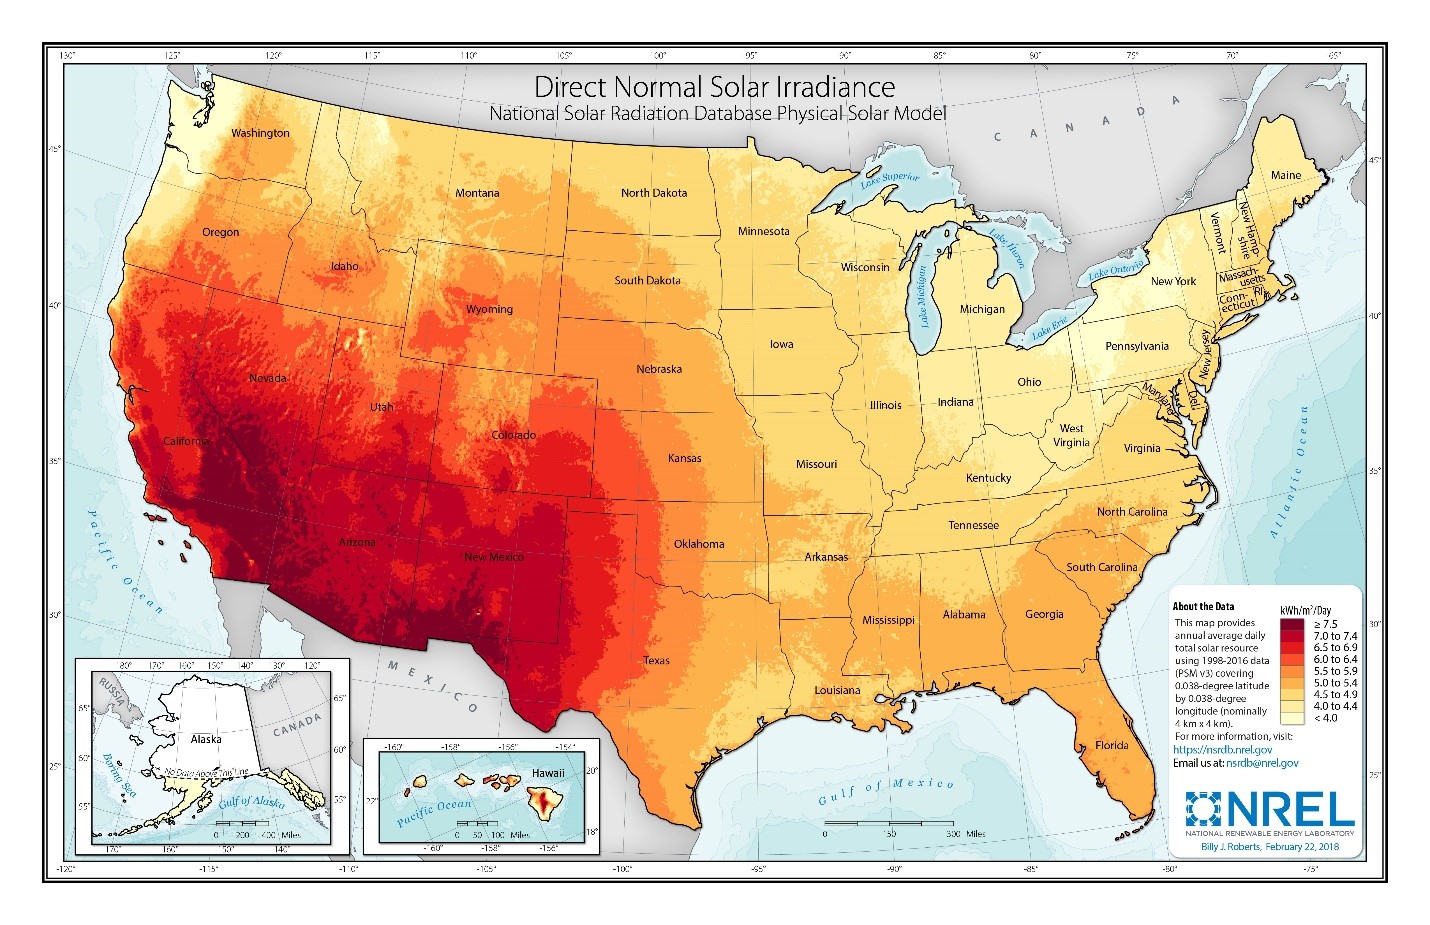
Solar resource is prevalent throughout the United States, but the Southwest is particularly suited to CSP plants. The direct normal irradiance (DNI) resource across the Southwest, which is some of the best in the world, ranges from 6.0 to more than 7.5 kWh/m2/day (Roberts 2018). The raw resource technical potential of seven western states (Arizona, California, Colorado, Nevada, New Mexico, Utah, and Texas) exceeds 11,000 GWe, which is almost tenfold current total U.S. electricity generation capacity-considering regions in these states with an annual average resource > 6.0 kWh/m2/day. After accounting for exclusions such as land slope (> 1%), urban areas, water features, and parks, preserves, and wilderness areas (Mehos, Kabel, and Smithers 2009).
Renewable energy technical potential, as defined by Lopez et al. (2012), represents the achievable energy generation of a particular technology given system performance, topographic limitations, and environmental and land-use constraints. The primary benefit of assessing technical potential is that it establishes an upper-boundary estimate of development potential. It is important to understand that there are multiple types of potential – resource, technical, economic, and market (see NREL: "Renewable Energy Technical Potential").
The Solar Programmatic Environmental Impact Statement identified 17 solar energy zones for priority development of utility-scale solar facilities in six western states. These zones total 285,000 acres and are estimated to accommodate up to 24 GWe of solar potential. The program also allows development, subject to a more rigorous review, on an additional 19 million acres of public land. Development is prohibited on approximately 79 million acres.
According to NREL's Concentrating Solar Power Projects website and the CSP Today Global Projects Tracker ("CSP Today Global Tracker" n.d.), 12 of the 14 currently operational CSP plants greater than 5 MWe in the United States use parabolic trough technology, and two are power tower facilities – Ivanpah (392 MWe, utilizing direct steam generation in the towers) and Crescent Dunes (110 MWe, as highlighted, utilizing molten-salt in the tower).
Base Year and Future Year Projections Overview
For the ATB, various factors are used to demonstrate the range of LCOE and performance across the United States. These include:
- CAPEX is determined using manufacturing cost models and is benchmarked with industry data. CSP performance and cost are based on the molten-salt power tower technology with dry-cooling to reduce water consumption.
- O&M cost is benchmarked against industry data.
- Capacity factor varies with inclusion of TES and solar irradiance. The listed resource classes assume power towers with 10 hours of TES at three types of locations:
- Fair resource (e.g., Abilene Regional Airport, Texas 6.16 kWh/m2/day based on the National Solar Radiation Database [NSRDB] site 2017 Physical Solar Model [PSM] TMY file)
- Good resource (e.g., Phoenix, Arizona 7.26 kWh/m2/day based on the site TMY3 file)
- Excellent resource (e.g., Daggett, California 7.65 kWh/m2/day based on the site TMY3 file)
- Representative CSP plant size is net 100 MWe.
The CSP costs originated from: (1) a NREL survey leading to updated cost estimates in the System Advisor Model (SAM) 2017.09.05; and (2) further cost estimates for CSP components which are now present in SAM 2018.11.11 (Craig Turchi et al. 2019). These SAM 2018 CSP costs were deflated to the ATB Base Year of 2017 via the consumer price index. The SAM 2018 costs translate to ATB costs in 2021 due to the three-year construction period. (SAM costs are based on the project announcement year, while the ATB is based on the plant commissioning year).
Future year projections are informed by a variety of published literature, NREL expertise and technology pathway assessments for CAPEX and O&M cost reductions. Three different projections were developed for scenario modeling as bounding levels:
- Constant Technology Cost Scenario: no change in CAPEX, O&M, or capacity factor from current estimates (2021 for CSP) to 2050; consistent across all renewable energy technologies in the ATB
- The Mid Technology Cost Scenario is based on recently published literature projections and NREL judgment of U.S. costs for future CAPEX at 2025, 2030, 2040 and 2050 ((IRENA 2016), (Breyer et al. 2017), (Feldman et al. 2016), and (World Bank 2014)). It is anticipated that CSP costs could fall by approximately 25% from the ATB CSP 2021 costs of $6,450/kWe to approximately $4,800/kWe by 2030. From 2030 to 2050, CSP CAPEX is projected to fall to approximately $3,380/kWe.
- The Low Technology Cost Scenario is based on the lower bound of the literature sample, and on the Power to Change report (IRENA 2016).
References
The following references are specific to this page; for all references in this ATB, see References.Breyer, C., Afanasyeva, S., Brakemeier, D., Engelhard, M., Giuliano, S., Puppe, M., … Moser, M. (2017). Assessment of Mid-Term Growth Assumptions and Learning Rates for Comparative Studies of CSP and Hybrid PV-Battery Power Plants. AIP Conference Proceedings, 1850, 160001-1-160001–160009. https://doi.org/10.1063/1.4984535
CSP Today Global Tracker. (n.d.). Retrieved February 11, 2019, from New Energy Update website: http://tracker.newenergyupdate.com/tracker/projects
Danko, P. (2015, February 10). SolarReserve: Crescent Dunes Solar Tower Will Power Up in March, Without Ivanpah's Woes. Retrieved February 5, 2019, from Breaking Energy website: https://breakingenergy.com/2015/02/10/solarreserve-crescent-dunes-solar-tower-will-power-up-in-march-without-ivanpahs-woes/
Feldman, D., Margolis, R., Denholm, P., & Stekli, J. (2016). Exploring the Potential Competitiveness of Utility-Scale Photovoltaics plus Batteries with Concentrating Solar Power, 2015-2030 (No. NREL/TP-6A20-66592). https://doi.org/10.2172/1321487
IRENA. (2016b). The Power to Change: Solar and Wind Cost Reduction Potential to 2025. Retrieved from International Renewable Energy Agency website: https://www.irena.org/DocumentDownloads/Publications/IRENA_Power_to_Change_2016.pdf
IRENA. (2018). Renewable Power Generation Costs in 2017. Retrieved from International Renewable Energy Agency website: https://www.irena.org/-/media/Files/IRENA/Agency/Publication/2018/Jan/IRENA_2017_Power_Costs_2018.pdf
Lopez, A., Roberts, B., Heimiller, D., Blair, N., & Porro, G. (2012). U.S. Renewable Energy Technical Potentials: A GIS-Based Analysis (Technical Report No. NREL/TP-6A20-51946). https://doi.org/10.2172/1219777
Mehos, M., Kabel, D., & Smithers, P. (2009). Planting the Seed: Greening the Grid with Concentrating Solar Power. IEEE Power and Energy Magazine, 7(3), 55–62. https://doi.org/10.1109/MPE.2009.932308
Mehos, M., Turchi, C., Vidal, J., Wagner, M., & Ma, Z. (2017). Concentrating Solar Power Gen3 Demonstration Roadmap (No. NREL/TP-5500-67464). https://doi.org/10.2172/1338899
NREL, & SolarPaces. (n.d.). Concentrating Solar Power Projects. Retrieved February 11, 2019, from https://solarpaces.nrel.gov/
Roberts, B. J. (2018). Map of solar resource in contiguous United States. Retrieved from https://www.nrel.gov/gis/assets/pdfs/solar_dni_2018_01.pdf
SolarReserve. (n.d.). Sandstone (project overview). Retrieved February 11, 2019, from SolarReserve website: https://www.solarreserve.com/en/global-projects/csp/sandstone
Taylor, P. (2016, March 29). Nev. Plant Solves Quandary of How to Store Sunshine. E&E Greenwire. Retrieved from https://www.eenews.net/stories/1060034748
Turchi, Craig, Boyd, M., Kesseli, D., Kurup, P., Mehos, M., Neises, T., … Wendelin, T. (2019). CSP Systems Analysis - Final Project Report (No. NREL/TP-5500-72856). Retrieved from National Renewable Energy Laboratory website: https://www.nrel.gov/docs/fy19osti/72856.pdf
World Bank. (2014). Project Appraisal Document on a Proposed Loan in the Amount of EUR234.50 Million and US$80 Million (US$400 Million Equivalent) and a Proposed Loan from the Clean Technology Fund in the Amount of US$119 Million to the Moroccan Agency for Solar Energy with Guarantee from the Kingdom of Morocco for the Noor-Ouarzazate Concentrated Solar Power Plant Project (No. PAD1007). Retrieved from The World Bank website: http://documents.worldbank.org/curated/en/748641468279941398/pdf/PAD10070PAD0P100disclosed0120220140.pdf