
Commercial PV
Plant Cost and Performance Projections Methodology
Currently, CAPEX – not LCOE – is the most common metric for PV cost. Due to differing assumptions in long-term incentives, system location and production characteristics, and cost of capital, LCOE can be confusing and often incomparable between differing estimates. While CAPEX also has many assumptions and interpretations, it involves fewer variables to manage. Therefore, PV projections in the ATB are driven entirely by plant and operational cost improvements.
We created Constant, Mid and Low CAPEX cases to explore the range of possible outcomes of future PV cost improvements. The Constant technology cost scenario represents no CAPEX improvements made beyond today, the Mid cost case represents current expectations of price reductions in a "business-as-usual" scenario, and the Low cost case represents current expectations of potential cost reductions given improved R&D funding and more aggressive global deployment targets.
While CAPEX is one of the drivers to lower costs, R&D efforts continue to focus on other areas to lower the cost of energy from residential PV. While these are not incorporated in the ATB, they include longer system lifetime, improved performance and reliability, and lower cost of capital.
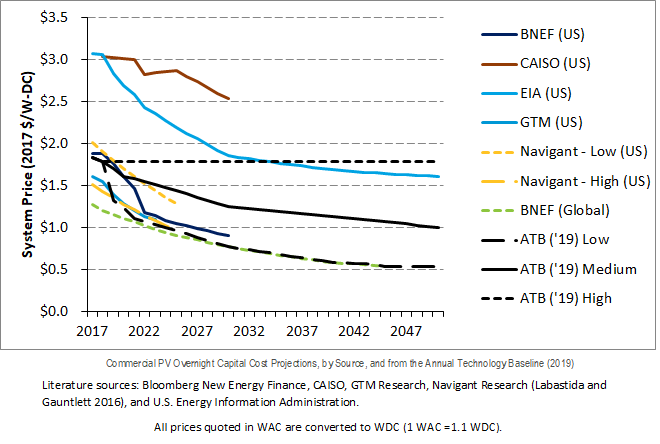
Projections of future commercial PV installation CAPEX are based on seven system price projections from five separate institutions. Projections included short-term U.S. price forecasts made in the past six months and long-term global and U.S. price forecasts made in the past primarily provided by market analysis firms with expertise in the PV industry, through a subscription service with NREL. The long-term forecasts primarily represent the collection of publicly available, unique forecasts with either a long-term perspective of solar trends or through capacity expansion models with assumed learning by doing.
- Short-Term Forecast Institutions: Bloomberg New Energy Finance, GTM Research, Navigant Research (Labastida and Gauntlett 2016), U.S. Energy Information Administration
- Long-Term Forecast Institutions: Bloomberg New Energy Finance, CAISO, and U.S. Energy Information Administration.
In instances in which literature projections did not include all years, a straight-line change in price was assumed between any two projected values. To generate Mid and Low technology cost scenarios, we took the "median" and "min" of the data sets; however, we only included short-term U.S. forecasts until 2030 as they focus on near-term pricing trends within the industry. Starting in 2030, we include long-term global and U.S. forecasts in the data set, as they focus more on long-term trends within the industry. It is also assumed after 2025 U.S. prices will be on par with global averages; the federal tax credit for solar assets reverts down to 10% for all projects placed in service after 2023, which has the potential to lower upfront financing costs and remove any distortions in reported pricing, compared to other global markets. Additionally, a larger portion of the United States will have a more mature PV market, which should result in a narrower price range. Changes in price for the Mid and Low technology cost scenarios between 2020 and 2030 are interpolated on a straight-line basis.
We adjusted the "median" and "min" projections in a few different ways. All 2017 and 2018 pricing is based on the bottom-up benchmark analysis reported in U.S. Solar Photovoltaic System Cost Benchmark Q1 2018 (Fu, Feldman, and Margolis 2018).
We adjusted the Mid and Low cost projections for 2019-2050 to remove distortions caused by the combination of forecasts with different time horizons and based on internal judgment of price trends. The Constant cost projection case is kept constant at the 2018 CAPEX value, assuming no improvements beyond 2018.
From 2019-2050, FOM is based on the historical average ratio of O&M costs ($/kW-yr) to CAPEX costs ($/kW), 1.0:100, as reported by Fu, Feldman, and Margolis (2018). Historically reported data suggest O&M and CAPEX cost reductions are correlated; from 2010 to 2018 benchmark commercial PV O&M and CAPEX costs fell 47% and 66% respectively, as reported by Fu, Feldman, and Margolis (2018).
Projections of capacity factors for plants installed in future years are unchanged from 2018 for the Constant technology cost scenario. Capacity factors for Mid and Low cost scenarios are projected to increase over time, caused by a straight-line reduction in PV plant capacity degradation rates from 0.75%, reaching 0.5%/year and 0.2%/year by 2050 for the Mid and Low cost scenarios respectively.
References
The following references are specific to this page; for all references in this ATB, see References.Fu, R., Feldman, D., & Margolis, R. (2018). U.S. Solar Photovoltaic System Cost Benchmark: Q1 2018. https://doi.org/10.2172/1484344
Labastida, R. R., & Gauntlett, D. (2016). Next-Generation Solar PV: High Efficiency Solar PV Modules and Module-Level Power Electronics: Global Market Analysis and Forecasts [Market Report]. Chicago, IL: Navigant Research.