2016 ATB Cost and Performance Summary
The table and figures below summarize current (2015) and projected (2030, 2050) technology cost and performance from the 2016 ATB Spreadsheet by generation technology and year, including capacity factor (CF) range, CAPEX (capital expenditure) range, fuel cost, O&M (operations and maintenance) cost (fixed and variable), and calculated levelized cost of energy (LCOE) range. While LCOE is included as a simple or representative summary metric, it is not the focus of the ATB work. Low, Mid, and High designations appearing in the table and figures generally refer a range of perspectives based on values reported in public literature: low – lowest reported value, mid – median value, high – no change from current year value. The following technology abbreviations are shown: PC – Pulverized Coal; IGCC – Integrated Gasification Combined Cycle; CCS – Carbon Capture and Storage; CT – Combustion Turbine; CC – Combined Cycle; CSP – Concentrating Solar Power; TES – Thermal Energy Storage.
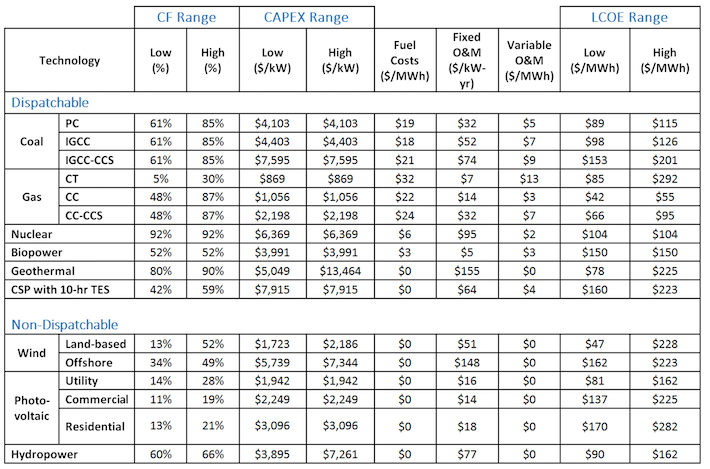
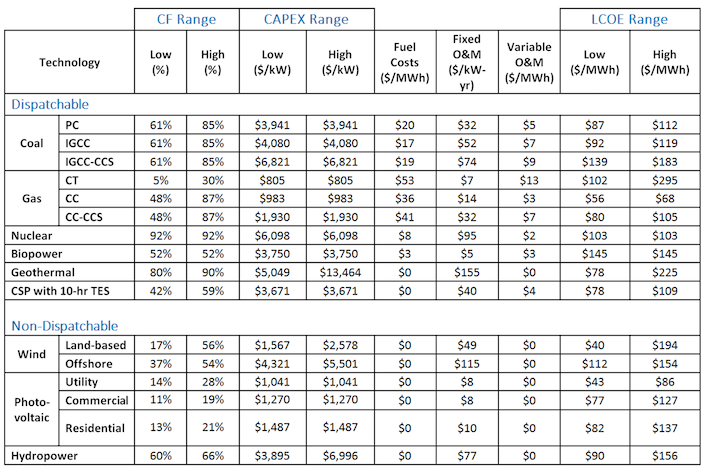
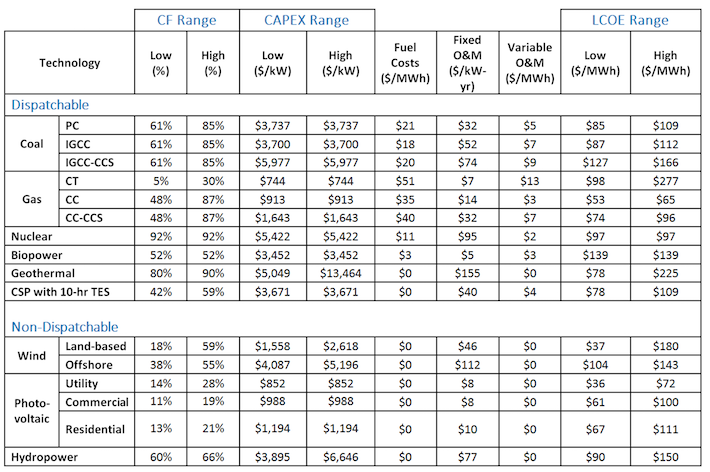
2016 ATB cost and performance summary by technology for the year specified. Monetary values are in 2014$. Hydropower is classified as non-dispatchable because most new hydropower generation would come from run-of-river or stream-reach resources. Note that while the levelized cost of electricity (LCOE) is provided as a summary metric, it is not the focus of this work.
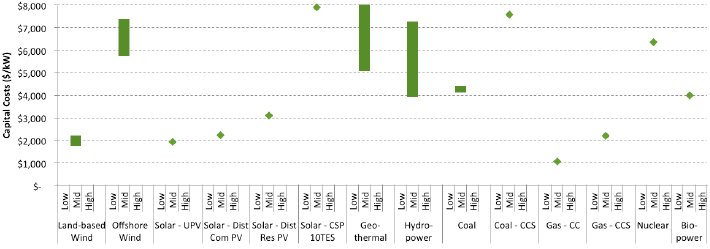
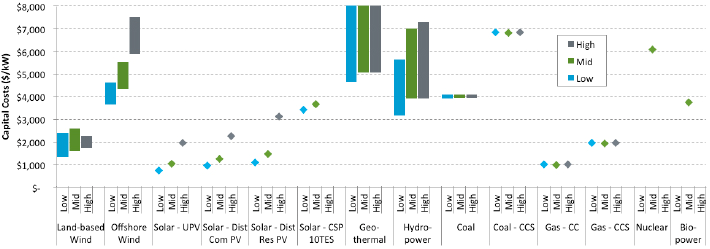
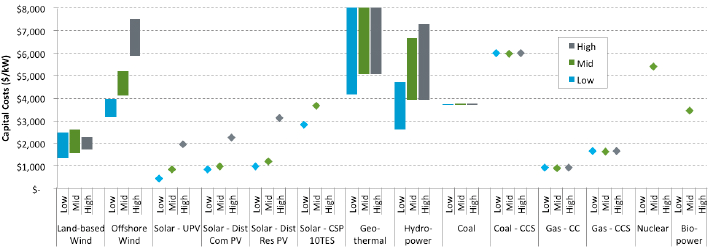
2016 ATB capital expenditure (CAPEX) range by technology for the given year. Values are in 2014$.

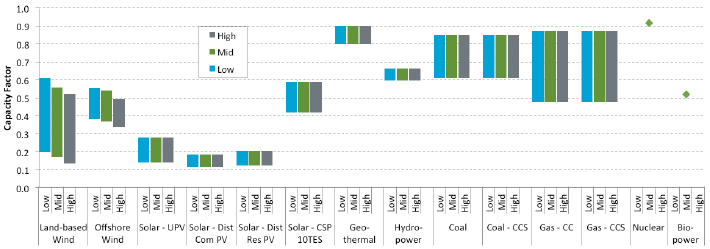
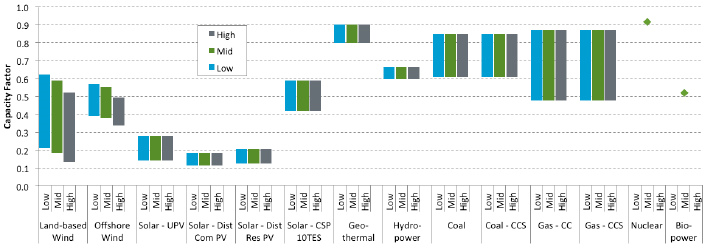
2016 ATB capacity factors range by technology type. Values are in 2014$.
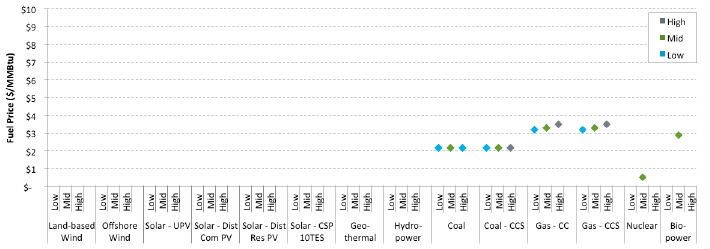
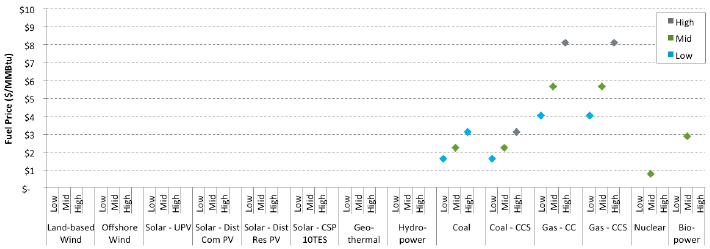
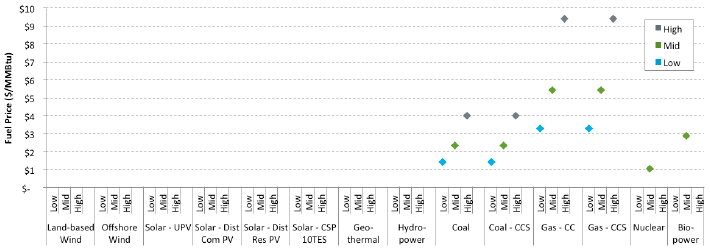
2016 ATB fuel price by technology. High, Mid, and Low refer to prices from specific projections in EIA's Annual Energy Outlook (AEO) 2016. Note: Applies only to generation technologies that rely on a fuel source. Values are in 2014$.
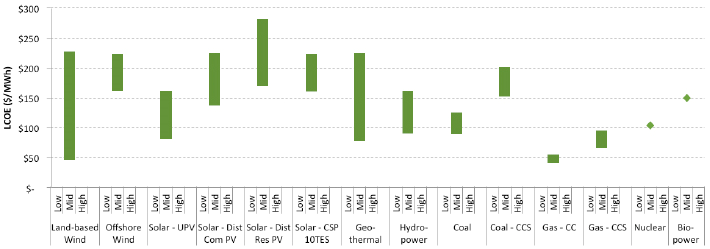
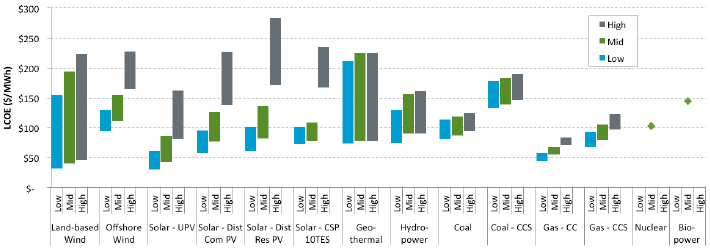
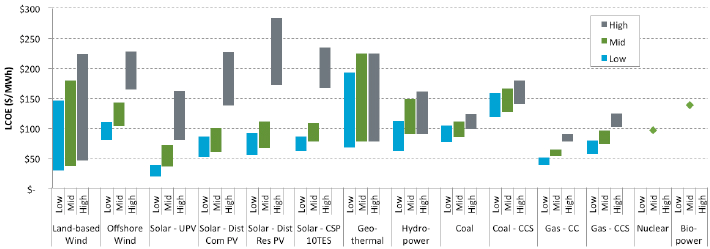
2016 ATB LCOE ranges by technology. Values are in 2014$. Note that while the levelized cost of electricity (LCOE) is provided as a simple or representative summary metric, it is not the focus of this work.