Deprecated: Creation of dynamic property atbOutline::$techLookup is deprecated in /var/www/html/web/models/atbOutline.class.php on line 170
Financial Cases and Methods
Financial assumptions impact LCOE by changing the cost of capital needed to finance electricity generation projects. The equations and variables used to estimate LCOE are defined on the Equations and Variables page. This section focuses on the input variables to WACC, which is used in the ATB as the discount rate input to the Capital Recovery Factor (CRF) for the LCOE formula. The CRF and the Project Finance factor determine the Fixed Charge Rate, which incorporates other elements of project finance including: the combined federal and state tax rate; the depreciation schedule of the asset; inflation rate; and tax incentives. However, as most of these other variables are set or would require political changes, we focus the discussion on the variables in WACC.
Financial Assumptions Cases
Two different cases with differing project finance assumptions are used within the ATB: the R&D Only Financial Assumptions Case (R&D Only Case) and the Market + Policies Financial Assumptions Case (Market + Policies Case), as described below. Use the following chart to explore the differences between the two financial assumptions cases.
The R&D Only, Market + Policies, and methodology and assumptions are described below.
- R&D Only Case
- Estimates technology-specific debt interest rates, return on equity rates, and debt fraction to reflect technological risk perception, however consistent sources of capital and ownership (i.e. Independent Power Producer self-financed)
- Holds tax and inflation rates constant at assumed 2019 values (21% federal tax rate, 6% state tax rate [though actual state tax rates vary], and 2.5% inflation rate)
- Excludes effects of tax credits.
- Market + Policies Case
- Retains the technology-specific return on equity rates developed in the R&D Only Case
- Debt interest rates increase by 1% between 2025 and 2030 for all technologies, reflecting an assumed return to long-term costs for underlying interest rates.
- Federal tax credits are applied and expire as consistent with existing law and guidelines.
- General Methodology and Assumptions
- Renewable Generators: financing terms projects owned by independent power producers (IPPs) that have entered into long-term, fixed-price, take-or-pay, power purchase agreements (PPAs) for the sale of the electricity. Though this is not the only arrangement, it is the dominant form of asset ownership and electricity offtake for new renewable energy assets in the United States.
- Financing Structure: IPP structure is assumed to internally capture the full benefits of tax credits, without the need for tax equity partnerships. Tax equity arrangements are currently a popular financing technique and generally offer lower-cost equity than sponsor equity, for a portion of the cost of eligible projects in exchange for the associated tax benefits, as not all companies are able to utilize all of the tax benefits. However, they also come with the costs of structuring, arranging the complex financial arrangements, and removing them when they are no longer necessary.
- Conventional Generators: financing terms reflect natural gas electric generation projects also owned by IPPs that sell power through either short-term contract a wholesale spot electricity market, which are otherwise known as "quasi-merchant" projects. Natural gas plants cannot get electricity price contracts of the same length as renewable energy generation assets because of the inability or prohibitive cost to contract, or hedge, fuel pricing, for more than a few years. Natural gas plants represent the vast majority of all recently installed conventional electricity generation, and they therefore represent "typical" financial transactions and financing terms.
- Coal Adjustment: 3% premium on WACC is added to coal electricity generation plants, consistent with EIA AEO financial assumptions.
- Risk Assessment: Financial assumptions reflect the differentiation of risk across technologies through varied financing terms. Although we recognize that in practice these risks may also be reflected in CAPEX, in soft costs, in a contingency fund, or elsewhere, we believe that reflecting risk in the financing terms is clearest and most consistent. Technology-specific debt interest rates, return on equity, and the debt fraction to reflect technological risk perception. Debt fraction is calculated using a separate financial model, with technology-specific ATB inputs, based on technology-specific assumed debt service coverage ratios (DSCRs).
- Domestic Focus: Assumptions primarily reflect technology risk within the U.S. market, with some consideration of international development. An individual technology may receive more-favorable financing terms outside the United States as a result of different macroeconomic factors (e.g., different regulations and different interest rates), more government interventions, or more market guarantees.
- Constant Technology Risk: Assumptions reflect no change in underlying risk perception for each technology over time. The modeled renewable technologies have globally deployed billions of dollars in CAPEX and currently receive more-favorable financing terms than other electric generation technologies. Though there is still opportunity for further risk perception reduction, because the cost of capital is so favorable, we assume a reduction in risk would likely result in higher equity returns (provided by greater leverage, which may be have a neutral impact on the overall cost of capital) or electricity offtake agreements that are currently considered riskier than a long-term PPA (i.e., selling electricity into wholesale markets). It should be noted that even if the reduction of risk does not lower cost, it has the potential to increase adoption by opening more markets and opportunities. At the same time, the differences in risk between technologies reflect underlying technology risks of construction and operation.
- Cost Recovery Period: Both cases assume a constant cost recovery period-or period over which the initial capital investment is recovered-of 30 years for all technologies. ATB also provides an option to look at cost recovery over a 20-year period.
In both financial assumptions cases, a constant cost recovery period—or period over which the initial capital investment is recovered—of 30 years is assumed for all technologies.
Methods for Developing Financial Assumptions
This approach to generating the financial assumptions includes technology-specific financial assumptions to capture more granularity of current and future energy markets, as well as to show changes in financing rates that are attributable to the reduction or elimination of tax credits for eligible technologies. Each technology has its own specific risk factors that may influence the underlying cost of financing. However, a multitude of other factors determine a project's cash flow risk, including:
- Political risk
- Regulatory uncertainty
- Developer risk
- Government support (if any)
- Ownership risk (IPP versus IOU versus public utility)
- Credit-worthiness of the electricity off-taker and the length of the contract (if any)
- Whether the electricity price is firm or changes with the market
- Supply and demand of competing electricity and sources of financing
- underlying inflation rate, and the cost of the base rate (e.g., LIBOR).
Additionally, some projects may receive more-favorable financing because of economies of scale (or, for some investment sources, minimum investment thresholds). For these reasons, there is a wide range in financing costs across the country, and world, even for the same technology.
To reduce the impact on non-technology-based risk factors and create a consistent financial landscape across technologies, we assume financing terms for renewable energy projects owned by IPPs who enter into long-term PPAs. Though this is not the only arrangement, it is the dominant form of asset ownership and electricity offtake for new renewable energy assets in the United States. Additionally, it avoids many of the financial risks associated with electricity offtake and price uncertainty. Financing terms for conventional energy generation reflect natural gas electric generation projects owned by IPPs that sell power through short-term contracts or through a wholesale spot electricity market—otherwise known as "quasi-merchant" projects.
Natural gas plants cannot get electricity price contracts of the same length as renewables because of the inability to contract, or hedge, fuel pricing, for more than a few years. Natural gas plants represent the vast majority of all recently installed conventional electricity generation and therefore the vast majority of all conventional electricity generation financing, and financing terms. We collected data from a variety of sources that have exposure to different renewable energy technology financings, both in the United States and abroad. In doing so, we tried to accurately represent typical financing costs for each technology as well as the differences, if any, between technologies. We collected data points for the:
- After-tax cost of levered equity during the construction and operation of the asset
- Cost of debt during the construction and operation of the asset
- Amount of debt provided during construction
- Required DSCR debt providers used to determine the amount of debt (i.e., leverage) they would provide to a project during the operation of the asset.
In the 2020 ATB—unlike in past years of the ATB—we added the cost of equity during construction. We made this change for two reasons:
- Construction debt providers almost always require that a certain percentage of construction costs (typically the first dollars spent) come from equity providers
- We hope to differentiate the cost of construction financing from the cost of financing during operations.
In particular, in previous years of the ATB, the cost of equity for geothermal plants was assumed to be much higher than other technologies to account for the risks during construction. By separating these two financing periods, we can lower the cost of equity for a geothermal plant during operation to make it more in-line with real-world financing terms.
The following graphic summarizes data gathered for the cost of equity by technology type, and to a lesser extent, contract type. The orange box shows the ATB after-tax cost of equity assumptions during project operation. These values are based on data for the levered after-tax returns and are influenced by the difference in unlevered returns between technologies, as well as tax equity returns. As shown, utility-scale PV requires the lowest rates of return, followed by distributed PV and land-based wind, and finally, the remainder of renewable energy technologies. In general, the rates of return increase with an increase in operation risk (e.g. more resource uncertainty, higher chance of mechanical failure). Also shown is the premium charged for contracts with less electricity price certainty (corporate offtakers, hedges). Corporate offtakers may have lower credit ratings (i.e. more perceived risk of default) than regulated utilities, and hedges do not necessarily offer full coverage and may be for shorter durations than standard contracts provided by utilities.
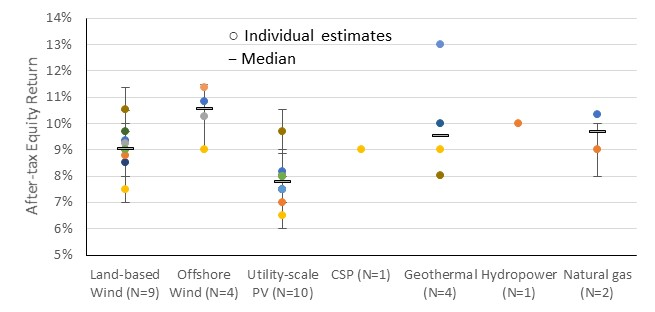
Based on industry interviews, we also include a 2% premium on the cost of equity during construction for each project, relative to the cost of equity during plant operation, to account for construction risk. Additionally, we separate the cost of equity during construction for geothermal into two stages: pre-drilling (assumed to be 15%), and post-drilling (with assumed site control in place, permitting completed, and a PPA contracted), with no premium on the cost of equity relative to the cost of equity during plant operation.
The following graphic shows collected data on the cost of debt for renewable energy assets. Publicly available data points represent a mix of renewable energy technologies, project and portfolio financings, timing and loan tenors (i.e., length) and actual versus modeled rates. Though "like-to-like" data comparisons are ideal, the data are limited and the data collected show a relatively consistent and fairly narrow spread between technologies. For ATB modeling purposes, we assume a 4.0% term interest rate (inclusive of fees and reserves) for all renewable energy technologies, reflecting the mix of data types and level of precision of in data.
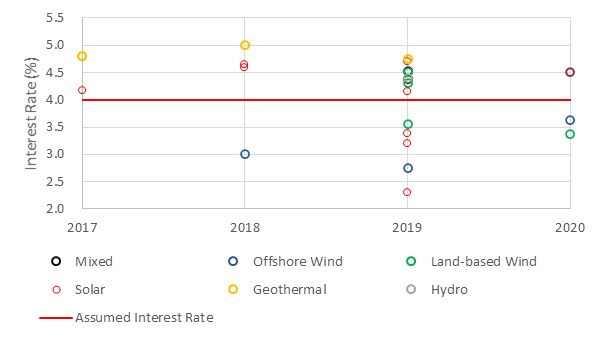
According to Norton Rose Fulbright (2020), interest during construction is approximately 0.5% lower than term debt, which we implement for all technologies but offshore wind, geothermal, and hydropower, where there is inherently greater construction risk. Additionally, in the Market + Policies Case, we assume interest rates increase from 2025 to 2030 by 1% (i.e., 100 basis points) across the board, to account for the current lower interest-rate environment. Though the expectation that interest rates will rise in the future is already priced in the swap rate (interest rate swaps represent the trading of floating interest rates for fixed interest rates and are a standard part of renewable energy debt financing) of current debt pricing, a return to the mean would likely increase rates more. We chose 2025 as the starting point for the interest rate increase to simplify calculations and assumptions, given that is when all tax credits expire or revert to their lower value.
The following graphic shows collected data on the debt service coverage ratios (DSCRs) for renewable energy assets, as well as the assumed DSCR for the 2020 ATB analysis. P50 represents an average-level of energy production (or 50% likelihood to generate that much or more electricity), while P99 represents a production level that the project has a 99% chance of exceeding. Assumed P50 DSCR, per technology, is based on collected data of P50 DSCR and is influenced by the difference in average DSCRs between technologies in P90 and P99 scenarios, as well as collected DSCRs from ratings agencies for stress modeling cases (not shown).
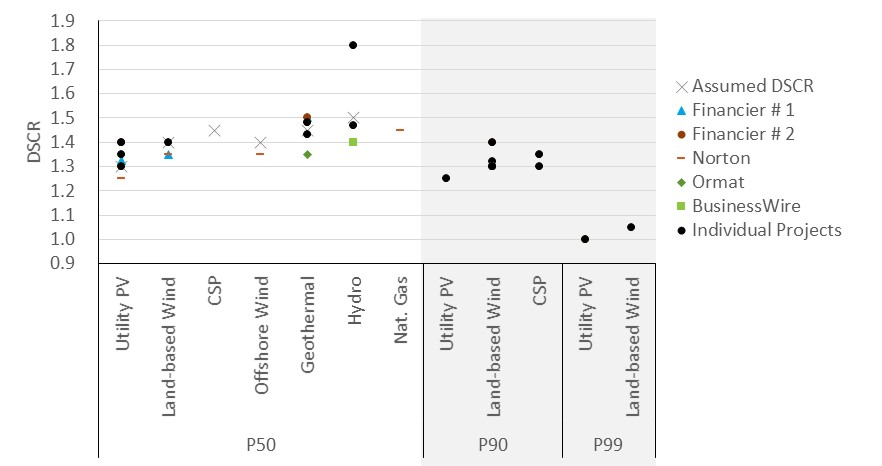
Similar to the cost of equity, technologies with greater operating risk tend to have higher DSCR. This is validated by a recent report from Fitch Ratings, which stated that, "More than a decade of analysis shows that solar resources are consistently more stable and predictable than wind, resulting in less volatile revenues and generally higher ratings" (Crowell, 2020). As another example, land-based and offshore wind were reported to have the same DSCR, because the greater O&M uncertainty of offshore wind (i.e., maintaining an asset in the ocean) was counterbalanced by having more certainty in wind speed than land-based wind.
The following table summarizes financial assumptions by technology during the project's operation.
Operation |
Construction |
||||||
Technology |
Electricity Sales |
After-tax Equity Returns |
Term Debt: 2018/2030 |
DSCR |
After-tax Equity Returns |
Construction Debt: 2018/2030 |
Leverage |
Utility PV |
IPP |
7.75% |
4.0%/5.0 |
1.30 |
9.5% |
3.5%/4.5% |
80% |
Residential and Commercial PV |
IPP |
8.75% |
4.0%/5.0 |
1.30 |
10.5% |
3.5%/4.5% |
80% |
CSP |
IPP |
10.0% |
4.0%/5.0 |
1.45 |
12.0% |
3.5%/4.5% |
80% |
Land-based Wind |
IPP |
9.0% |
4.0%/5.0 |
1.40 |
11.0% |
3.5%/4.5% |
80% |
Offshore Wind |
IPP |
10.0% |
4.0%/5.0 |
1.40 |
12.0% |
4.0%/5.0 |
80% |
Geothermal |
IPP |
10.0% |
4.0%/5.0 |
1.45 |
Pre-drilling: 15% Post-drilling: 10% |
4.0%/5.0 |
Pre-drilling: 0% Post-drilling: 75% |
Hydropower |
IPP |
10.0% |
4.0%/5.0 |
1.50 |
12.0% |
4.0%/5.0 |
80% |
Natural Gas |
Quasi-merchant |
10.0% |
5.0%/6.0 |
1.45 |
12.0% |
3.5%/4.5% |
80% |
Another important factor in determining the financial structure for a renewable energy project is the level of tax credits, if any. Below is a summary of the tax credits assumed in our analysis. We assume eligible projects will use the full duration of the "safe harbor" window in order to receive the maximum tax credit level. We also assume offshore wind elects the ITC over the PTC to maximize economic value. Finally, we assume geothermal elects the PTC over the permanent 10% ITC from 2018 through 2024 in order to maximize economic value; from 2025 onwards when the PTC is no longer available, geothermal uses ITC.
Based on these assumptions, as well as CAPEX, FOM, VOM, capacity factor, and fuel costs, we ran financial models to calculate a technology's leverage as governed by the minimum DSCR, assuming a debt term of 18 years (which is a common debt amortization period for U.S. renewable energy projects). In general, leverage only varied significantly over time due to changes to interest rate, tax rate, and the amount of tax credits received, but not by CAPEX, FOM or capacity factor. For this reason, the same leverage can be used by a technology for different resource areas. The exception to this is projects receiving the PTC (i.e., land-based wind); because PTC value represents a different percentage of project costs for different resource classes, leverage changes. A similar, but smaller, change can also be seen for natural gas, depending on fuel price. Because we cannot input different leverage values for different resource classes in the ATB (because of current programming constraints), we used the leverage for wind speed class 4 , because it is currently the most common resource level for land-based wind systems. It is important to keep in mind that these relationships occur because the financial model (and the ATB) solve for LCOE, which represents the electricity rate needed to achieve specific economic returns. If the financial models were to solve for economic returns, given an assumed electricity rate, the leverage on projects with higher capacity factors (all other things being equal) would be greater than those with lower capacity factors. The following figures summarize the calculated leverages for the ATB.
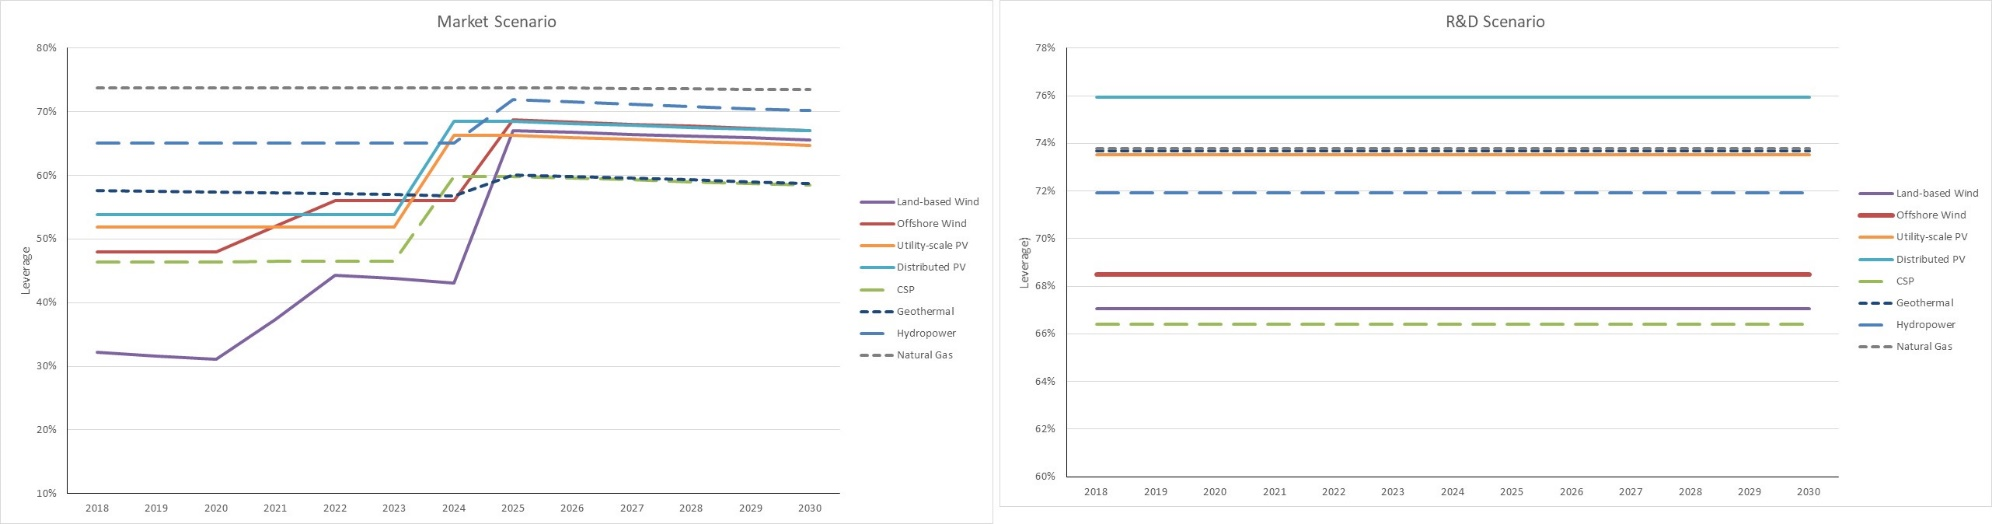
In the R&D Only cases, leverage between renewable energy technologies only varies from 66% to 76%. A certain degree of variability in leverage exists between technologies because of differences in capacity factors, return on equity, DSCR, and interest rates. In the Market + Policies case, the leverage on technologies with tax credits increases as these credits phase out, and then decreases incrementally from 2025 to 2030 as interest rates rise. Solar and geothermal technologies, in the Market + Policies case, have the lowest leverage in 2030 because of the continued use of the 10% ITC. Using these values, we calculated WACC for the different technologies, which is summarized in the following figure.
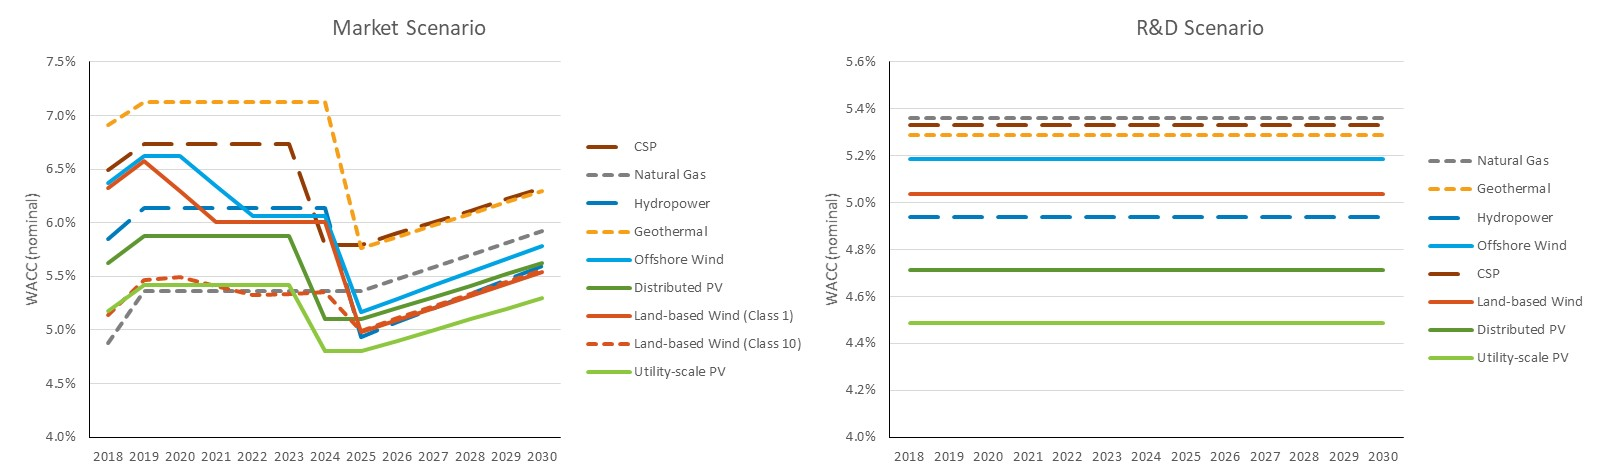
In the R&D Only case, the after-tax WACC between technologies varies from 4.2% to 5.3% for renewable energy technologies, and it is 5.4% for natural gas. A certain degree of variability in WACC exists because of underlying construction and operation risks, as well as contract risk for natural gas. In the Market + Policies Case, the WACC on technologies with tax credits decreases as these credits phase out. WACC subsequently increases from 2025 to 2030 as interest rates rise.
It is important to keep in mind that financing costs are one piece of the overall competitiveness of a project. While projects receiving tax credits may have lower leverage, and thus a higher weighted average cost of capital, they benefit from the tax credits, which overall, are reducing the LCOE. Likewise, wind speed class 1 would have a higher WACC than wind speed class 10 , but that is because the cost of energy of wind speed class 10 is much higher, and so can support a higher modeled debt fraction. Natural gas has the highest calculated leverage but still has the highest WACC because of the increased cost of debt and equity (owing, in part to it being the only technology analyzed to not have fully contracted cash flows). However, in 2018, natural gas still has some of the lowest ATB LCOEs, is not dependent on long-term fixed contracts, and may be more competitive in markets for reasons not captured by LCOE (e.g., capacity credit).
Looking forward, we did not assume a change to the cost of equity or DSCR because many factors might influence these variables to be higher or lower. And many of these factors are political, corporate, or regulatory changes (e.g., the ability to get long-term contracted cash flows). The renewable energy industry is actively working to continue to remove the risk and uncertainty associated with these technologies, and to provide a more consistent expectations of electricity production (e.g., lower failure rates, better energy production forecasting, and more consistent resource availability through higher towers). However, renewable energy assets already receive relatively favorable financing because of their ability to receive long-term fixed electricity contracts, the relative demand for "green investments," and the lower-risk benefits of tax credits. Which of these factors will change in the future is unclear. Utilities may stop offering long-term contracts or project owners may be exposed to more curtailment risk. On the other hand, with the push by many states for higher amounts of carbon-free electricity, utilities may see these long-term contracts as low-cost options to satisfying these requirements; without long-term contracts, utilities may incur higher costs because of the increase in financing costs caused by shorter contracts. Additionally, while curtailment and value loss could be more of an issue in the future as renewable energy assets make up a larger share of the total electricity generation mix, many active mitigation strategies are being developed, both from individual actors, like pairing storage with renewable energy electric generation, or through larger, grid-level activities. And, while improvements in DSCR, through lower risk perception, may support higher project leverage, this benefit may be counteracted by higher equity returns achieved through higher leverage. Historically there have been many international renewable energy projects with slightly higher leverage and higher equity returns. We collected data from 174 global renewable energy projects.
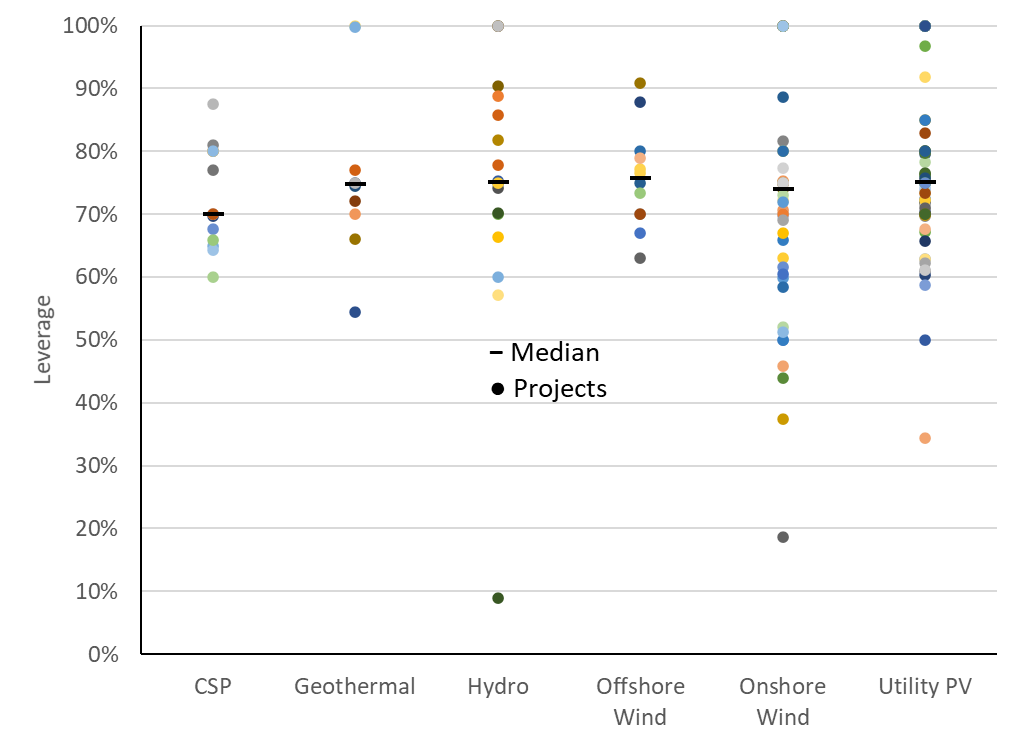
Although leverage varies dramatically between individual projects, the median leverage is generally around 75%, with no clear differences between technologies. The differences are further lessened when removing the projects that received more than 80% financing through debt, with the median dropping to around 70% for all technologies, which roughly matches the approximate leverage calculated for technologies in the 2020 ATB. Many of these high-levered projects received government, or quasi-government (e.g., World Bank), assistance in the form of non-market loan terms (e.g., 30-year terms), loan guarantees, or favorable credit guidelines. Many also received higher returns than projects in the United States, in the mid-teens, which allowed for even greater leverage, as higher equity returns are achieved by higher-priced electricity or other revenue streams, which allow more debt for the same DSCR. This is not to say that research on risk reduction is not a critical part of providing favorable renewable energy project economics, only that reductions in perceived risk will not necessarily lower the absolute cost of financing from current levels—rather it will likely keep rates as low as the market will bear. Reducing risk also allows for increased deployment by opening markets or projects that would have otherwise been too risky.
References
The following references are specific to this page; for all references in this ATB, see References.
Berkshire Hathaway Energy (2018). Form 10-K for the Fiscal Year Ended December 31, 2017. Berkshire Hathaway Energy.
BNEF (2019). 2H 2019 LCOE Update. Bloomberg New Energy Finance.
BNEF (n.d.). Renewable Energy Projects Database.
Brookfield Renewable Partners (2020). Form 10-K for the Fiscal Year Ended December 31, 2019. Brookfield Renewable Partners.
Business Wire (2015). Fitch Affirms FirstLight Hydro's $320MM Mortgage Bonds at 'BB-'; Outlook Revised to Stable. Business Wire. https://www.businesswire.com/news/home/20150313005832/en/Fitch-Affirms-FirstLight-Hydros-320MM-Mortgage-Bonds
Credit Agricole Securities (2018). Project Bonds: Solar (Project Bond Focus 2018). Credit Agricole Securities. https://www.ca-cib.com/sites/default/files/2018-11/Project%20Bond%20Focus%202018%20-%20Solar%20_%20FINAL.PDF
Credit Agricole Securities (2018). Project Bonds: Wind (Project Bond Focus 2018). Credit Agricole Securities. https://www.ca-cib.com/sites/default/files/2018-11/Project Bond Focus 2018 - Wind _ FINAL.PDF
Crowell, Chris (2020). Fitch: Solar Consistently Beats Wind in Global Renewable Energy Project Ratings. Solar Builder. https://solarbuildermag.com/news/fitch-solar-consistently-beats-wind-in-global-renewable-energy-project-ratings/
Dumoulin-Smith, J., Shelekhin, A., Morgan, A., Li, A., Ciciarelli, R., & Greenwald, R. (2020). Power, Utilities, Renewables, LNG: Renewable Trends 2020. Bank of America: BofA Securities.
Guillet, Jérôme, & Green Giraffe. (2018). Who Will Fund US OW and on What Terms?. https://green-giraffe.eu/sites/green-giraffe.eu/files/180904_usow_implementation_-_funding_-_guillet_as_sent.pdf
New Energy Update (2019). World's Largest CSP Project Achieves Financial Closure: US Announces $33mn CSP Funding. https://analysis.newenergyupdate.com/csp-today/worlds-largest-csp-project-achieves-financial-closure-us-announces-33mn-csp-funding
Nextera Energy (2019). Tax Equity Partnership: Differential Membership Interests. Nextera Energy.
Norton Rose Fulbright (2019). Project Finance Newswire: US Offshore Wind: Current Financing Conditions. Norton Rose Fulbright.
Norton Rose Fulbright (2019). Project Finance Newswire: US Solar Financing Update. Norton Rose Fulbright.
Norton Rose Fulbright (2020). Project Finance Newswire: Cost of Capital: 2020 Outlook. Norton Rose Fulbright. https://www.projectfinance.law/publications/cost-of-capital-2020-outlook
Ormat Technologies (2018). Form 10-K for the Fiscal Year Ended December 31, 2017. Ormat Technologies.
Ormat Technologies (2019). Form 10-K for the Fiscal Year Ended December 31, 2018. Ormat Technologies.
Ormat Technologies (2020). Form 10-K for the Fiscal Year Ended December 31, 2019. Ormat Technologies.
Terraform Power (2019). Form 10-K for the Fiscal Year Ended December 31, 2018. Terraform Power.
Thompson Reuters (2018). League Tables 2017. Thompson Reuters.
Thompson Reuters (2019). League Tables 2018. Thompson Reuters Project Finance International.
World Bank (2014). International Bank for Reconstruction and Development Project Appraisal Document on a Proposed Loan in the Amount of EUR234.50 Million and US$80 Million (US$400 Million Equivalent) and a Proposed Loan from the Clean Technology Fund in the Amount of US$119 Million to the Moroccan Agency for Solar Energy with Guarantee from the Kingdom of Morocco for the Noor-Ouarzazate Concentrated Solar Power Plant Project. (No. PAD1007). The World Bank. http://documents.worldbank.org/curated/en/748641468279941398/pdf/PAD10070PAD0P100disclosed0120220140.pdf
Ørsted (2018). Ørsted Capital Markets Day 2018: Update on Strategy and Capital Allocation. https://orsted.com/cmd2018presentation
Developed with funding from the U.S. Department of Energy’s Office of Energy Efficiency and Renewable Energy.