Deprecated: Creation of dynamic property atbOutline::$techLookup is deprecated in /var/www/html/web/models/atbOutline.class.php on line 170
Project Finance Impact on LCOE
Levelized cost of energy (LCOE) is a simple metric that combines the primary technology cost and performance parameters: CAPEX, O&M, and CF. It is included in the ATB for illustrative purposes. The ATB focuses on defining the primary cost and performance parameters for use in electric sector modeling or other analysis where more sophisticated comparisons among technologies are made. The LCOE accounts for the energy component of electric system planning and operation. The LCOE uses an annual average capacity factor when spreading costs over the anticipated energy generation. This annual capacity factor ignores specific operating behavior such as ramping, start-up, and shutdown that could be relevant for more detailed evaluations of generator cost and value. Electricity generation technologies have different capabilities to provide such services. For example, wind and PV are primarily energy service providers while the other electricity generation technologies provide capacity and flexibility services in addition to energy. These capacity and flexibility services are difficult to value and depend strongly on the system in which a new generation plant is introduced. These services are represented in electric sector models such as the ReEDS model and corresponding analysis results such as the Standard Scenarios.
To estimate LCOE, assumptions about the cost of capital to finance electricity generation projects and the period over which that investment is recovered are required. The sensitivity of LCOE to these values is shown below. The equations and variables used to estimate LCOE are defined on the equations and variables page. For LCOE estimates for the Constant, Mid, and Low technology cost scenarios for all technologies, see 2018 ATB Cost and Performance Summary.
Sensitivity to Project Finance Parameters
In the 2018 ATB, three options representing market conditions for project finance are available. The R&D Only LCOE presents the range of LCOE based on macroeconomic conditions specified for each technology. The R&D + Market LCOE demonstrates the range ofLCOE based on macroeconomic conditions assumed in EIA's Annual Energy Outlook. The ATB data spreadsheet contains a third set of market conditions consistent with Standard Scenarios model results. A constant cost recovery period-over which the initial capital investment is recovered-of 30 years is assumed for all technologies.
- R&D Only Financial Assumptions: This sensitivity case allows technology-specific changes to debt interest rates, return on equity rates, and debt fraction to reflect effects of R&D on technological risk perception, but it holds background rates constant at 2016 values from AEO 2018 and excludes effects of tax reform, tax credits, and tariffs.
- R&D Only + Market Financial Assumptions: This sensitivity case retains the technology-specific changes to debt interest, return on equity rates, and debt fraction from the R&D Only case and adds in the variation over time consistent with AEO 2018, as well as effects of tax reform, tax credits, and tariffs. For a detailed discussion of these assumptions, see Changes from 2017 ATB to 2018 ATB.
- ReEDS Financial Assumptions: ReEDS uses the R&D Only + Market Financial Assumptions for the "Mid" technology cost scenario.
The following figure illustrates the sensitivity of Base Year LCOE values to these financial assumptions.
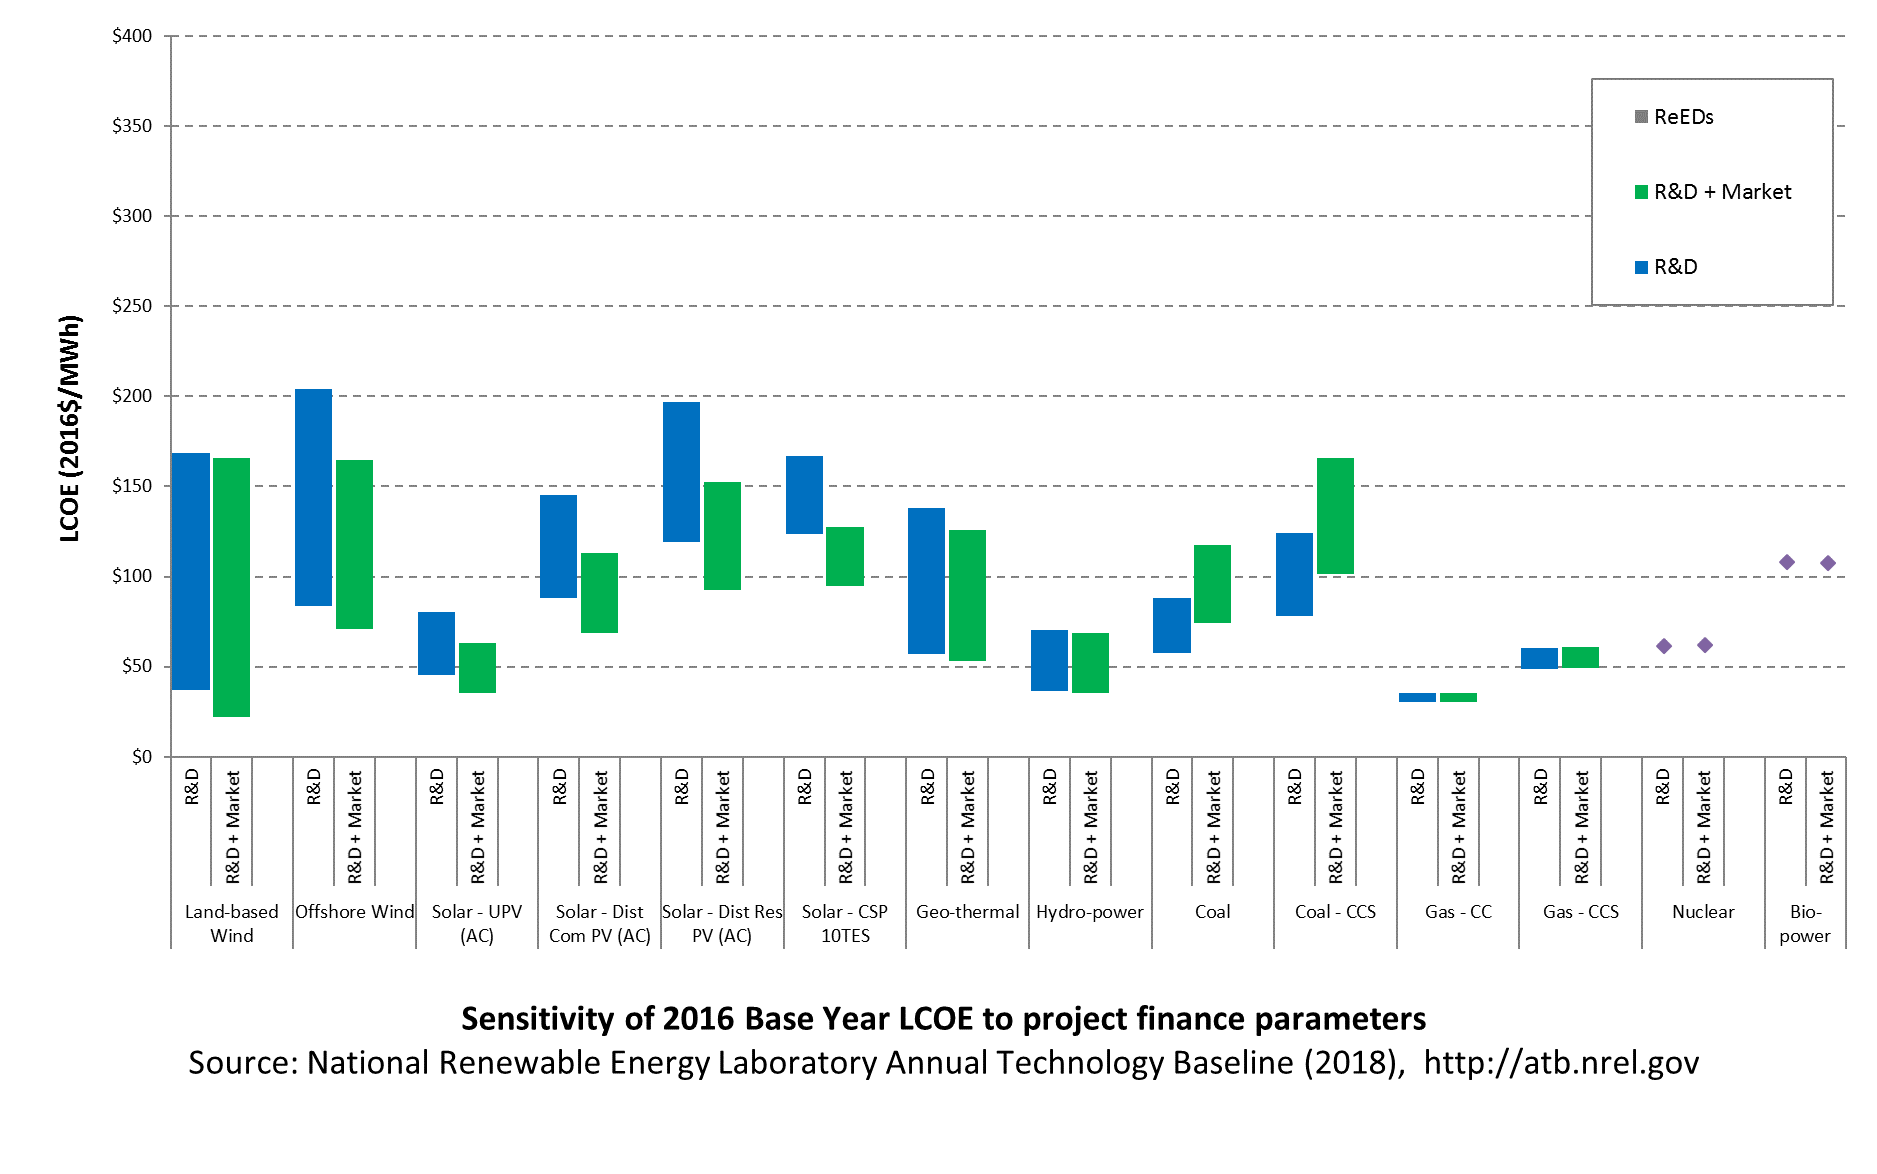
The range of LCOE for renewable technologies reflects the range of available resource conditions. The range of LCOE for coal and natural gas plants reflects the two capacity factor values implemented in theATB.
The previous figure is intended to illustrate the impact that financial assumptions have on LCOE estimates. It is not intended to predict future market conditions.
The following table summarizes the rationale behind the differentiated financial assumptions across the technologies:
| Technology | Financial Assumptions | Difference Relative to Mature Technology Financing | Rationale |
|---|---|---|---|
| Land-Based Wind | Mature | ||
| Offshore Wind | Developing | 3 percentage point premium on equity rate of return, 10% lower (absolute) debt fraction | There is still more project risk in offshore wind than in land-based wind due to the minimal U.S. installations and a relatively high cancellation rate to-date. |
| Utility-Scale PV | Mature | ||
| Commercial PV | Mature | ||
| Residential PV | Mature | ||
| Concentrating Solar Power | Developing | 4 percentage point premium on equity rate of return, 10% lower (absolute) debt fraction | CSP currently has lower levels of deployment, has historically relied on governmental involvement with financing, and has had recent project start-up challenges. |
| Geothermal | Developing | 10 percentage point premium on equity rate of return, 10% lower (absolute) debt fraction. | There is exploration and well field development risk in early project stages. |
| Hydropower | Infrastructure | 100% bond financing | Many hydropower plants have been financed in this manor in the past. |
| Natural Gas | Mature | ||
| Coal | Risky | 3 percentage point premium on equity rate of return | Regulatory risk |
| Nuclear | Mature | ||
| Biopower | Mature | ||
Sensitivity to Cost Recovery Period
An important assumption for computing LCOE is the period over which the electricity generation plant cost and performance are levelized. In the ATB, this period is defined as the cost recovery period, and it represents the period over which the initial capital investment to build a plant is recovered.
The following figure illustrates the sensitivity of Base Year LCOE values to changes in the cost recovery period, showing cost recovery periods of 20 years and 30 years for all technologies. This approach reflects the perspective of a hypothetical investor that evaluates each technology investment over a common capital recovery time horizon independent of the technology.
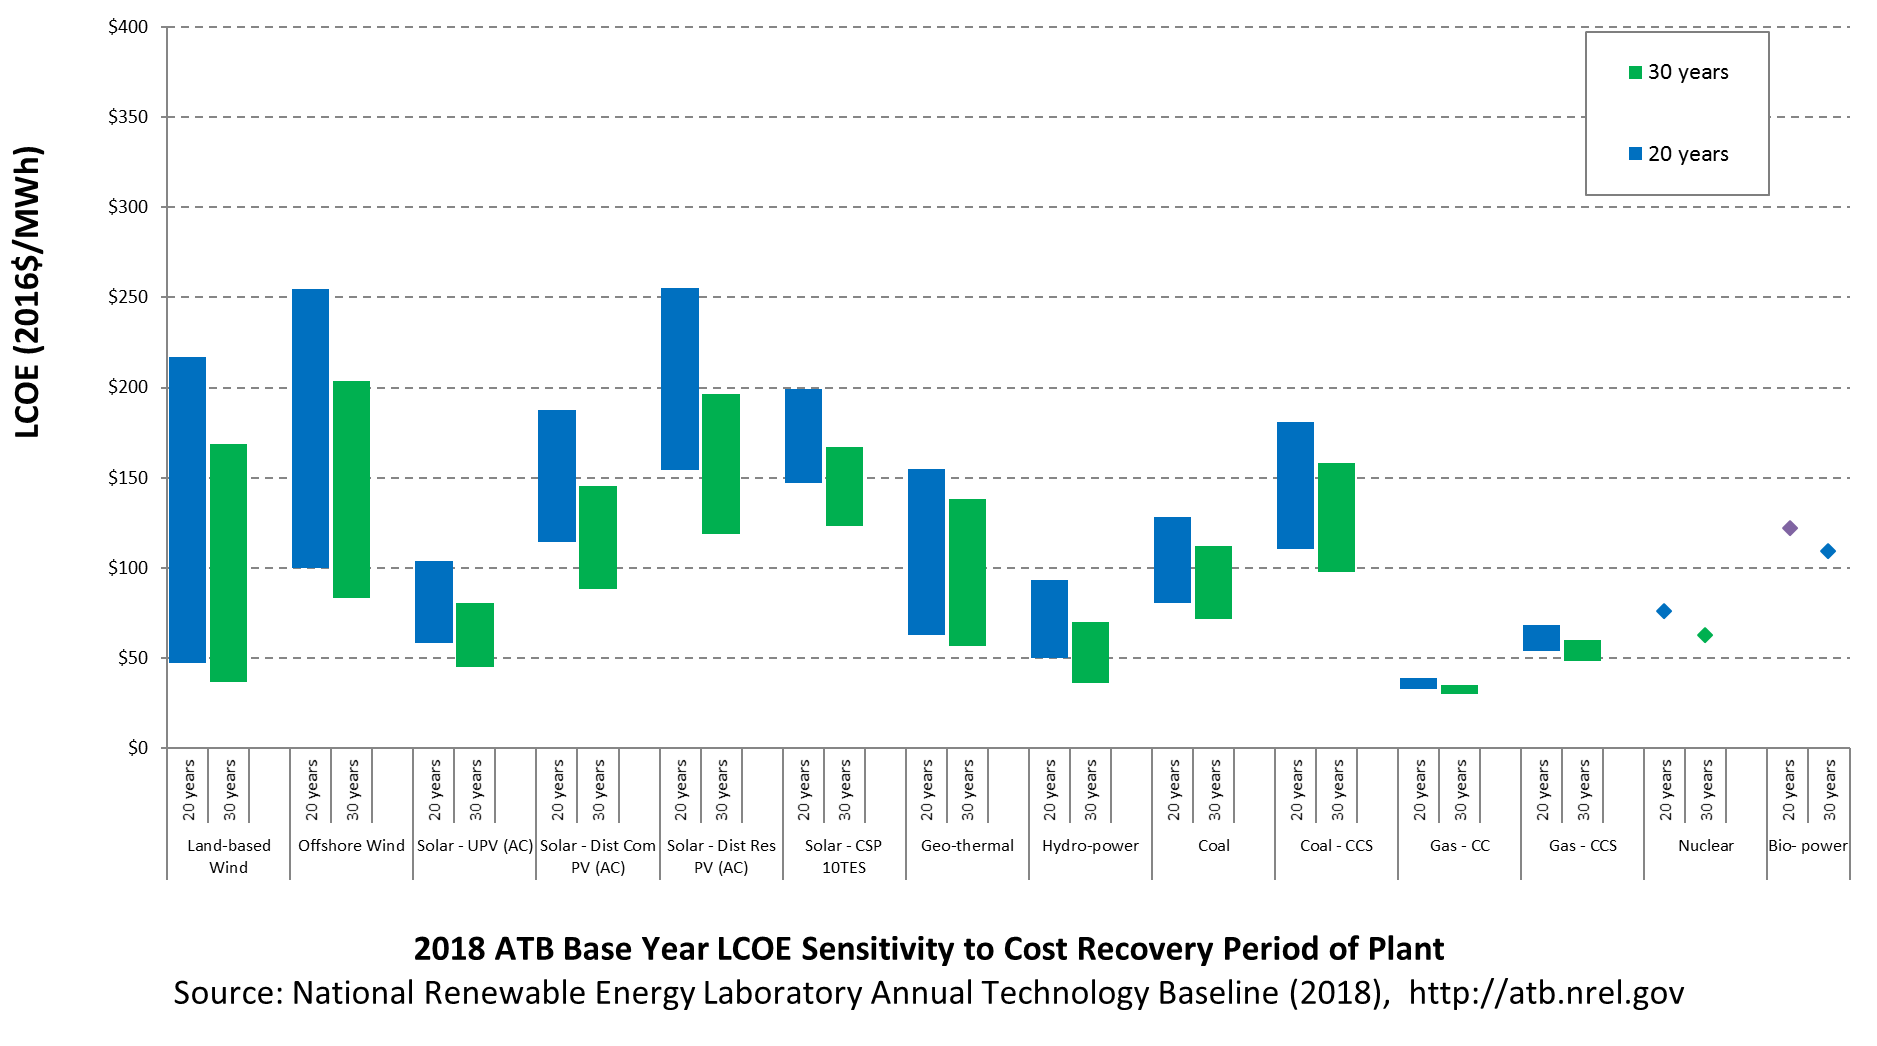
The range of LCOE for renewable technologies reflects the range of available resource conditions. The range of LCOE for coal and natural gas plants reflects the two capacity factor values implemented in theATB.
The technical life for each technology is shown in the following table. A technical life that is longer than the cost recovery period means there may be residual value left after costs have been recovered. The technical life values in the table are updated from those previously implemented in the ReEDS model and reflected in prior versions of ATB and Standard Scenarios model results to reflect a 30-year life for wind technologies consistent with current industry trends.
| Technology | Technical Life (years) |
|---|---|
| Land-based wind | 30 |
| Offshore wind | 30 |
| Solar-utility PV | 30 |
| Solar-distributed commercial PV | 30 |
| Solar-distributed residential PV | 30 |
| Solar-CSP | 30 |
| Geothermal | 30 |
| Hydropower | 100 |
| Coal | 75 |
| Gas - CC | 55 |
| Gas - CCS | 55 |
| Nuclear | 60 |
| Biopower | 45 |
Assumptions about the residual value of the plant over time, major component replacement or repair time schedules, and contractual or regulatory renewal schedules (e.g., licenses or leases) would affect the period over which a plant may operate. In general, cost recovery period will be less than or equal to technical life so that capital investments are recovered before the plant is no longer technically viable.
References
EIA (U.S. Energy Information Administration). 2018. Annual Energy Outlook 2018 with Projections to 2050. Washington, D.C.: U.S. Department of Energy. February 6, 2018. https://www.eia.gov/outlooks/aeo/pdf/AEO2018.pdf.