Deprecated: Creation of dynamic property atbOutline::$techLookup is deprecated in /var/www/html/web/models/atbOutline.class.php on line 170
ATB in Context
For reference, we compare ATB scenarios with other sources: literature sources and the Annual Energy Outlook (EIA).
ATB Comparisons to the Literature
This section compiles capital expenditure projections from the literature in comparison to ATB scenarios for each technology. For discussion of the methods used to relate ATB scenarios to literature projections, please refer to individual technology sections.
Land-Based Wind
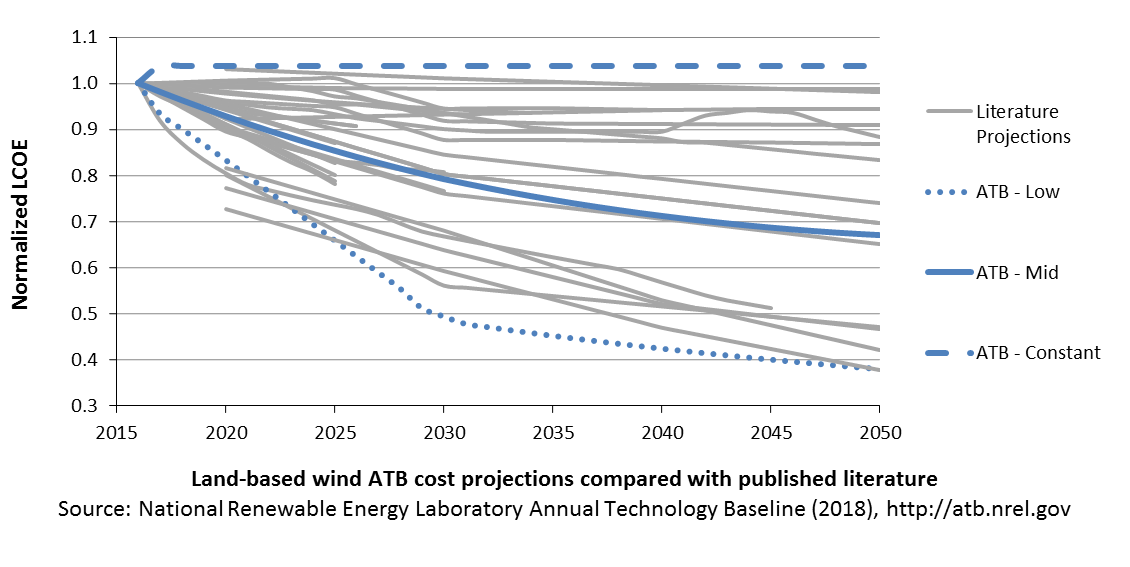
Projections of the cost of wind energy from the literature provide context for the ATB Constant, Mid, and Low technology cost projections. The ATB Mid cost projection, which corresponds to the Median scenario from the expert survey, results in LCOE reductions that are slightly lower than other median scenarios in the literature (ARUP (2011); BNEF (2015); E3 (2014); EIA (2014); EPA (2015); GWEC (2014); IEA (2015c); IRENA (2016a); Teske et al. (2015)). The ATB Low cost projection, which corresponds to the NREL bottom-up cost analysis, is similar to the lower bound of the sample of literature projections (BNEF (2016); IEA (2015c); MAKE (2015)).
- Mid case projection institutions: Ove Arup & Partners Ltd., Bloomberg New Energy Finance, Energy and Environmental Economics, U.S. Energy Information Administration, United States Environmental Protection Agency, Global Wind Energy Council, International Energy Agency, International Renewable Energy Agency, and Greenpeace.
- Low case projection institutions: Bloomberg New Energy Finance, International Energy Agency, and MAKE Consulting.
To jump to the 2018 ATB Land-Based Wind section, click here.
Offshore Wind
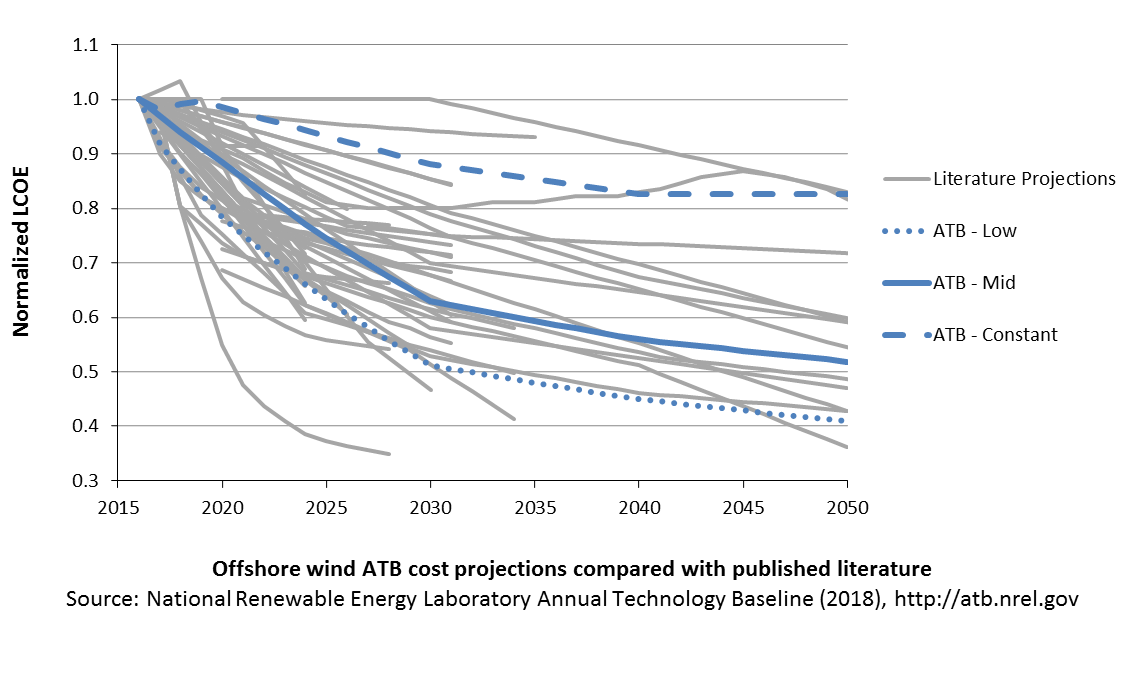
A broad sample of cost of offshore wind energy projections provides context for the ATB Constant, Mid, and Low technology cost projections. Based on a TRG4 resource classification,[2] the ATB Mid cost projection, which corresponds to the median scenario from the Wiser et al. (2016) expert survey, results in LCOE reductions that are fairly aligned with the median scenarios of external studies (BNEF (2017c); IRENA (2016b); Catapult (2016); Lazard (2017)). EIA (2017b) estimates higher cost levels in the period 2022-2041, while BNEF (2018) estimates lower cost levels for the U.S by the mid-2020s. These external studies were reviewed to validate the baseline estimates and projections derived for the ATB. Generally, while some published studies as well as recent tender awards for European projects to be installed by the mid-2020s suggest significant near-term cost reduction (see e.g., Musial et al. (2017)), it is likely that the United States will lag due to a different development stage of the U.S. supply chain and port infrastructure.
To jump to the 2018 ATB Offshore Wind section, click here.
Utility-Scale PV
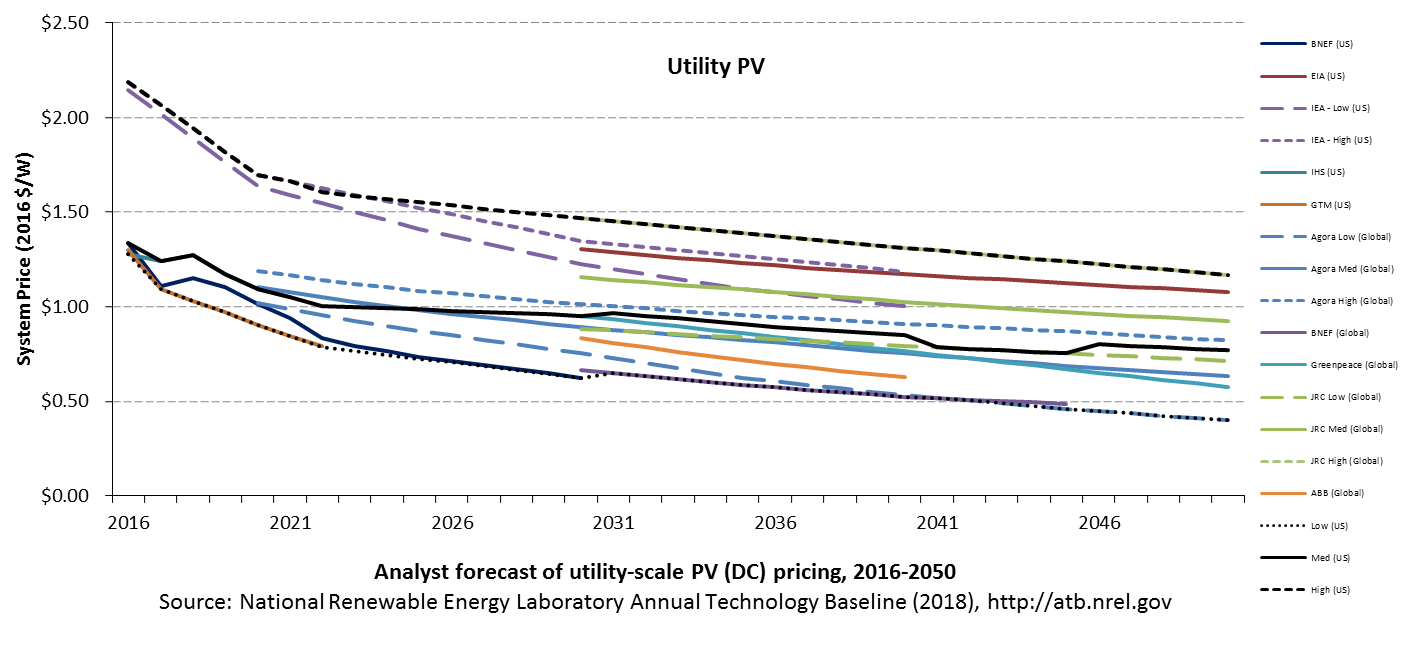
Projections of future utility-scale PV plant CAPEX are based on 15 system price projections from 9 separate institutions. Projections include short-term U.S. price forecasts (BNEF (2017a); GTM Research (2016); EIA 2017; IEA (2016); IHS (2017)) made in the past year and long-term global and U.S. price forecasts (ABB (2017); BNEF (2017b); Carlsson et al. (2014); Fraunhofer ISE (2015); Teske et al. (2015)) made in the past four years. The short-term forecasts were primarily provided by market analysis firms with expertise in the PV industry, through a subscription service with NREL. The long-term forecasts primarily represent the collection of publicly available, unique forecasts with either a long-term perspective of solar trends or through capacity expansion models with assumed learning by doing.
- Short-Term Forecast Institutions: Bloomberg New Energy Finance, GTM Research, IHS Technology, International Energy Agency
- Long-Term Forecast Institutions: ABB, Agora Energiewende , Bloomberg New Energy Finance, European Commission's Joint Research Centre, Greenpeace & Global Wind Energy Council, International Energy Agency, U.S. Energy Information Administration.
To jump to the 2018 ATB Utility-Scale PV section, click here.
Commercial PV
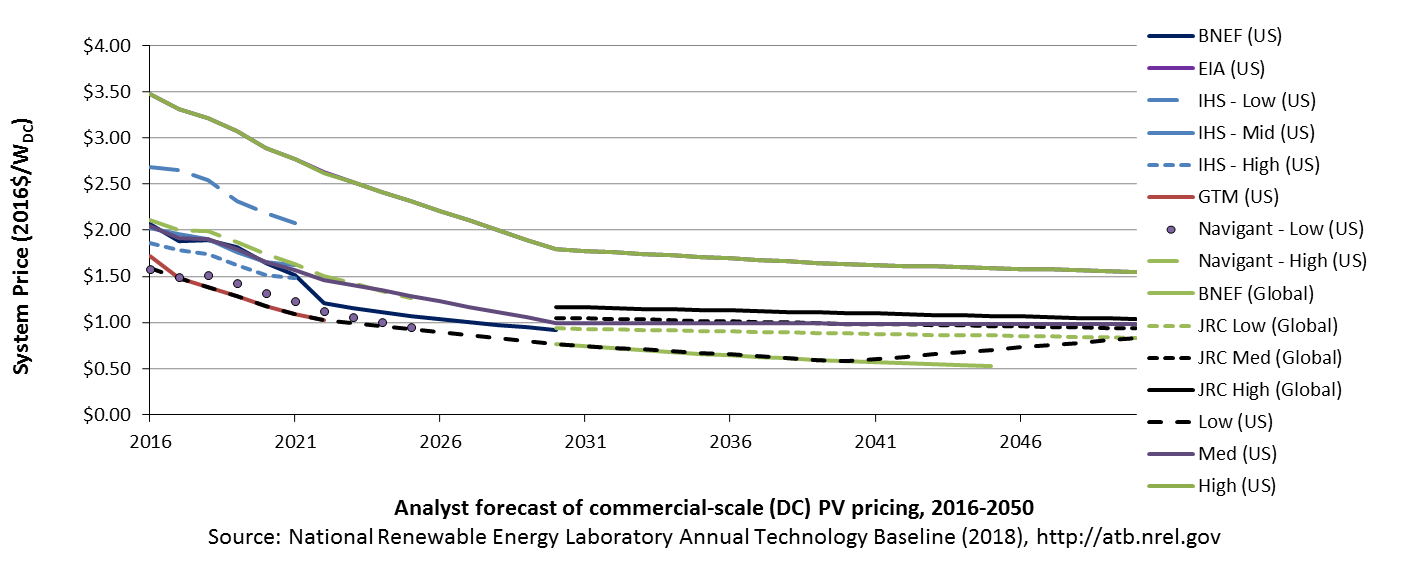
Projections of future commercial PV installation CAPEX are based on 12 system price projections from 6 separate institutions. Projections included short-term U.S. price forecasts made in the past six months and long-term global and U.S. price forecasts made in the past primarily provided by market analysis firms with expertise in the PV industry, through a subscription service with NREL. The long-term forecasts primarily represent the collection of publicly available, unique forecasts with either a long-term perspective of solar trends or through capacity expansion models with assumed learning by doing.
- Short-Term Forecast Institutions: Bloomberg New Energy Finance, GTM Research, IHS Technology, Navigant Research (Labastida and Gauntlett (2017)), U.S. Energy Information Administration
- Long-Term Forecast Institutions: Bloomberg New Energy Finance, European Commission's Joint Research Centre, and U.S. Energy Information Administration.
To jump to the 2018 ATB Land-Based Wind section, click here.
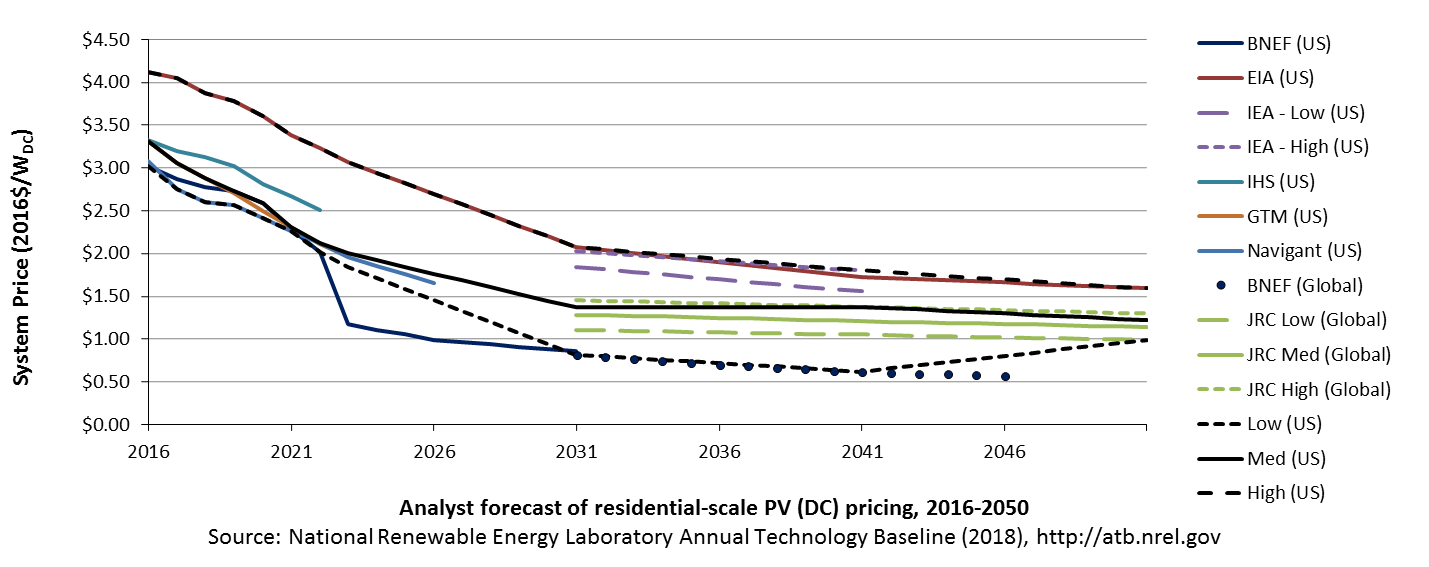
Residential PV
Projections of future residential PV installation CAPEX are based on 11 system price projections from seven separate institutions. Projections include short-term U.S. price forecasts made in the past year and long-term global and U.S. price forecasts made in the past four years. The short-term forecasts were primarily provided by market analysis firms with expertise in the PV industry, through a subscription service with NREL. The long-term forecasts primarily represent the collection of publicly available, unique forecasts with either a long-term perspective of solar trends or through capacity expansion models with assumed learning by doing.
- Short-Term Forecast Institutions: Bloomberg New Energy Finance, GTM Research, IHS Technology, International Energy Agency, Navigant Research (Labastida and Gauntlett (2017)), U.S. Energy Information Administration
- Long-Term Forecast Institutions: Bloomberg New Energy Finance, European Commission's Joint Research Centre, International Energy Agency, U.S. Energy Information Administration.
To jump to the 2018 ATB Residential PV section, click here.
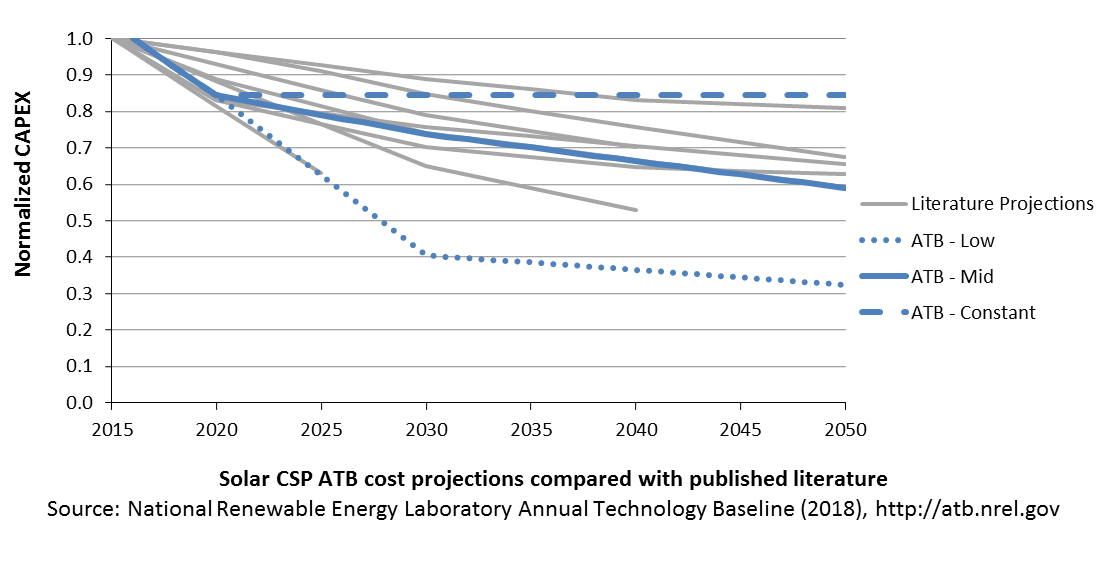
Concentrating Solar Power
A range of literature projections is shown for comparison. When comparing the ATB projections with other projections, note that there are major differences in technology assumptions, radiation conditions, field sizes, storage configurations, and other factors. The Low ATB projection is based on the SunShot Vision Study (DOE (2012); Mehos et al. (2016)). Although this Low projection falls below other projections, it has been vetted with solar industry representatives to position it in the aggressive but plausible range.
To jump to the 2018 ATB Concentrating Solar Power section, click here.
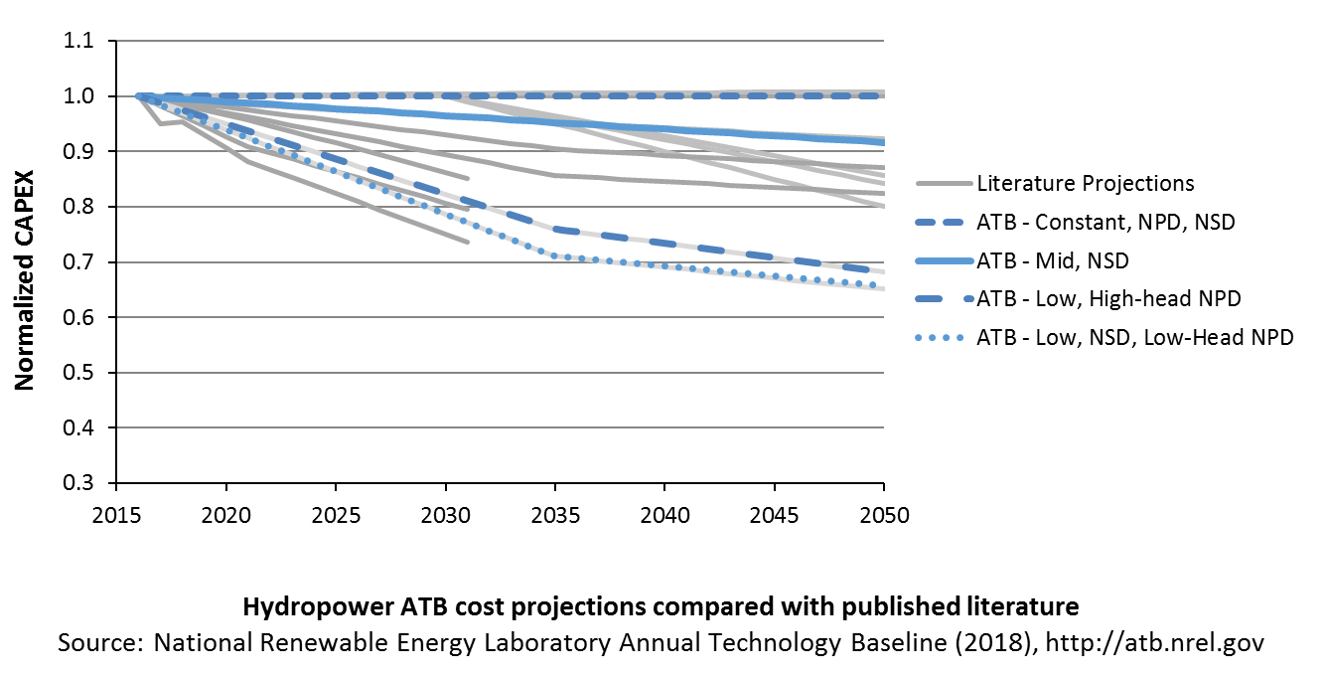
Hydropower
A range of literature projections is shown for comparison. The Mid and Low cost cases use a mix of inputs based on EIA technological learning assumptions, input from a technical team of Oak Ridge National Laboratory researchers, and the experience of expert hydropower consultants.
To jump to the 2018 ATB Hydropower section, click here.
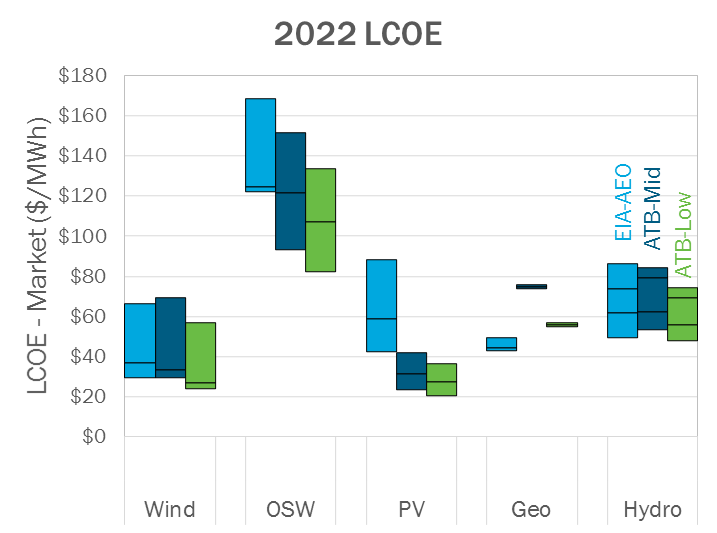
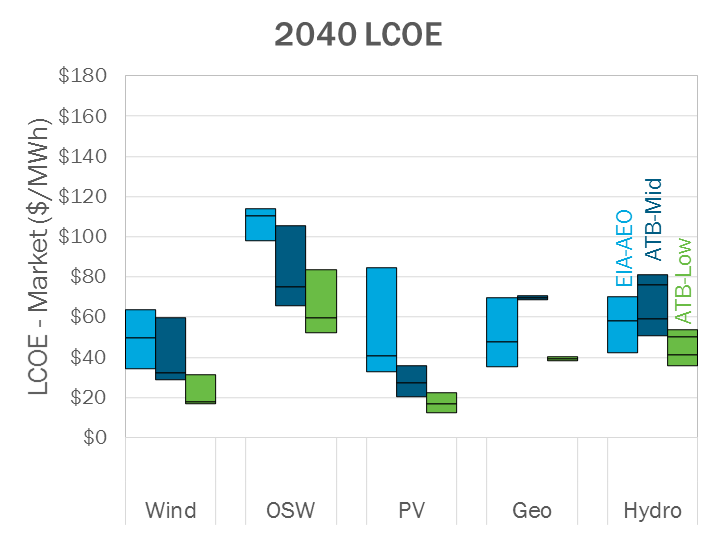
ATB Comparison to the Annual Energy Outlook
The following charts show comparisons of the ATB LCOE in the Market case with the AEO reference case LCOE by technology. For further discussion of LCOE comparisons in different scenarios, please see Project Finance Impact on LCOE.
References
2H 2017 Offshore Wind Market Outlook. Presentation by Tom Harries, accessed through BNEF subscription services.
Energy Technology Perspectives 2015.
H2 2017 US PV Market Outlook. December 13, 2017. New York: BNEF.
Innovation Outlook: Off shore Wind. Abu Dhabi: International Renewable Energy Agency.
Lazard's Levelized Cost of Energy Analysis: Version 11.0. November 2017. New York: Lazard. https://www.lazard.com/perspective/levelized-cost-of-energy-2017.
Levelized Cost and Levelized Avoided Cost of New Generation Resources in the Annual Energy Outlook 2017.
PV Market Outlook, Q4 2017. November 17, 2017. New York: BNEF.
The Power to Change: Solar and Wind Cost Reduction Potential to 2025. June 2016. Paris: International Renewable Energy Agency. http://www.irena.org/DocumentDownloads/Publications/IRENA_Power_to_Change_2016.pdf.
U.S. Offshore Wind. Presentation by Tom Harries, accessed through BNEF subscription services.
ABB. 2017. Spring 2017 Power Reference Case: Preview of key changes & potential impacts. ABB Enterprise Software. April 5, 2017.
BNEF (Bloomberg New Energy Finance). 2015. Future Cost of Wind.
Carlsson, J., M. del Mar Perez Fortes, G. de Marco, J. Giuntoli, M. Jakubcionis, A. Jäger-Waldau, R. Lacal-Arantegui, S. Lazarou, D. Magagna, C. Moles, B. Sigfusson, A. Spisto, M. Vallei, and E. Weidner. 2014. ETRI 2014: Energy Technology Reference Indicator, Projections for 2010-2050. European Commission: JRC Science and Policy Reports. http://publications.jrc.ec.europa.eu/repository/bitstream/JRC92496/ldna26950enn.pdf.
Catapult. 2016. Cost Reduction Monitoring Framework. Quantitative Assessment Report. 19 December 2016.
DOE (U.S. Department of Energy). 2012. SunShot Vision Study. DOE/GO-102012-3037. February 2012. https://www1.eere.energy.gov/solar/pdfs/47927.pdf.
E3 (Energy and Environmental Economics). 2014. Capital Cost Review of Power Generation Technologies: Recommendations for WECC's 10- and 20-Year Studies. Prepared for the Western Electric Coordinating Council. https://www.wecc.biz/Reliability/2014_TEPPC_Generation_CapCost_Report_E3.pdf.
EIA (U.S. Energy Information Administration). 2014. Annual Energy Outlook 2014 with Projections to 2040. Washington, D.C.: U.S. Department of Energy. DOE/EIA-0383(2014). April 2014. http://www.eia.gov/forecasts/aeo/pdf/0383(2014).pdf.
EPA (United States Environmental Protection Agency). Clean Power Plan.
Fraunhofer ISE. 2015. Current and Future Cost of Photovoltaics: Long-term Scenarios for Market Development, System Prices and LCOE of Utility-Scale PV Systems. Prepared for Agora Energiewende. Freiburg, Germany: Fraunhofer-Institute for Solar Energy Systems (ISE). 059/01-S-2015/EN. February 2015. https://www.agora-energiewende.de/fileadmin/Projekte/2014/Kosten-Photovoltaik-2050/AgoraEnergiewende_Current_and_Future_Cost_of_PV_Feb2015_web.pdf.
Global Wind Energy Council (GWEC). 2014. Global Wind Energy Outlook 2014. October 2014.
GTM Research. 2016. U.S. PV System Pricing H1 2017: System Pricing, Breakdowns and Forecasts. Boston, MA: GTM Research. June 2017.
IEA (International Energy Agency). 2016. World Energy Outlook 2016. Paris: International Energy Agency. December 2016.
IHS. 2017. PV Demand Market Tracker. Q4 2017. IHS. December 8, 2017. https://technology.ihs.com/572649/pv-demand-market-tracker-q4-2017.
Labastida, Roberto, and Dexter Gauntlett. 2016. Next-Generation Solar PV High Efficiency Solar PV Modules and Module-Level Power Electronics: Global Market Analysis and Forecasts. Chicago: Navigant Consulting. 3Q 2016.
MAKE Consulting (MAKE). 2015. Global Wind Power Supply Chain. Market Report. December 2015.
Mehos, Mark, Craig Turchi, Jennie Jorgenson, Paul Denholm, Clifford Ho, and Kenneth Armijo. 2016. On the Path to SunShot: Advancing Concentrating Solar Power Technology, Performance, and Dispatchability. Golden, CO: National Renewable Energy Laboratory. NREL/TP-5500-65688. May 2016. http://www.nrel.gov/docs/fy16osti/65688.pdf.
Musial, W., P. Beiter, P. Schwabe, T. Tian, T. Stehly, P. Spitsen. 2017. 2016 Offshore Wind Technologies Market Report. U.S. Department of Energy Office of Energy Efficiency and Renewable Energy. DOE/GO-102017-5031. August 2017. https://www.energy.gov/sites/prod/files/2018/08/f35/2016%20Offshore%20Wind%20Technologies%20Market%20Report.pdf
Ove Arup & Partners Ltd. (ARUP). 2011. Review of the Generation Costs and Deployment Potential of Renewable Electricity Technologies in the UK. Department of Energy and Climate REP001, Prepared by Ove Arup & Partners Ltd. London, UK.
Teske, Sven, Steve Sawyer, and Oliver Schäfer, Thomas Pregger, Sonja Simon, and Tobias Naegler. 2015. Energy [r]evolution: A Sustainable World Energy Outlook 2015. Global Wind Energy Council, Solar Power Europe & Greenpeace. September 2015.
Wiser, Ryan, Karen Jenni, Joachim Seel, Erin Baker, Maureen Hand, Eric Lantz, and Aaron Smith. 2016. Forecasting Wind Energy Costs and Cost Drivers: The Views of the World's Leading Experts. Berkeley, CA: Lawrence Berkeley National Laboratory. LBNL-1005717. June 2016. https://emp.lbl.gov/publications/forecasting-wind-energy-costs-and.