Annual Technology Baseline 2018
National Renewable Energy Laboratory
Recommended Citation:
NREL (National Renewable Energy Laboratory). 2018. 2018 Annual Technology Baseline. Golden, CO: National Renewable Energy Laboratory. http://atb.nrel.gov/.
Please consult Guidelines for Using ATB Data:
https://atb.nrel.gov/electricity/user-guidance.html
2018 ATB
For each electricity generation technology in the ATB, this website provides:
- Capital expenditures (CAPEX): the definition of CAPEX used in the ATB and the historical trends, current estimates, and future projections of CAPEX used in the ATB
- Operations and maintenance (O&M) costs: the definition of O&M and the current estimates and future projections of O&M used in the ATB
- Capacity factor (CF): the definition of CF and the historical trends, current estimates, and future projections of CF used in the ATB
- Future cost and performance methods: an outline of the methodology used to make the projections of future cost and performance in the ATB for Constant, Mid, and Low technology cost cases
- Levelized cost of energy (LCOE): metric that combines CAPEX, O&M, CF, and projections for Constant, Mid, and Low technology cost cases for illustration of the combined effect of the primary cost and performance components and discussion of technology advances that yield future projections
- Financing Assumptions: Where applicable, development of technology-specific interest rate on debt, return on equity, and debt-to-equity ratios, and their impact on LCOE are documented in each technology section, and summarized here.
Electricity generation technologies are selected on the left side of the screen, and the topics highlighted above can be selected using the drop-down menu at the top-right of the screen.
Guidelines for using and interpreting ATB content and comparisons to other literature are provided. LCOE accounts for many variables important to determining the competitiveness of a building and operating a specific technology (e.g., upfront capital costs, capacity factor, and cost of financing); however, it does not necessarily demonstrate which technology in a given place and time would provide the lowest cost option for the electricity grid. This analysis is performed using electric sector models such as the Regional Energy Deployment Systems (ReEDS) model and corresponding analysis results such as the NREL Standard Scenarios.
The NREL Standard Scenarios, a companion product to the ATB, provides a suite of electric sector scenarios and associated assumptions-including technology cost and performance assumptions from the ATB.
ATB data sources and references are also provided for each technology. All dollar values are presented in 2016 U.S. dollars, unless noted otherwise.
Additional information about the 2018 ATB - available via links in the ATB website footer below - includes:
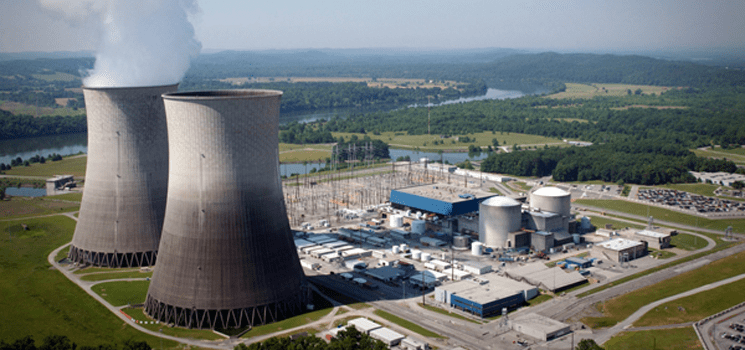
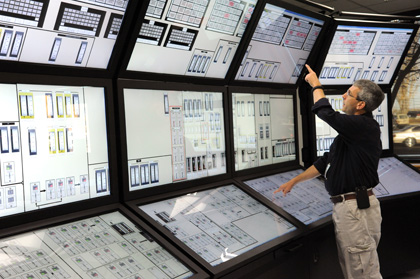
Nuclear
Nuclear power contributed about 20% of U.S. electricity generation over the past two decades (DOE "Light Water Reactor Sustainability Program").
Nuclear power plants generate electricity in the same way as any other steam-electric power plant. Water is heated, and steam from the boiling water turns turbines and generates electricity. The main difference is that heat from a self-sustaining chain reaction boils the water in a nuclear power plant, as opposed to burning fuels in fossil fuel plants (DOE Office of Nuclear Energy "History").
DOE ("Nuclear Reactor Technologies")
Renewable energy technical potential, as defined by Lopez et al. 2012, represents the achievable energy generation of a particular technology given system performance, topographic limitations, and environmental and land-use constraints. Technical resource potential corresponds most closely to fossil reserves, as both can be characterized by the prospect of commercial feasibility and depend strongly on available technology at the time of the resource assessment. Uranium reserves in the United States are assessed by the United States Geological Survey (USGS, "Uranium Resources and Environmental Investigations").
CAPital EXpenditures (CAPEX): Historical Trends, Current Estimates, and Future Projections
Because nuclear plants are well-known and perform close to their optimal performance, EIA expects capital expenditures (CAPEX) will incrementally improve over time and slightly more quickly than inflation.
Comparison with Other Sources
CAPEX Definition
Capital expenditures (CAPEX) are expenditures required to achieve commercial operation in a givenyear.
Overnight capital costs are modified from EIA (2017). Capital costs include overnight capital cost plus defined transmission cost, and it removes a material price index.
| Overnight Capital Cost ($/kW) | Construction Financing Factor (ConFinFactor) | CAPEX ($/kW) | |
|---|---|---|---|
| Nuclear: Advanced nuclear power generation | $5,515 | 1.084 | $5,979 |
CAPEX can be determined for a plant in a specific geographic location as follows:
Regional cost variations and geographically specific grid connection costs are not included in the ATB (CapRegMult = 1; GCC = 0). In the ATB, the input value is overnight capital cost (OCC) and details to calculate interest during construction (ConFinFactor).
In the ATB, CAPEX represents each type of nuclear plant with a unique value. Regional cost effects associated with labor rates, material costs, and other regional effects as defined by EIA 2016a expand the range of CAPEX (Plant × Region). Unique land-based spur line costs based on distance and transmission line costs are not estimated. The following figure illustrates the ATB representative plant relative to the range of CAPEX including regional costs across the contiguous United States. The ATB representative plants are associated with a regional multiplier of 1.0.
Natural Gas Internal Combustion Engine Vehicle
Operations and maintenance (O&M) costs represent the annual expenditures required to operate and maintain a plant over its lifetime, including:
- Insurance, taxes, land lease payments, and other fixed costs
- Present value and annualized large component replacement costs over technical life
- Scheduled and unscheduled maintenance of power plants, transformers, and other components over the technical lifetime of the plant.
Market data for comparison are limited and generally inconsistent in the range of costs covered and the length of the historical record.
Capacity Factor: Expected Annual Average Energy Production Over Lifetime
The capacity factor represents the assumed annual energy production divided by the total possible annual energy production, assuming the plant operates at rated capacity for every hour of the year. For nuclear plants, the capacity factor is typically the same as (or very close to) their availability factor.
The capacity factor of nuclear units is generally very high (> 85%) as they are typically always online except when undergoing maintenance or refueling (NEI "US Nuclear Capacity Factors").
In the United States, nuclear power plants are baseload plants with steady capacity factors. They need to change out their uranium fuel rods about every 24 months. After 18-36 months, the used fuel is removed from the reactor (World Nuclear Association "The Nuclear Fuel Cycle"). The average fueling outage duration in 2013 was 41 days; from 1990 to 1997, the refueling days ranged from 66 to 106, so improvements have helped capacity factors (NEI, "US Nuclear Refueling Outage Days"). See also NEI ("US Nuclear Power Plants: General U.S. Nuclear Info").
Levelized Cost of Energy (LCOE) Projections
Levelized cost of energy (LCOE) is a simple metric that combines the primary technology cost and performance parameters: CAPEX, O&M, and capacity factor. It is included in the ATB for illustrative purposes. The ATB focuses on defining the primary cost and performance parameters for use in electric sector modeling or other analysis where more sophisticated comparisons among technologies are made. The LCOE accounts for the energy component of electric system planning and operation. The LCOE uses an annual average capacity factor when spreading costs over the anticipated energy generation. This annual capacity factor ignores specific operating behavior such as ramping, start-up, and shutdown that could be relevant for more detailed evaluations of generator cost and value. Electricity generation technologies have different capabilities to provide such services. For example, wind and PV are primarily energy service providers, while the other electricity generation technologies provide capacity and flexibility services in addition to energy. These capacity and flexibility services are difficult to value and depend strongly on the system in which a new generation plant is introduced. These services are represented in electric sector models such as the ReEDS model and corresponding analysis results such as the Standard Scenarios.
The following three figures illustrate LCOE, which includes the combined impact of CAPEX, O&M, and capacity factor projections for nuclear across the range of resources present in the contiguous United States. For the purposes of the ATB, the costs associated with technology and project risk in the U.S. market are represented in the financing costs, not in the upfront capital costs (e.g. developer fees, contingencies). An individual technology may receive more favorable financing terms outside of the U.S., due to less technology and project risk, caused by more project development experience (e.g. offshore wind in Europe), or more government or market guarantees. The R&D Only LCOE sensitivity cases present the range of LCOE based on financial conditions that are held constant over time unless R&D affects them, and they reflect different levels of technology risk. This case excludes effects of tax reform, tax credits, technology-specific tariffs, and changing interest rates over time. The R&D + Market LCOE case adds to these the financial assumptions (1) the changes over time consistent with projections in the Annual Energy Outlook and (2) the effects of tax reform, tax credits, and tariffs.
R&D Only | R&D + Market
The LCOE of nuclear power plants is directly impacted by the cost of uranium, variations in the heat rate, and O&M costs, but the biggest factor is the capital cost (including financing costs) of the plant. The LCOE can also be impacted by the amount of downtime from refueling or maintenance. For a given year, the LCOE assumes that the fuel prices from that year continue throughout the lifetime of the plant.
Fuel prices are based on the AEO 2017 (EIA 2017).
To estimate LCOE, assumptions about the cost of capital to finance electricity generation projects are required, and the LCOE calculations are sensitive to these financial assumptions. Three project finance structures are used within the ATB:
- R&D Only Financial Assumptions: This sensitivity case allows technology-specific changes to debt interest rates, return on equity rates, and debt fraction to reflect effects of R&D on technological risk perception, but it holds background rates constant at 2016 values from AEO 2018 and excludes effects of tax reform, tax credits, and tariffs. A constant cost recovery period-or period over which the initial capital investment is recovered-of 30 years is assumed for all technologies.
- R&D Only + Market Financial Assumptions: This sensitivity case retains the technology-specific changes to debt interest, return on equity rates, and debt fraction from the R&D Only case and adds in the variation over time consistent with AEO 2018, as well as effects of tax reform, tax credits, and tariffs. As in the R&D Only case, a constant cost recovery period-or period over which the initial capital investment is recovered-of 30 years is assumed for all technologies. For a detailed discussion of these assumptions, see Changes from 2017 ATB to 2018 ATB.
- ReEDS Financial Assumptions: ReEDS uses the R&D Only + Market Financial Assumptions for the "Mid" technology cost scenario.
These parameters are allowed to vary by year. The equations and variables used to estimate LCOE are defined on the equations and variables page. For illustration of the impact of changing financial structures such as WACC, see Project Finance Impact on LCOE. For LCOE estimates for the Constant, Mid, and Low technology cost scenarios for all technologies, see 2018 ATB Cost and Performance Summary.
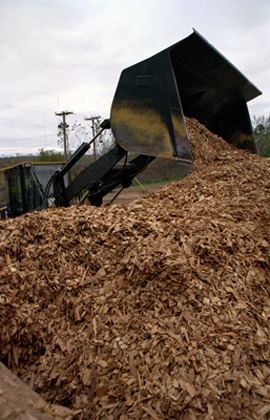
Biopower
In a biopower plant:
- Heat is created: Biomass (sometimes co-fired with coal) is pulverized, mixed with hot air, and burned in suspension.
- Water turns to steam: The heat turns purified water into steam, which is piped to the turbine.
- Steam turns the turbine: The pressure of the steam pushes the turbine blade, turns the shaft in the generator, and creates power.
- Steam is turned back into water: Cool water is drawn into a condenser where the steam turns back into water that can be reused in the plant.
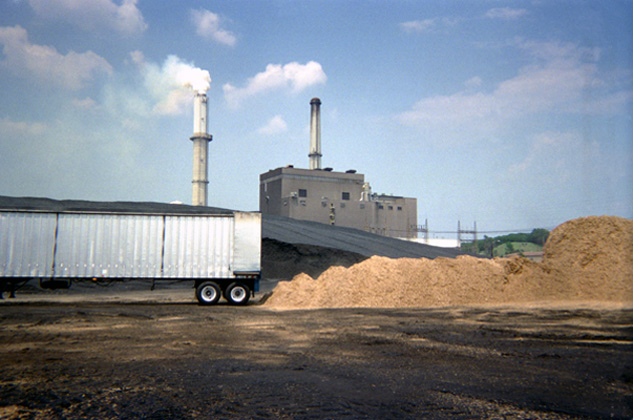
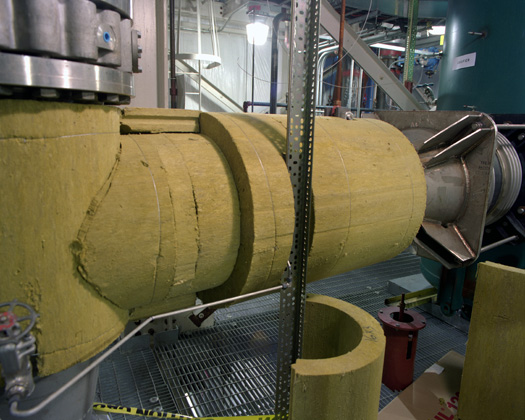
(a biomass gasifier that operates on wood chips)
Renewable energy technical potential, as defined by Lopez et al. 2012, represents the achievable energy generation of a particular technology given system performance, topographic limitations, and environmental and land-use constraints.Technical resource potential for biopower is based on estimated biomass quantities from the Billion Ton Update study (DOE (2011)).
CAPital EXpenditures (CAPEX): Historical Trends, Current Estimates, and Future Projections
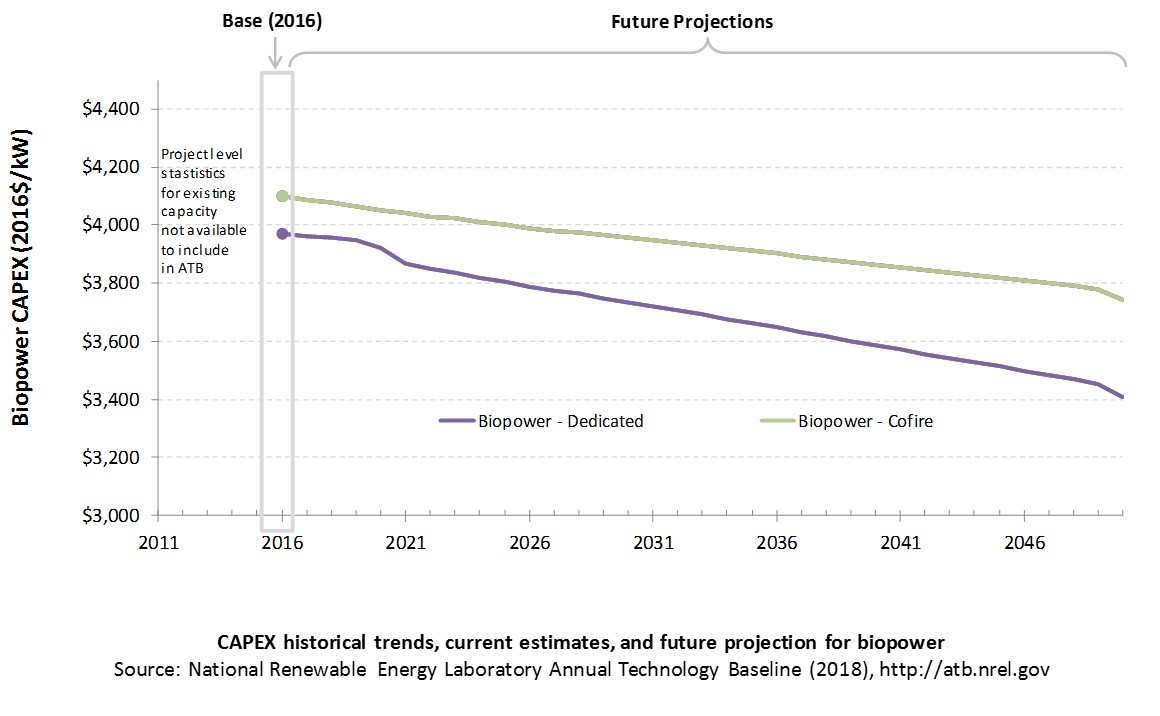
Because biopower plants are well-known and perform close to their optimal performance, EIA expects capital expenditures (CAPEX) will incrementally improve over time and slightly more quickly than inflation.
The exception is new biomass cofiring, which is expected to have costs that decline a bit more than existing cofiring project technologies.
CAPEX Definition
Capital expenditures (CAPEX) are expenditures required to achieve commercial operation in a givenyear.
Overnight capital costs are modified from EIA (2014). Capital costs include overnight capital cost plus defined transmission cost, and it removes a material price index. The overnight capital costs for cofired units are not the cost of upgrading a plant but the total cost of the plant after the upgrade.
Fuel costs are taken from the Billion Ton Update study (DOE (2011)).
| Overnight Capital Cost ($/kW) | Construction Financing Factor (ConFinFactor) | CAPEX ($/kW) | |
|---|---|---|---|
| Dedicated:Dedicated biopower plant | $3,737 | 1.041 | $3,889 |
| CofireOld:Pulverized coal with sulfur dioxide (SO2) scrubbers and biomass co-firing | $3,856 | 1.041 | $4,013 |
| CofireNew:Advanced supercritical coal with SO2 and NOx controls and biomass co-firing | $3,856 | 1.041 | $4,013 |
CAPEX can be determined for a plant in a specific geographic location as follows:
Regional cost variations and geographically specific grid connection costs are not included in the ATB (CapRegMult = 1; GCC = 0). In the ATB, the input value is overnight capital cost (OCC) and details to calculate interest during construction (ConFinFactor).
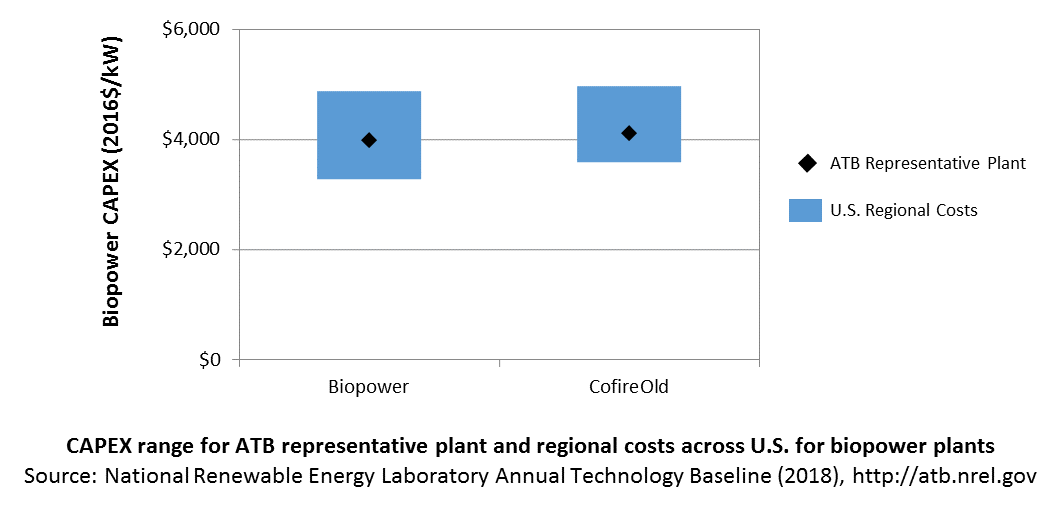
In the ATB, CAPEX represents each type of biopower plant with a unique value. Regional cost effects associated with labor rates, material costs, and other regional effects as defined by EIA 2016a expand the range of CAPEX. Unique land-based spur line costs based on distance and transmission line costs are not estimated. The following figure illustrates the ATB representative plant relative to the range of CAPEX including regional costs across the contiguous United States. The ATB representative plants are associated with a regional multiplier of 1.0.
Natural Gas Internal Combustion Engine Vehicle
Operations and maintenance (O&M) costs represent the annual expenditures required to operate and maintain a plant over its lifetime, including:
- Insurance, taxes, land lease payments, and other fixed costs
- Present value and annualized large component replacement costs over technical life
- Scheduled and unscheduled maintenance of power plants, transformers, and other components over the technical lifetime of the plant.
Market data for comparison are limited and generally inconsistent in the range of costs covered and the length of the historical record.
Capacity Factor: Expected Annual Average Energy Production Over Lifetime
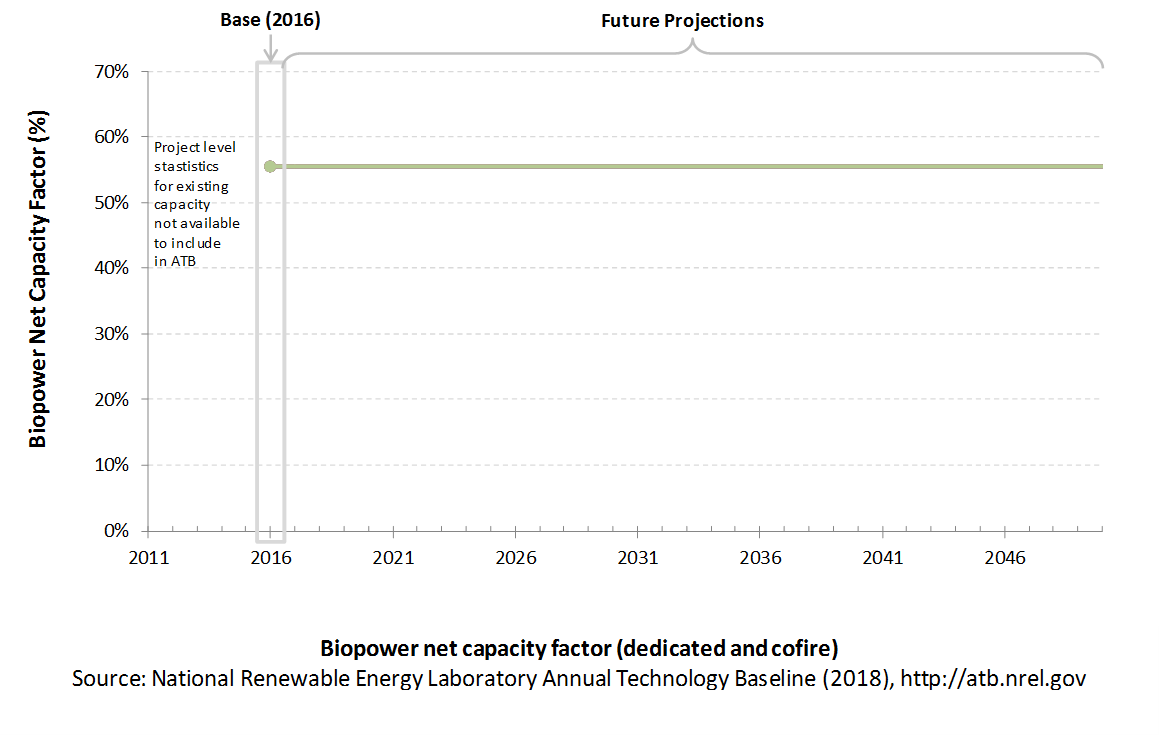
The capacity factor represents the assumed annual energy production divided by the total possible annual energy production, assuming the plant operates at rated capacity for every hour of theyear. For biopower plants, the capacity factors are typically lower than their availability factors. Biopower plant availability factors have a wide range depending on system design, fuel type and availability, and maintenance schedules.
Biopower plants are typically baseload plants with steady capacity factors. For the ATB, the biopower capacity factor is taken as the average capacity factor for biomass plants for 2015, as reported by EIA.
Biopower capacity factors are influenced by technology and feedstock supply, expected downtime, and energy losses.
Levelized Cost of Energy (LCOE) Projections
Levelized cost of energy (LCOE) is a simple metric that combines the primary technology cost and performance parameters: CAPEX, O&M, and capacity factor. It is included in the ATB for illustrative purposes. The ATB focuses on defining the primary cost and performance parameters for use in electric sector modeling or other analysis where more sophisticated comparisons among technologies are made. The LCOE accounts for the energy component of electric system planning and operation. The LCOE uses an annual average capacity factor when spreading costs over the anticipated energy generation. This annual capacity factor ignores specific operating behavior such as ramping, start-up, and shutdown that could be relevant for more detailed evaluations of generator cost and value. Electricity generation technologies have different capabilities to provide such services. For example, wind and PV are primarily energy service providers, while the other electricity generation technologies provide capacity and flexibility services in addition to energy. These capacity and flexibility services are difficult to value and depend strongly on the system in which a new generation plant is introduced. These services are represented in electric sector models such as the ReEDS model and corresponding analysis results such as the Standard Scenarios.
The following three figures illustrate LCOE, which includes the combined impact of CAPEX, O&M, and capacity factor projections for biomass across the range of resources present in the contiguous United States. For the purposes of the ATB, the costs associated with technology and project risk in the U.S. market are represented in the financing costs, not in the upfront capital costs (e.g. developer fees, contingencies). An individual technology may receive more favorable financing terms outside of the U.S., due to less technology and project risk, caused by more project development experience (e.g. offshore wind in Europe), or more government or market guarantees. The R&D Only LCOE sensitivity cases present the range of LCOE based on financial conditions that are held constant over time unless R&D affects them, and they reflect different levels of technology risk. This case excludes effects of tax reform, tax credits, technology-specific tariffs, and changing interest rates over time. The R&D + Market LCOE case adds to these the financial assumptions (1) the changes over time consistent with projections in the Annual Energy Outlook and (2) the effects of tax reform, tax credits, and tariffs. Data for all the resource categories can be found in the ATB data spreadsheet.
R&D Only | R&D + Market
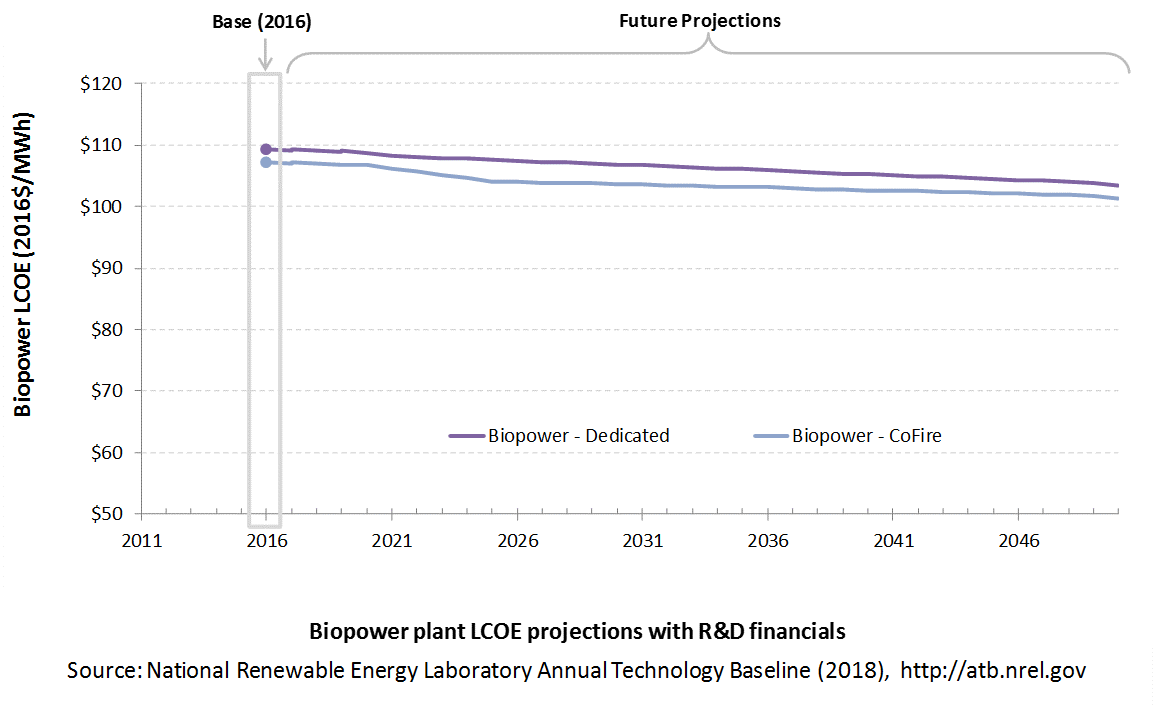
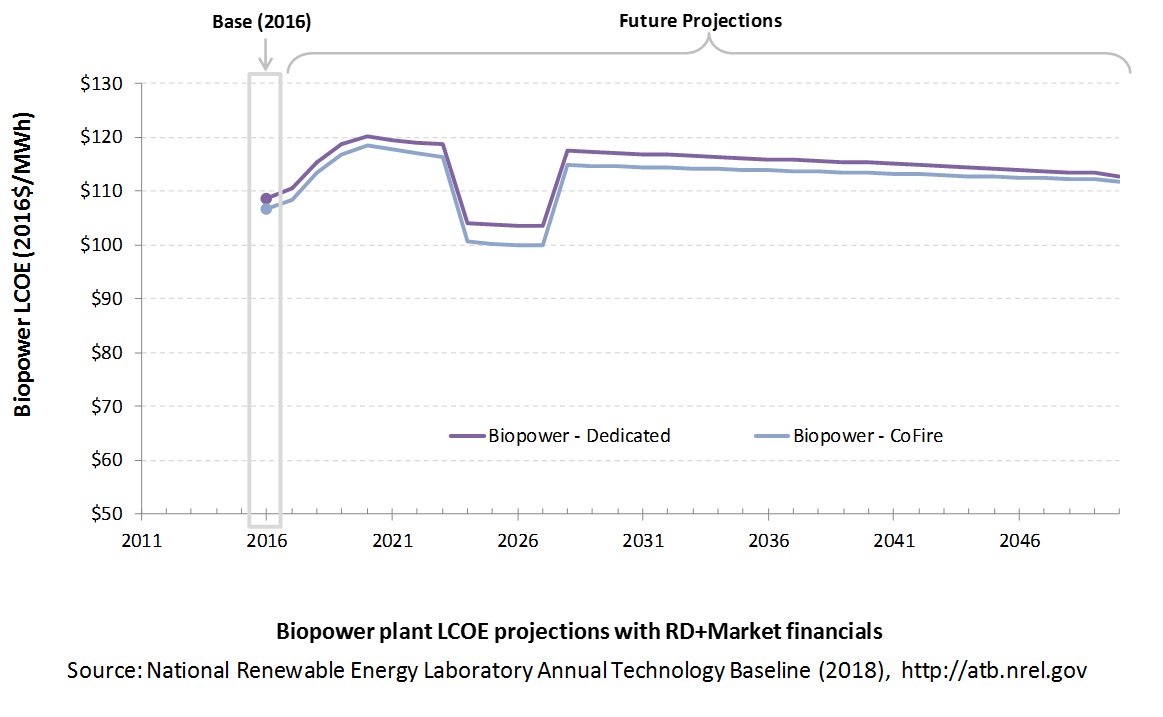
The LCOE of biopower plants is directly impacted by the differences in CAPEX (installed capacity costs) as well as by heat rate differences. For a given year, the LCOE assumes that the fuel prices from that year continue throughout the lifetime of the plant.
Regional variations will ultimately impact biomass feedstock costs, but these are not included in the ATB.
The projections do not include any cost of carbon.
Fuel prices are based on the AEO 2017 (EIA 2017).
To estimate LCOE, assumptions about the cost of capital to finance electricity generation projects are required, and the LCOE calculations are sensitive to these financial assumptions. Three project finance structures are used within the ATB:
- R&D Only Financial Assumptions: This sensitivity case allows technology-specific changes to debt interest rates, return on equity rates, and debt fraction to reflect effects of R&D on technological risk perception, but it holds background rates constant at 2016 values from AEO 2018 and excludes effects of tax reform, tax credits, and tariffs. A constant cost recovery period-or period over which the initial capital investment is recovered-of 30 years is assumed for all technologies.
- R&D Only + Market Financial Assumptions: This sensitivity case retains the technology-specific changes to debt interest, return on equity rates, and debt fraction from the R&D Only case and adds in the variation over time consistent with AEO 2018, as well as effects of tax reform, tax credits, and tariffs. As in the R&D Only case, a constant cost recovery period-or period over which the initial capital investment is recovered-of 30 years is assumed for all technologies. For a detailed discussion of these assumptions, see Changes from 2017 ATB to 2018 ATB.
- ReEDS Financial Assumptions: ReEDS uses the R&D Only + Market Financial Assumptions for the "Mid" technology cost scenario.
These parameters are allowed to vary by year. The equations and variables used to estimate LCOE are defined on the equations and variables page. For illustration of the impact of changing financial structures such as WACC, see Project Finance Impact on LCOE. For LCOE estimates for the Constant, Mid, and Low technology cost scenarios for all technologies, see 2018 ATB Cost and Performance Summary.
References
Annual Energy Outlook 2017 with Projections to 2050. Washington, D.C.: U.S. Department of Energy. January 5, 2017. http://www.eia.gov/outlooks/aeo/pdf/0383(2017).pdf.
B&V (Black & Veatch). 2012. Cost and Performance Data for Power Generation Technologies. Black & Veatch Corporation. February 2012. http://bv.com/docs/reports-studies/nrel-cost-report.pdf.
DOE (U.S. Department of Energy). 2011. U.S. Billion-Ton Update: Biomass Supply for a Bioenergy and Bioproducts Industry. Perlack, R.D., and B.J. Stokes, eds. Oak Ridge, TN: Oak Ridge National Laboratory. ORNL/TM-2011/224. August 2011. https://www.osti.gov/scitech/biblio/1023318.
EIA (U.S. Energy Information Administration). 2014. Annual Energy Outlook 2014 with Projections to 2040. Washington, D.C.: U.S. Department of Energy. DOE/EIA-0383(2014). April 2014. http://www.eia.gov/forecasts/aeo/pdf/0383(2014).pdf.
EIA (U.S. Energy Information Administration). 2016a. Capital Cost Estimates for Utility Scale Electricity Generating Plants. Washington, D.C.: U.S. Department of Energy. November 2016. https://www.eia.gov/analysis/studies/powerplants/capitalcost/pdf/capcost_assumption.pdf.
EIA (U.S. Energy Information Administration). 2018. Annual Energy Outlook 2018 with Projections to 2050. Washington, D.C.: U.S. Department of Energy. February 6, 2018. https://www.eia.gov/outlooks/aeo/pdf/AEO2018.pdf.
Entergy. 2015. Entergy Arkansas, Inc.: 2015 Integrated Resource Plan. July 15, 2015. http://entergy-arkansas.com/content/transition_plan/IRP_Materials_Compiled.pdf.
Lazard. 2016. Levelized Cost of Energy Analysis-Version 10.0. December 2016. New York: Lazard. https://www.lazard.com/media/438038/levelized-cost-of-energy-v100.pdf.
Lopez, Anthony, Billy Roberts, Donna Heimiller, Nate Blair, and Gian Porro. 2012. U.S. Renewable Energy Technical Potentials: A GIS-Based Analysis. National Renewable Energy Laboratory. NREL/TP-6A20-51946. http://www.nrel.gov/docs/fy12osti/51946.pdf.