Deprecated: Creation of dynamic property atbOutline::$techLookup is deprecated in /var/www/html/web/models/atbOutline.class.php on line 170
Regional CAPEX Parameter Variations and Adjustments
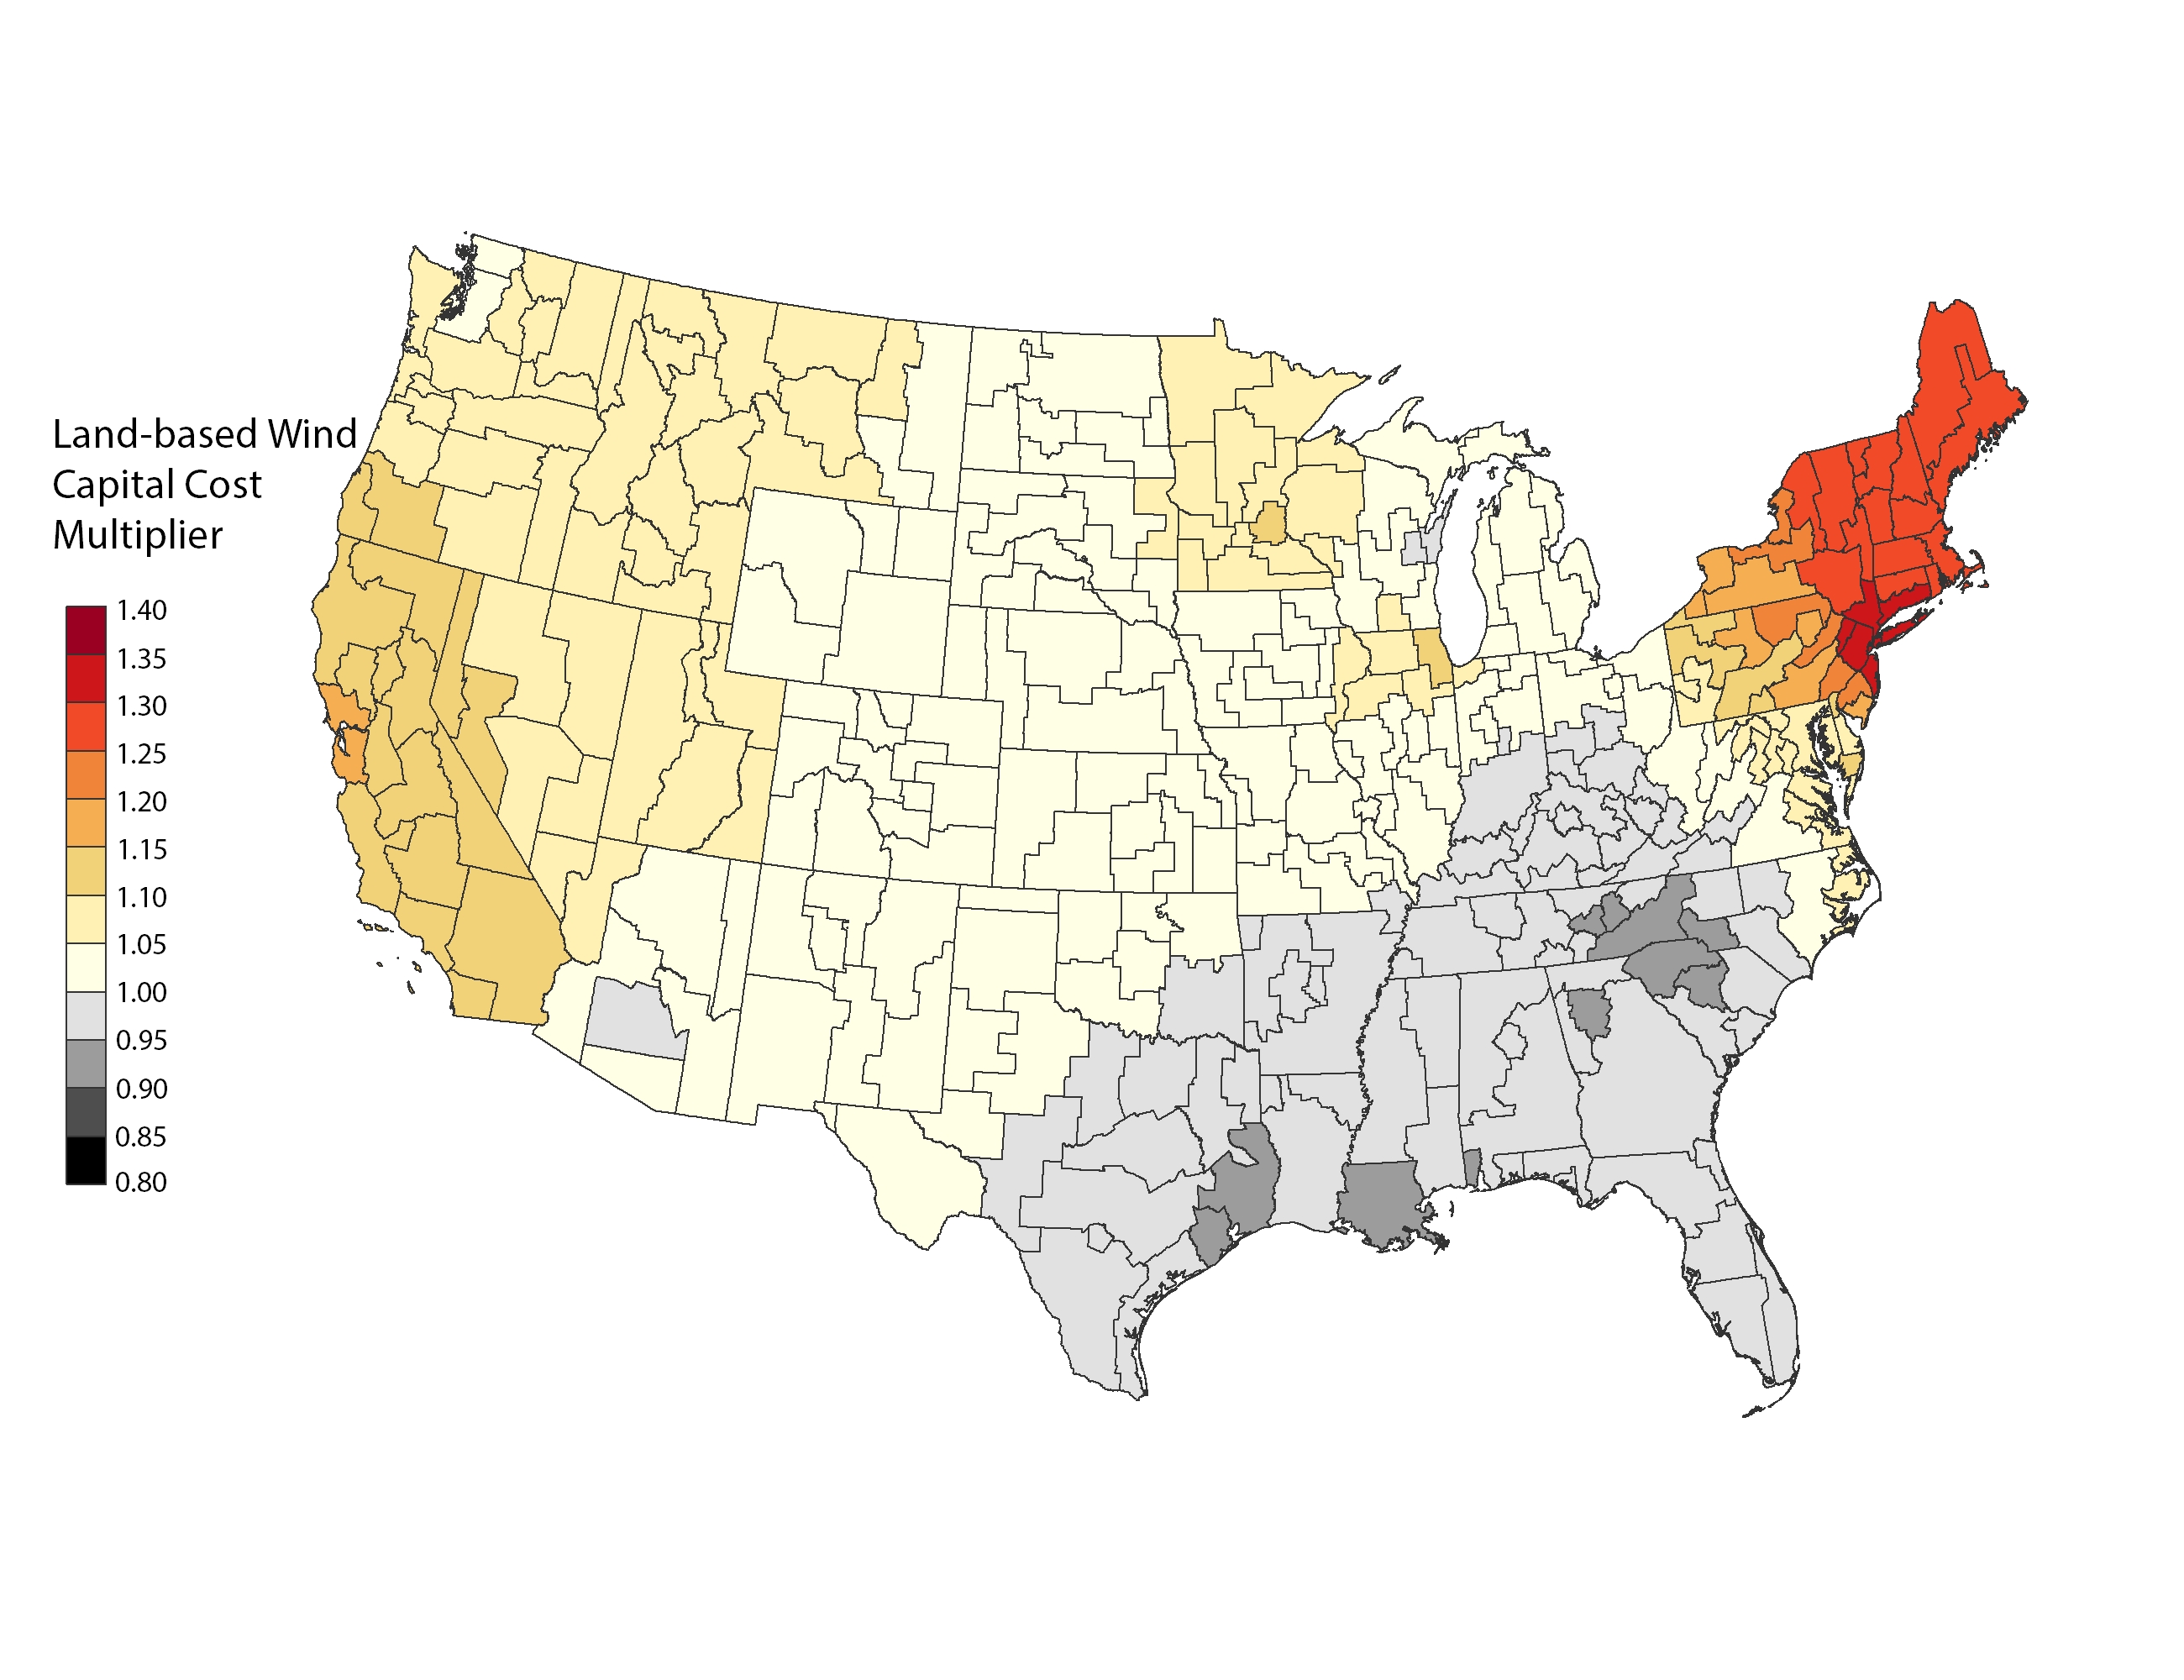
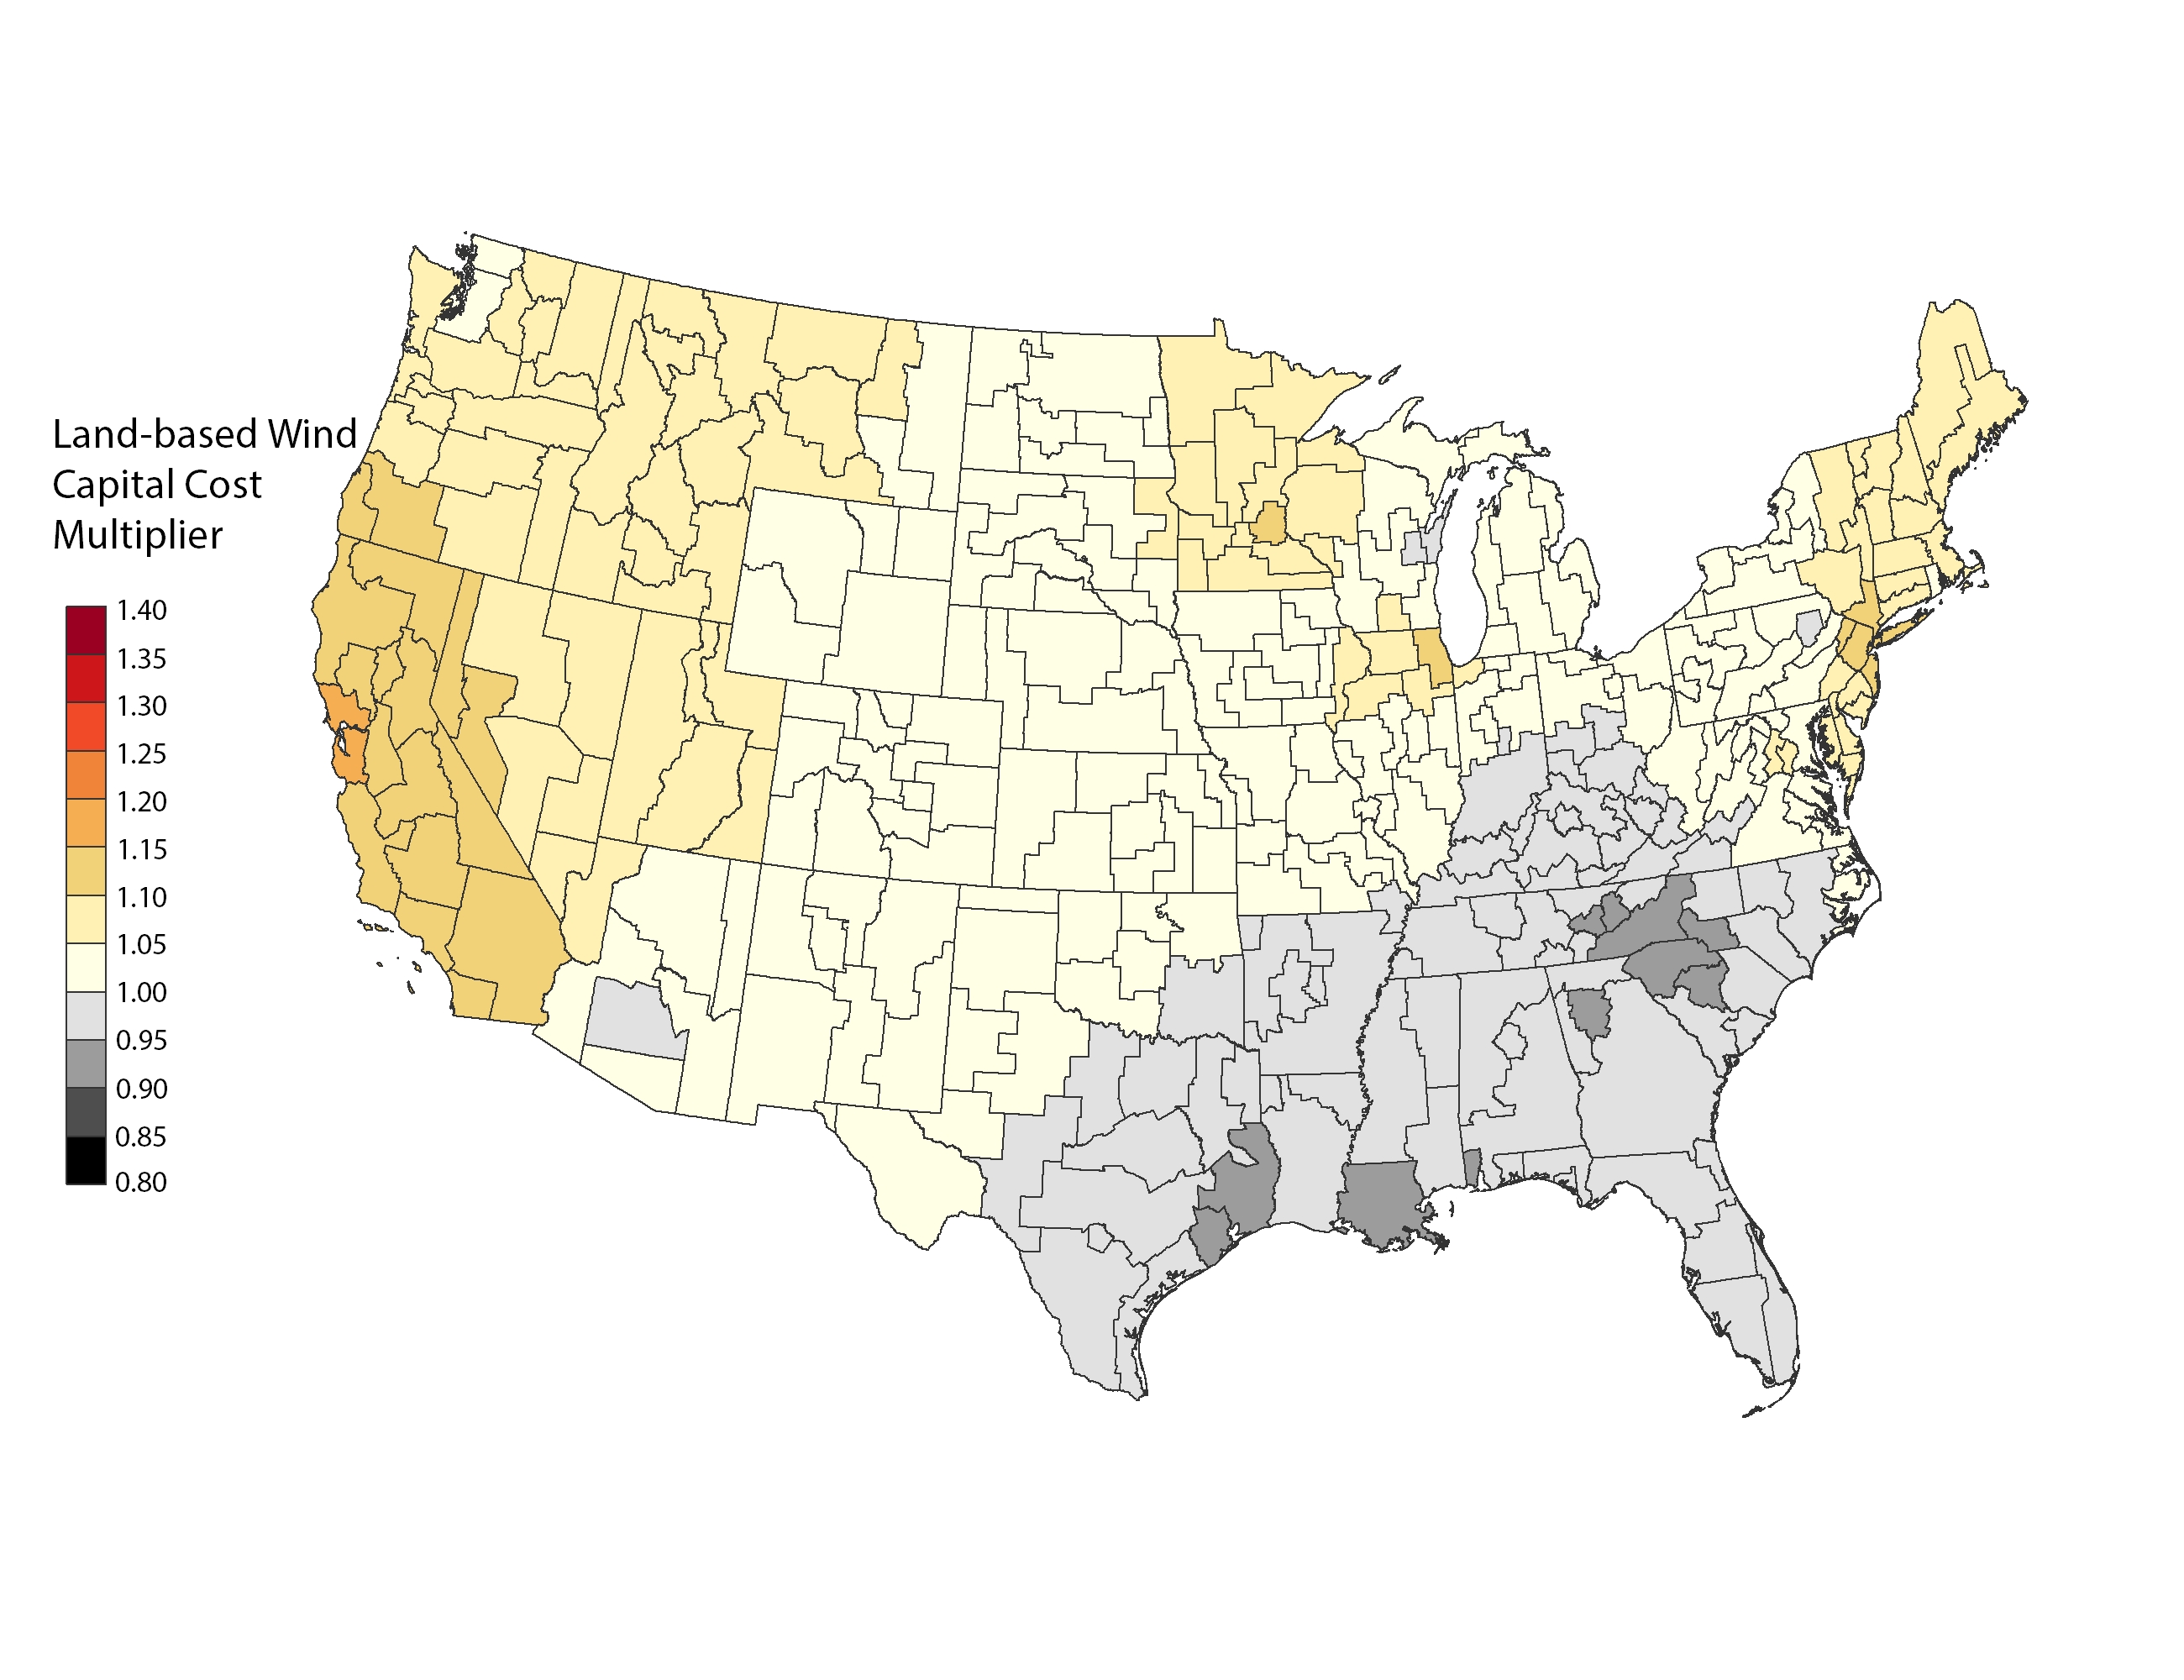
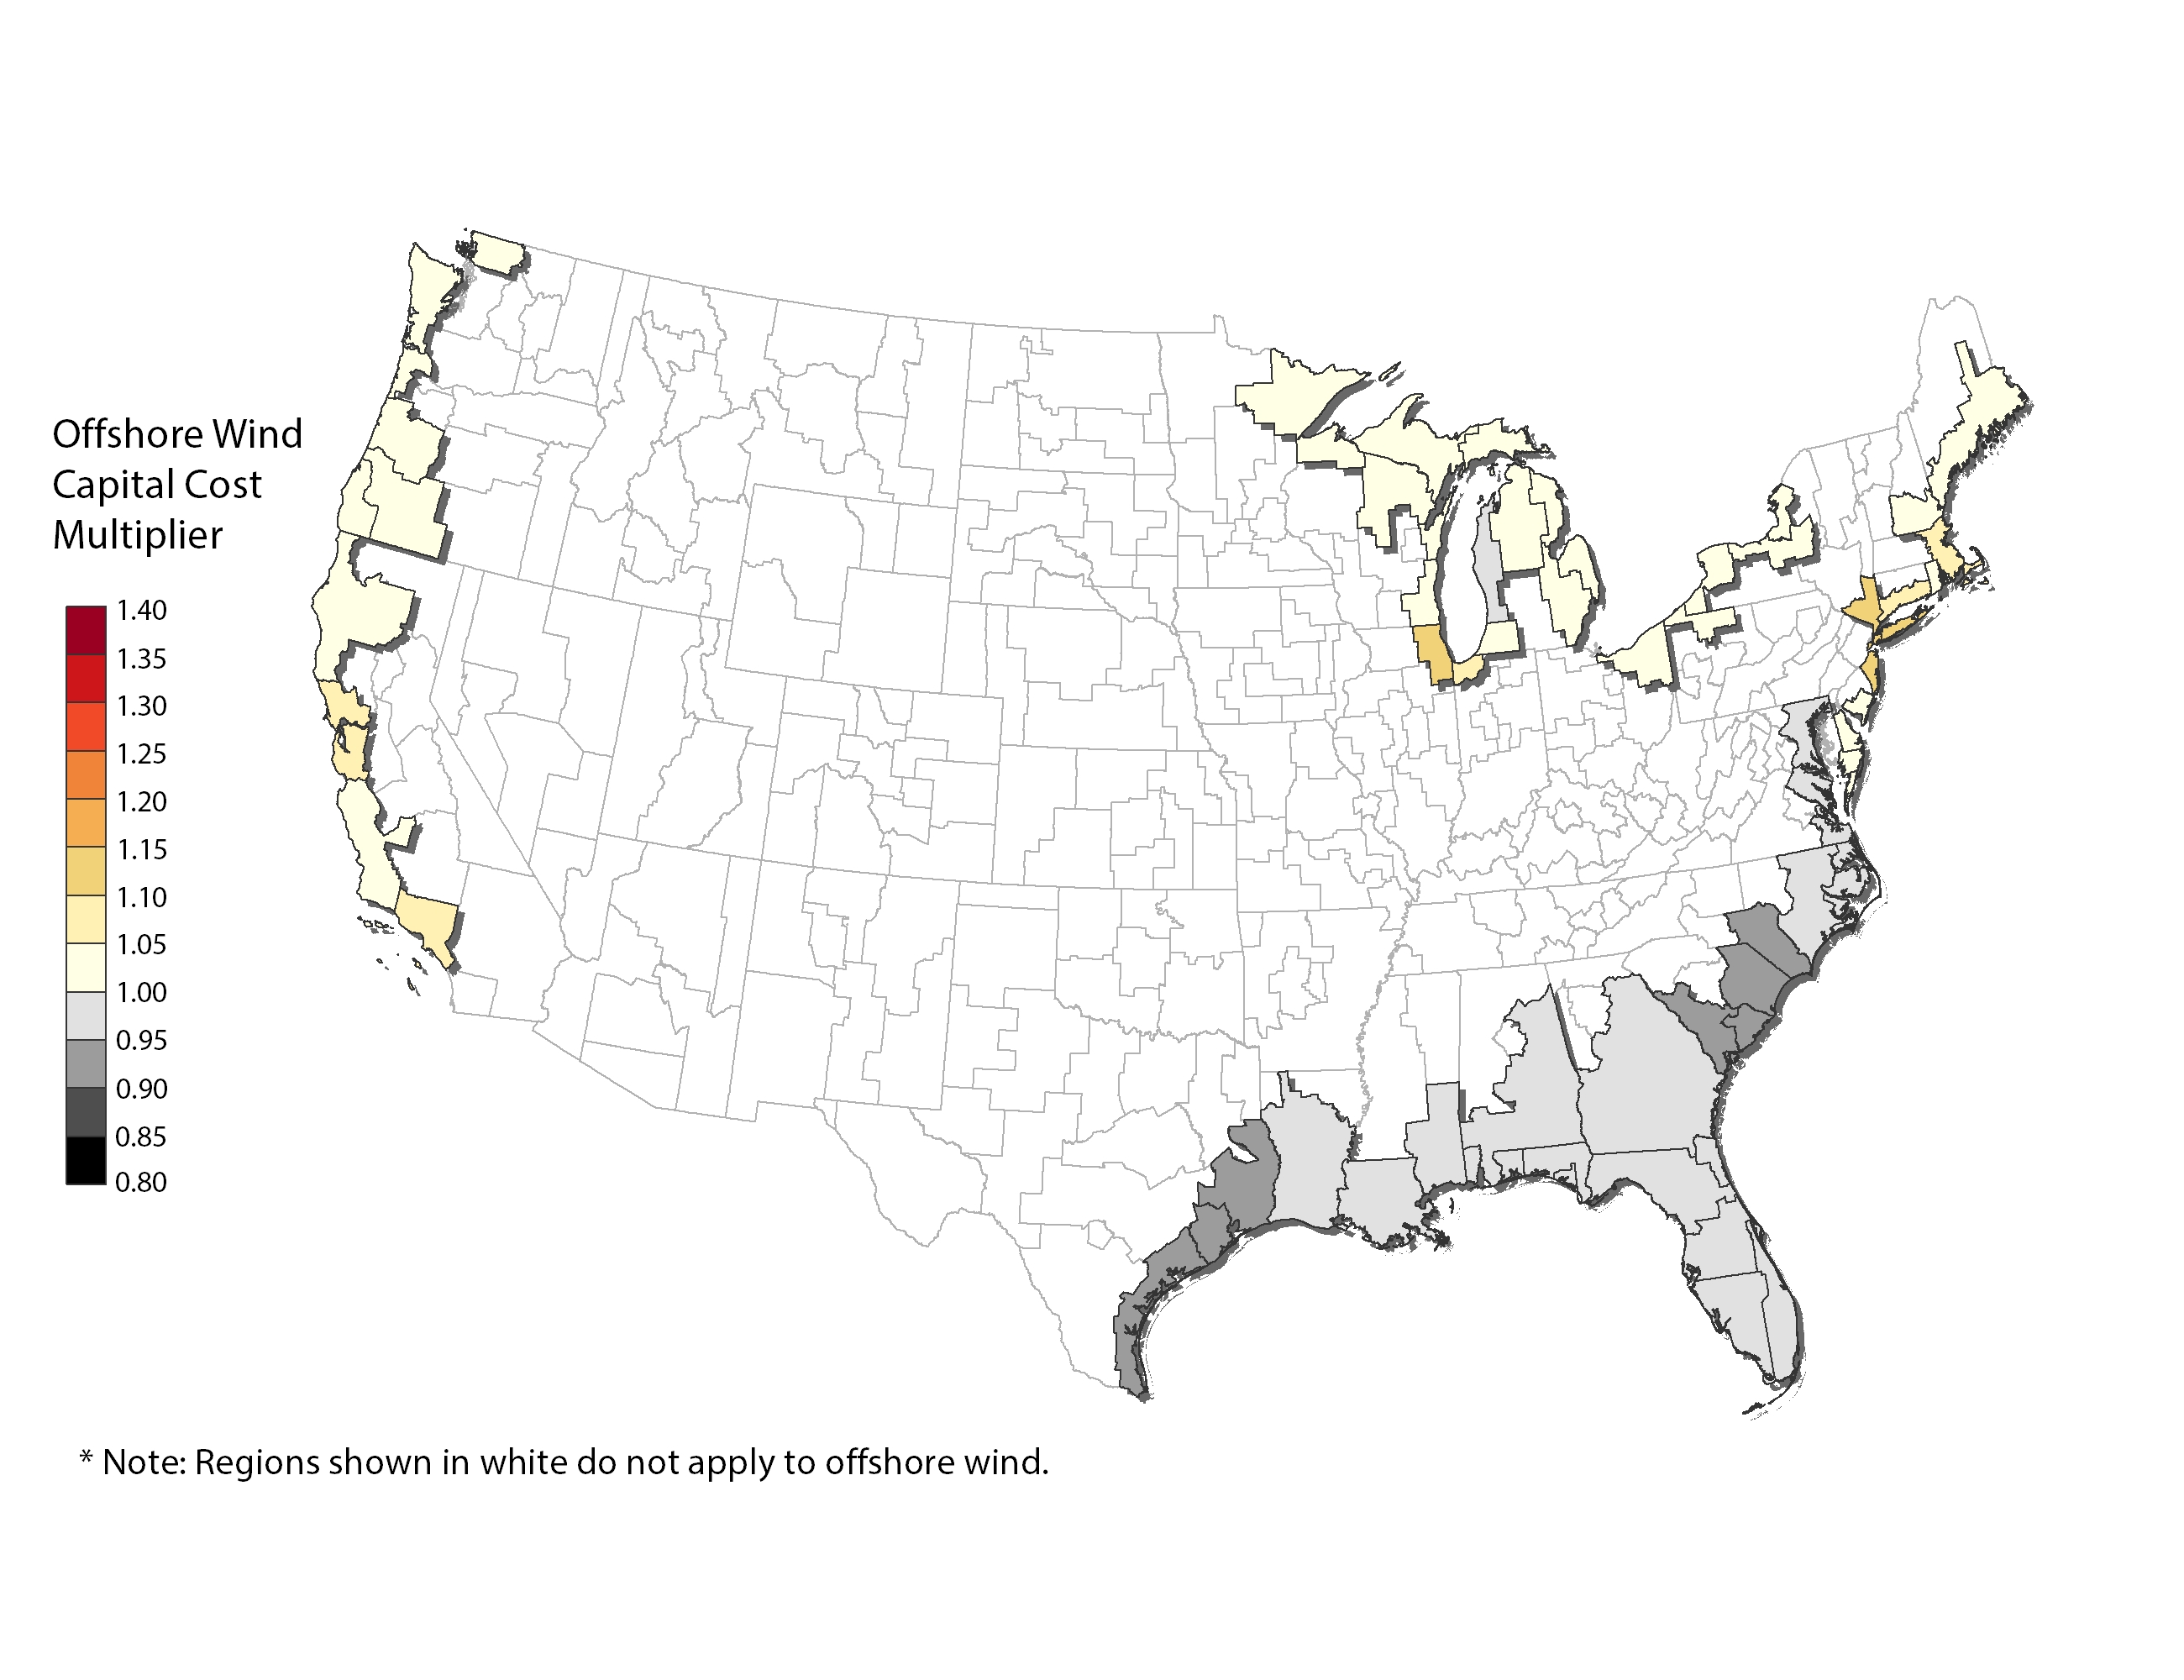
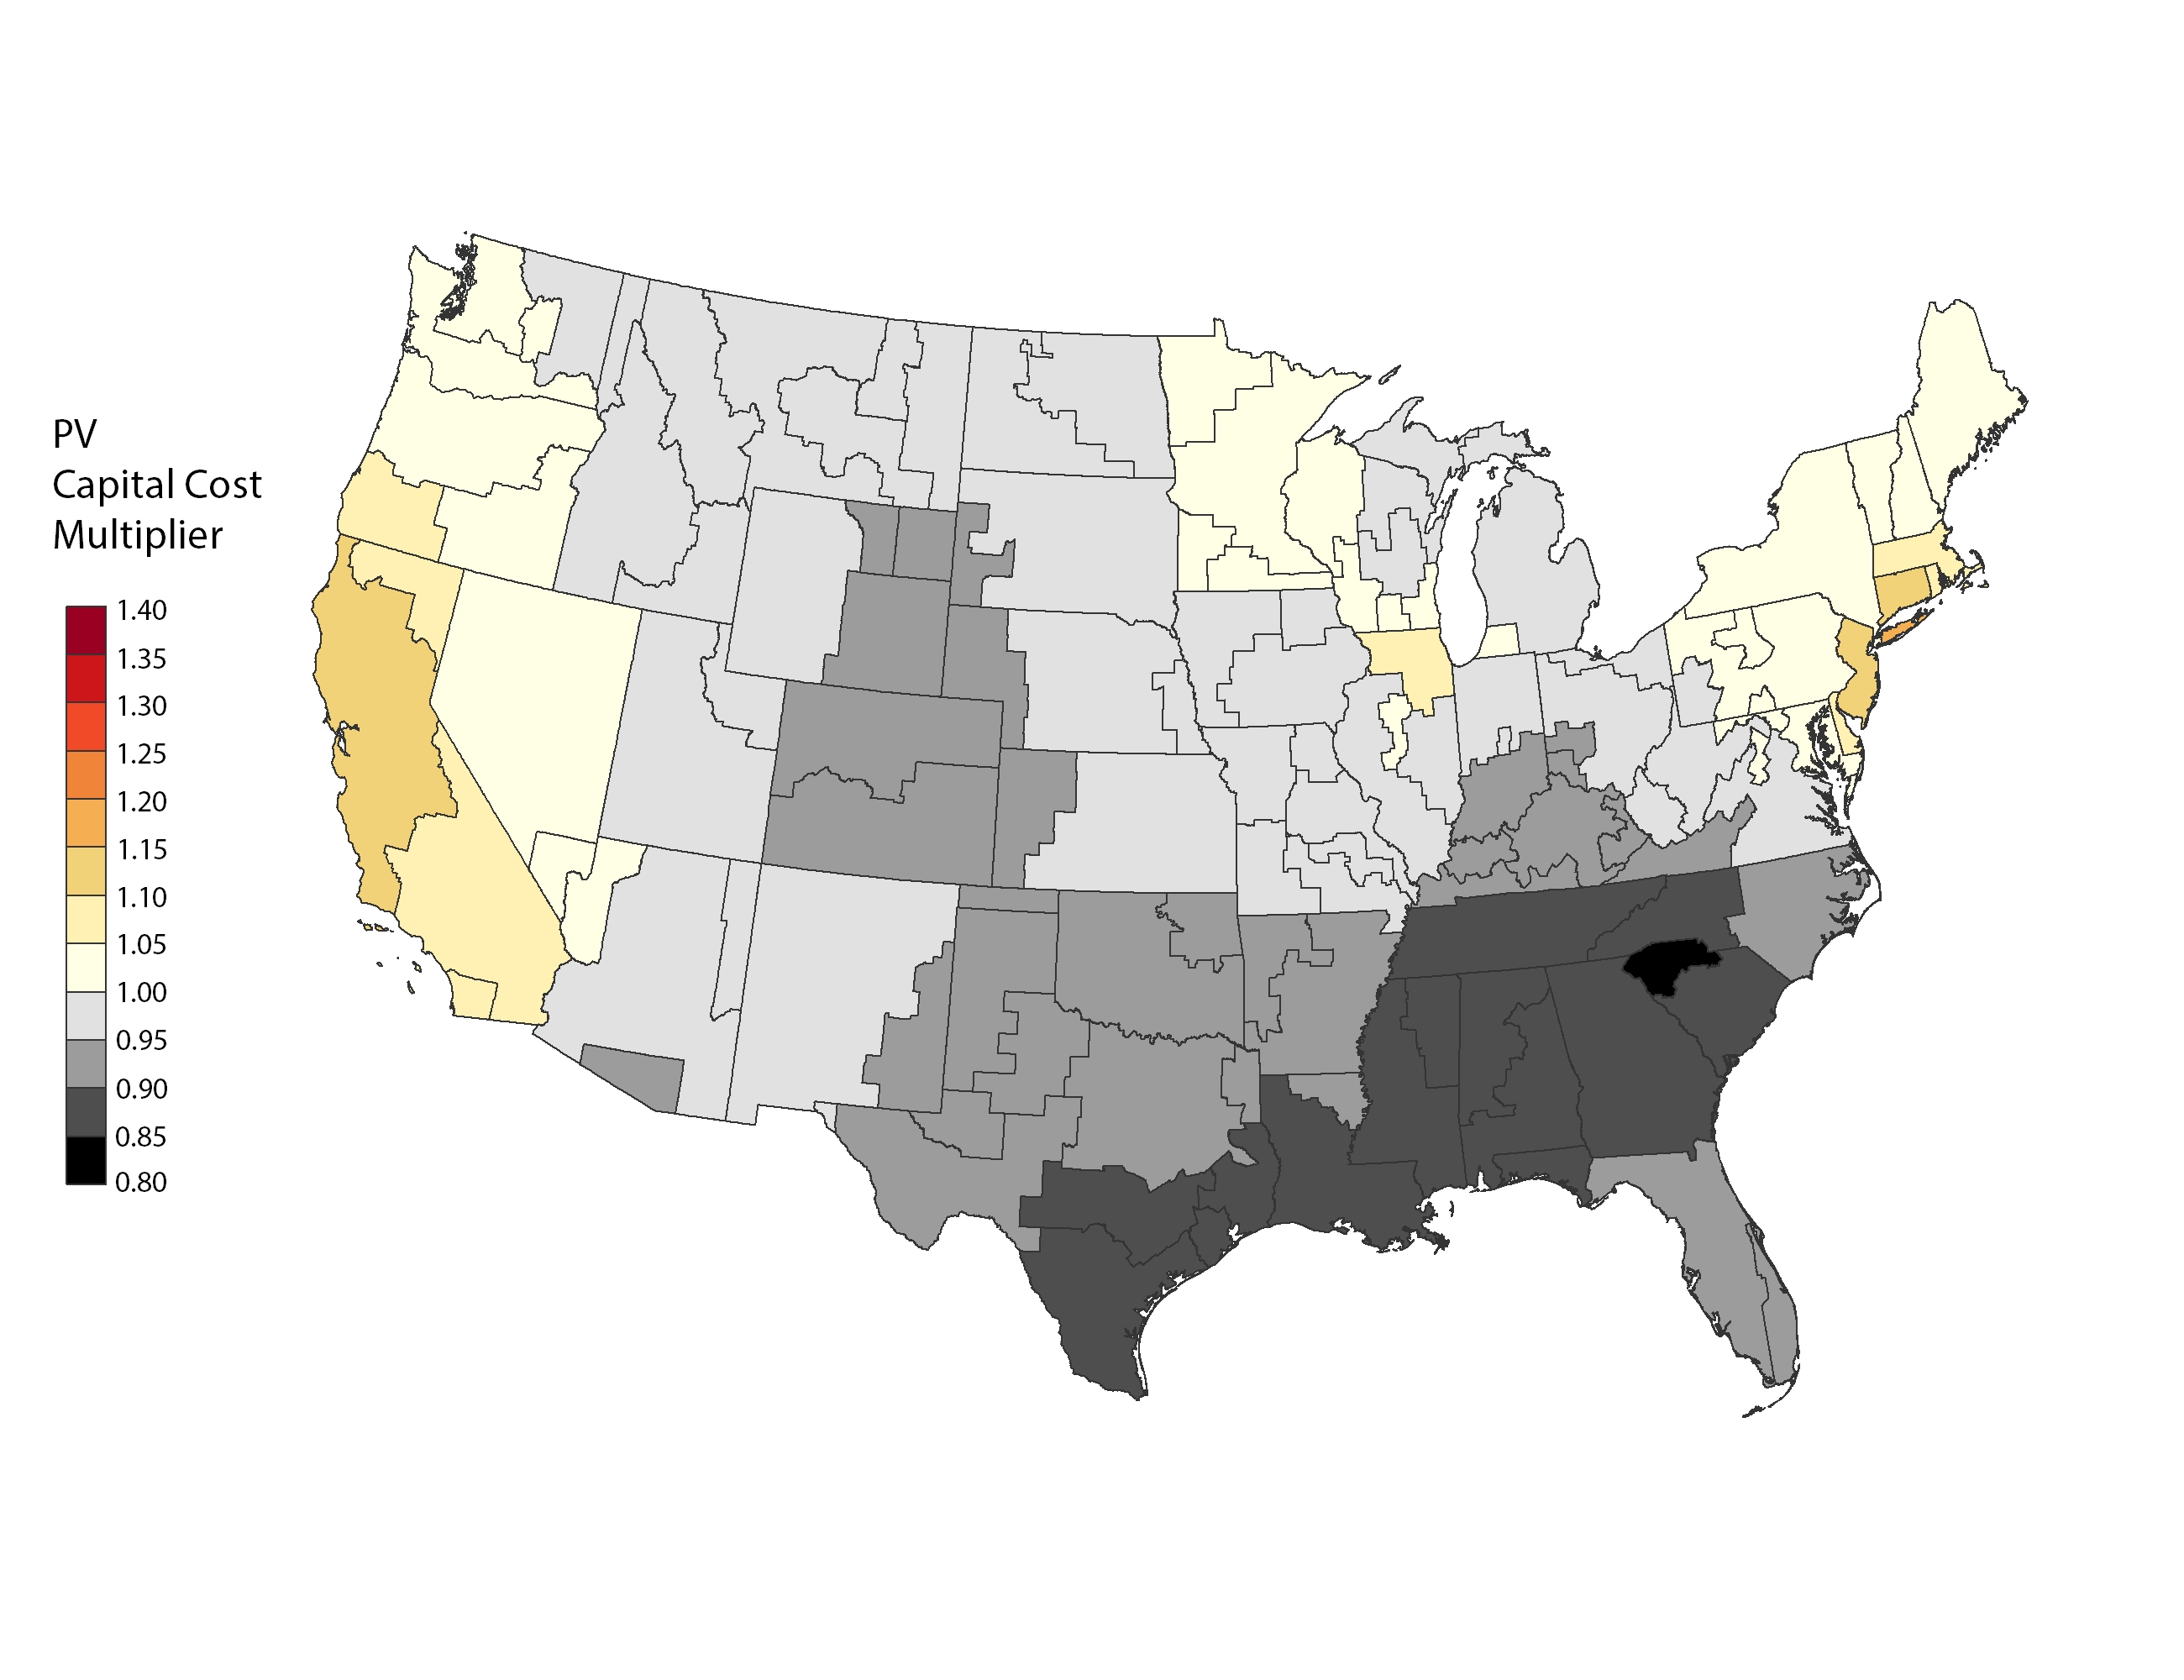
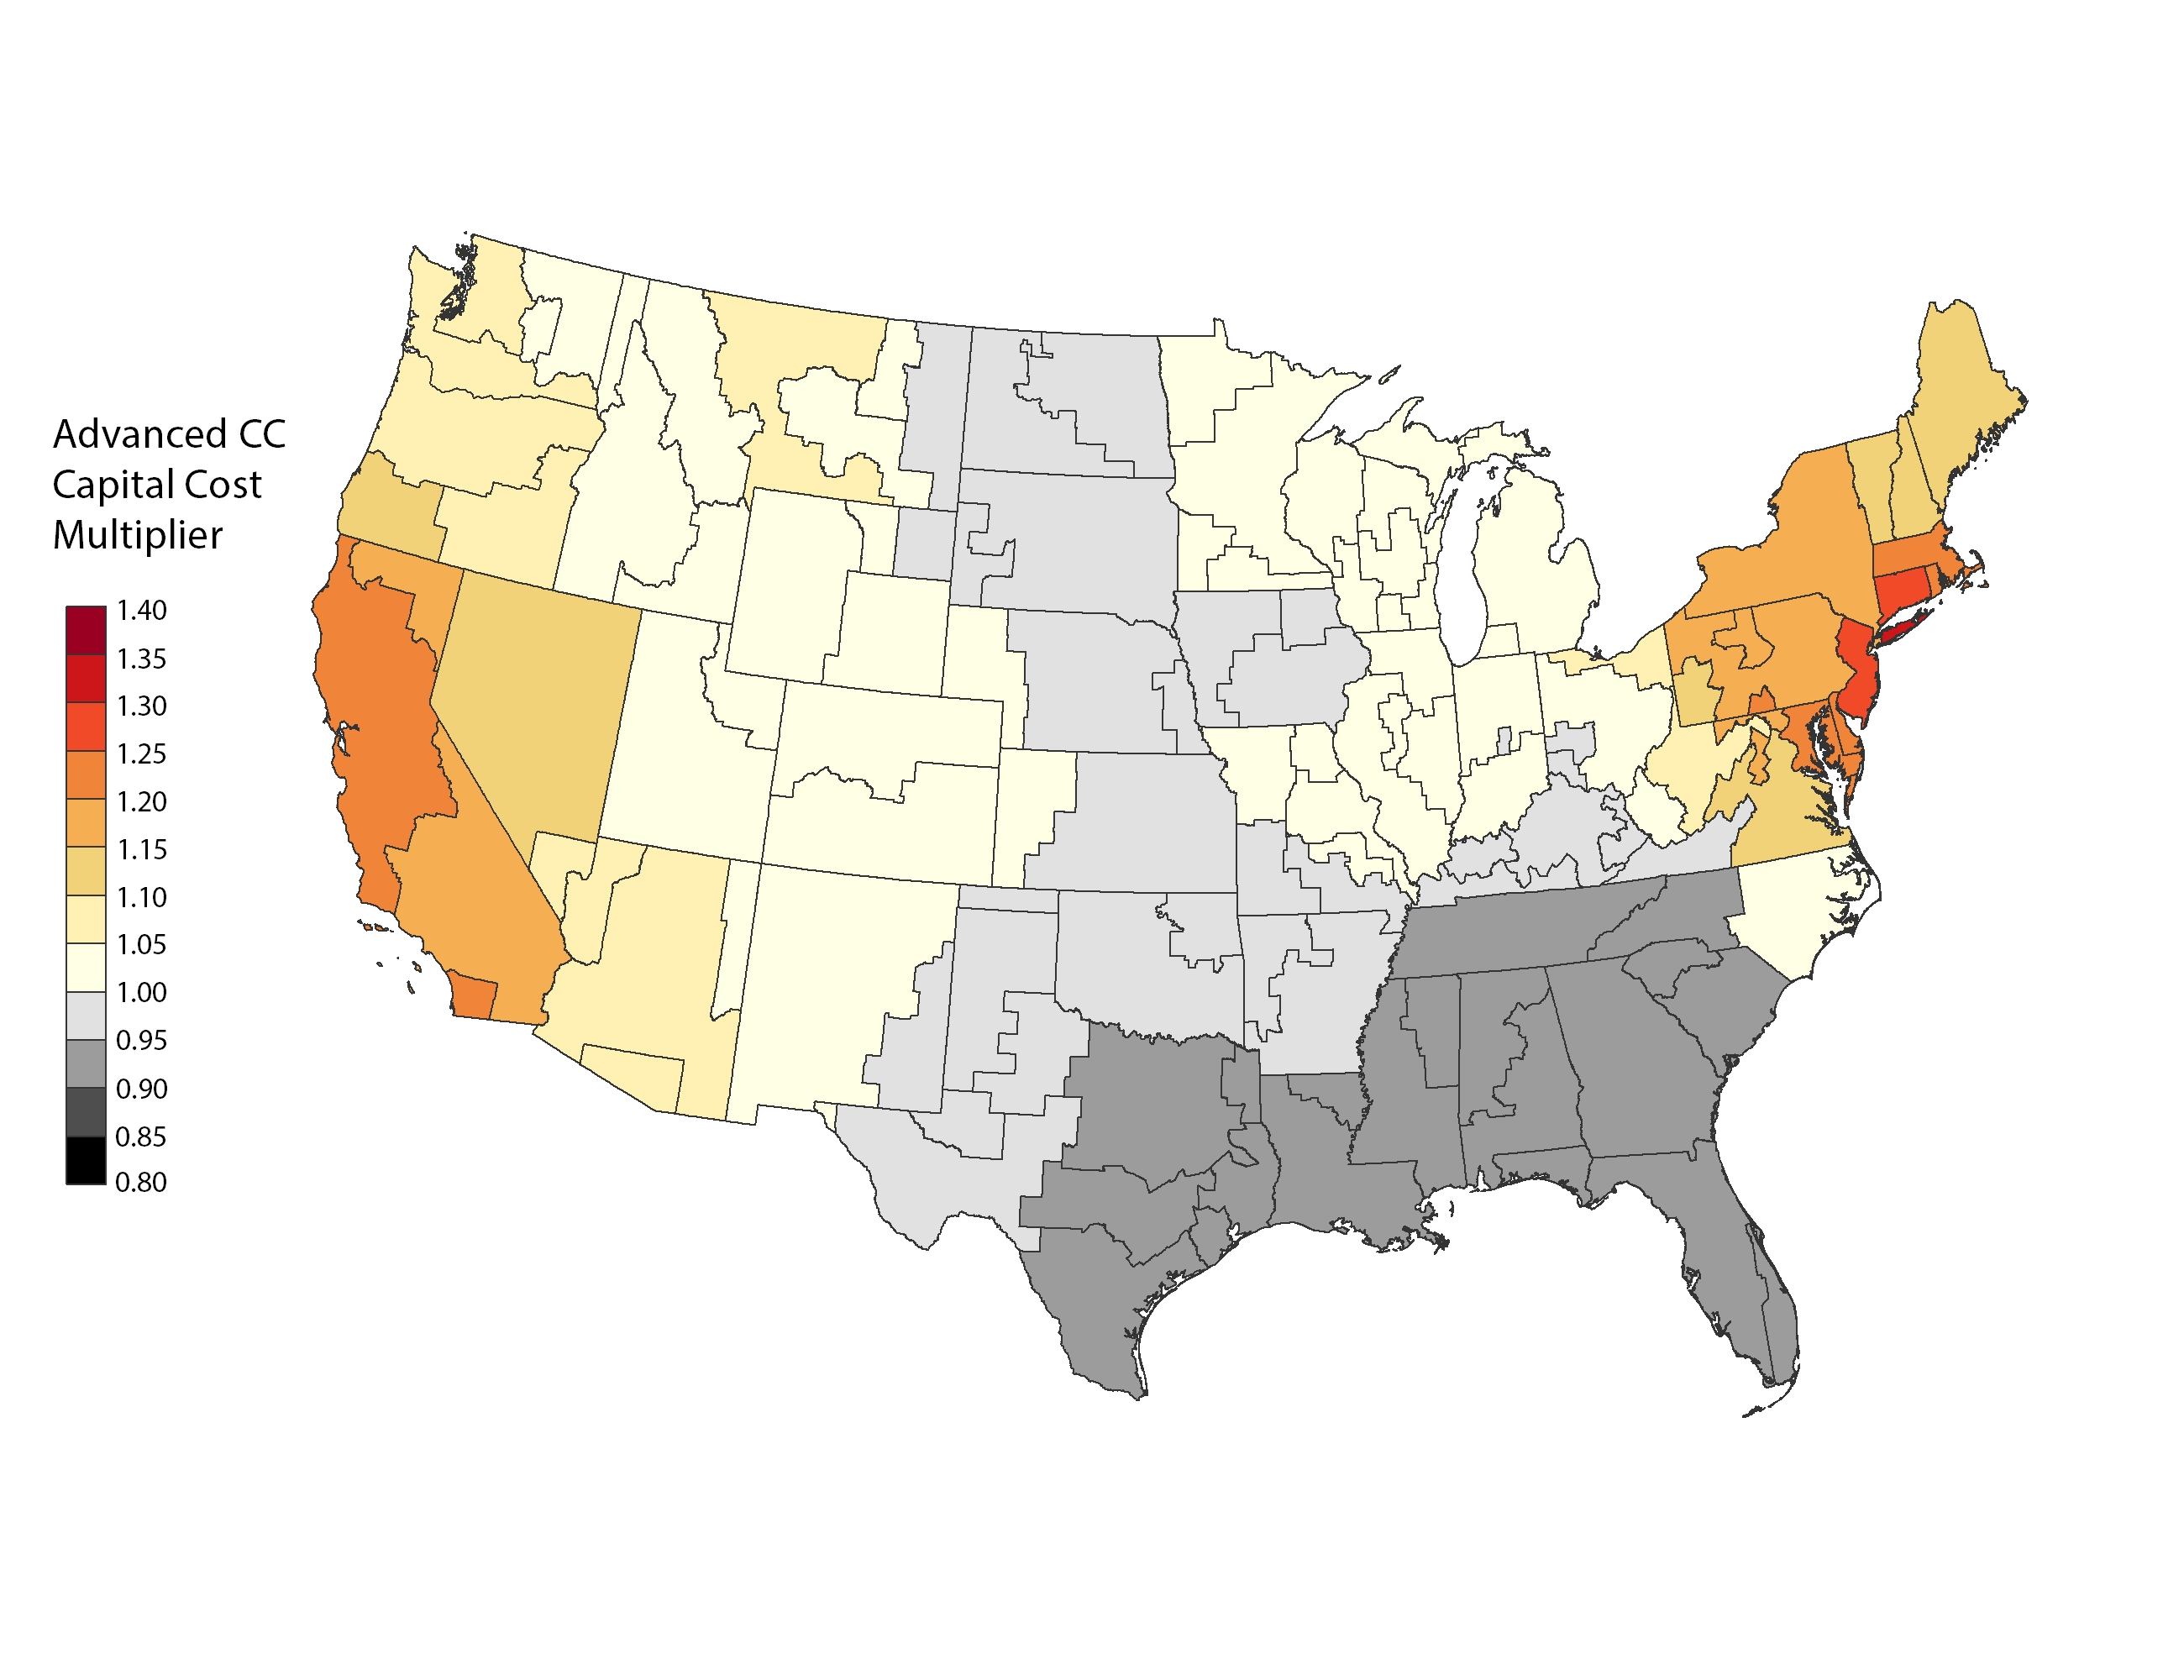
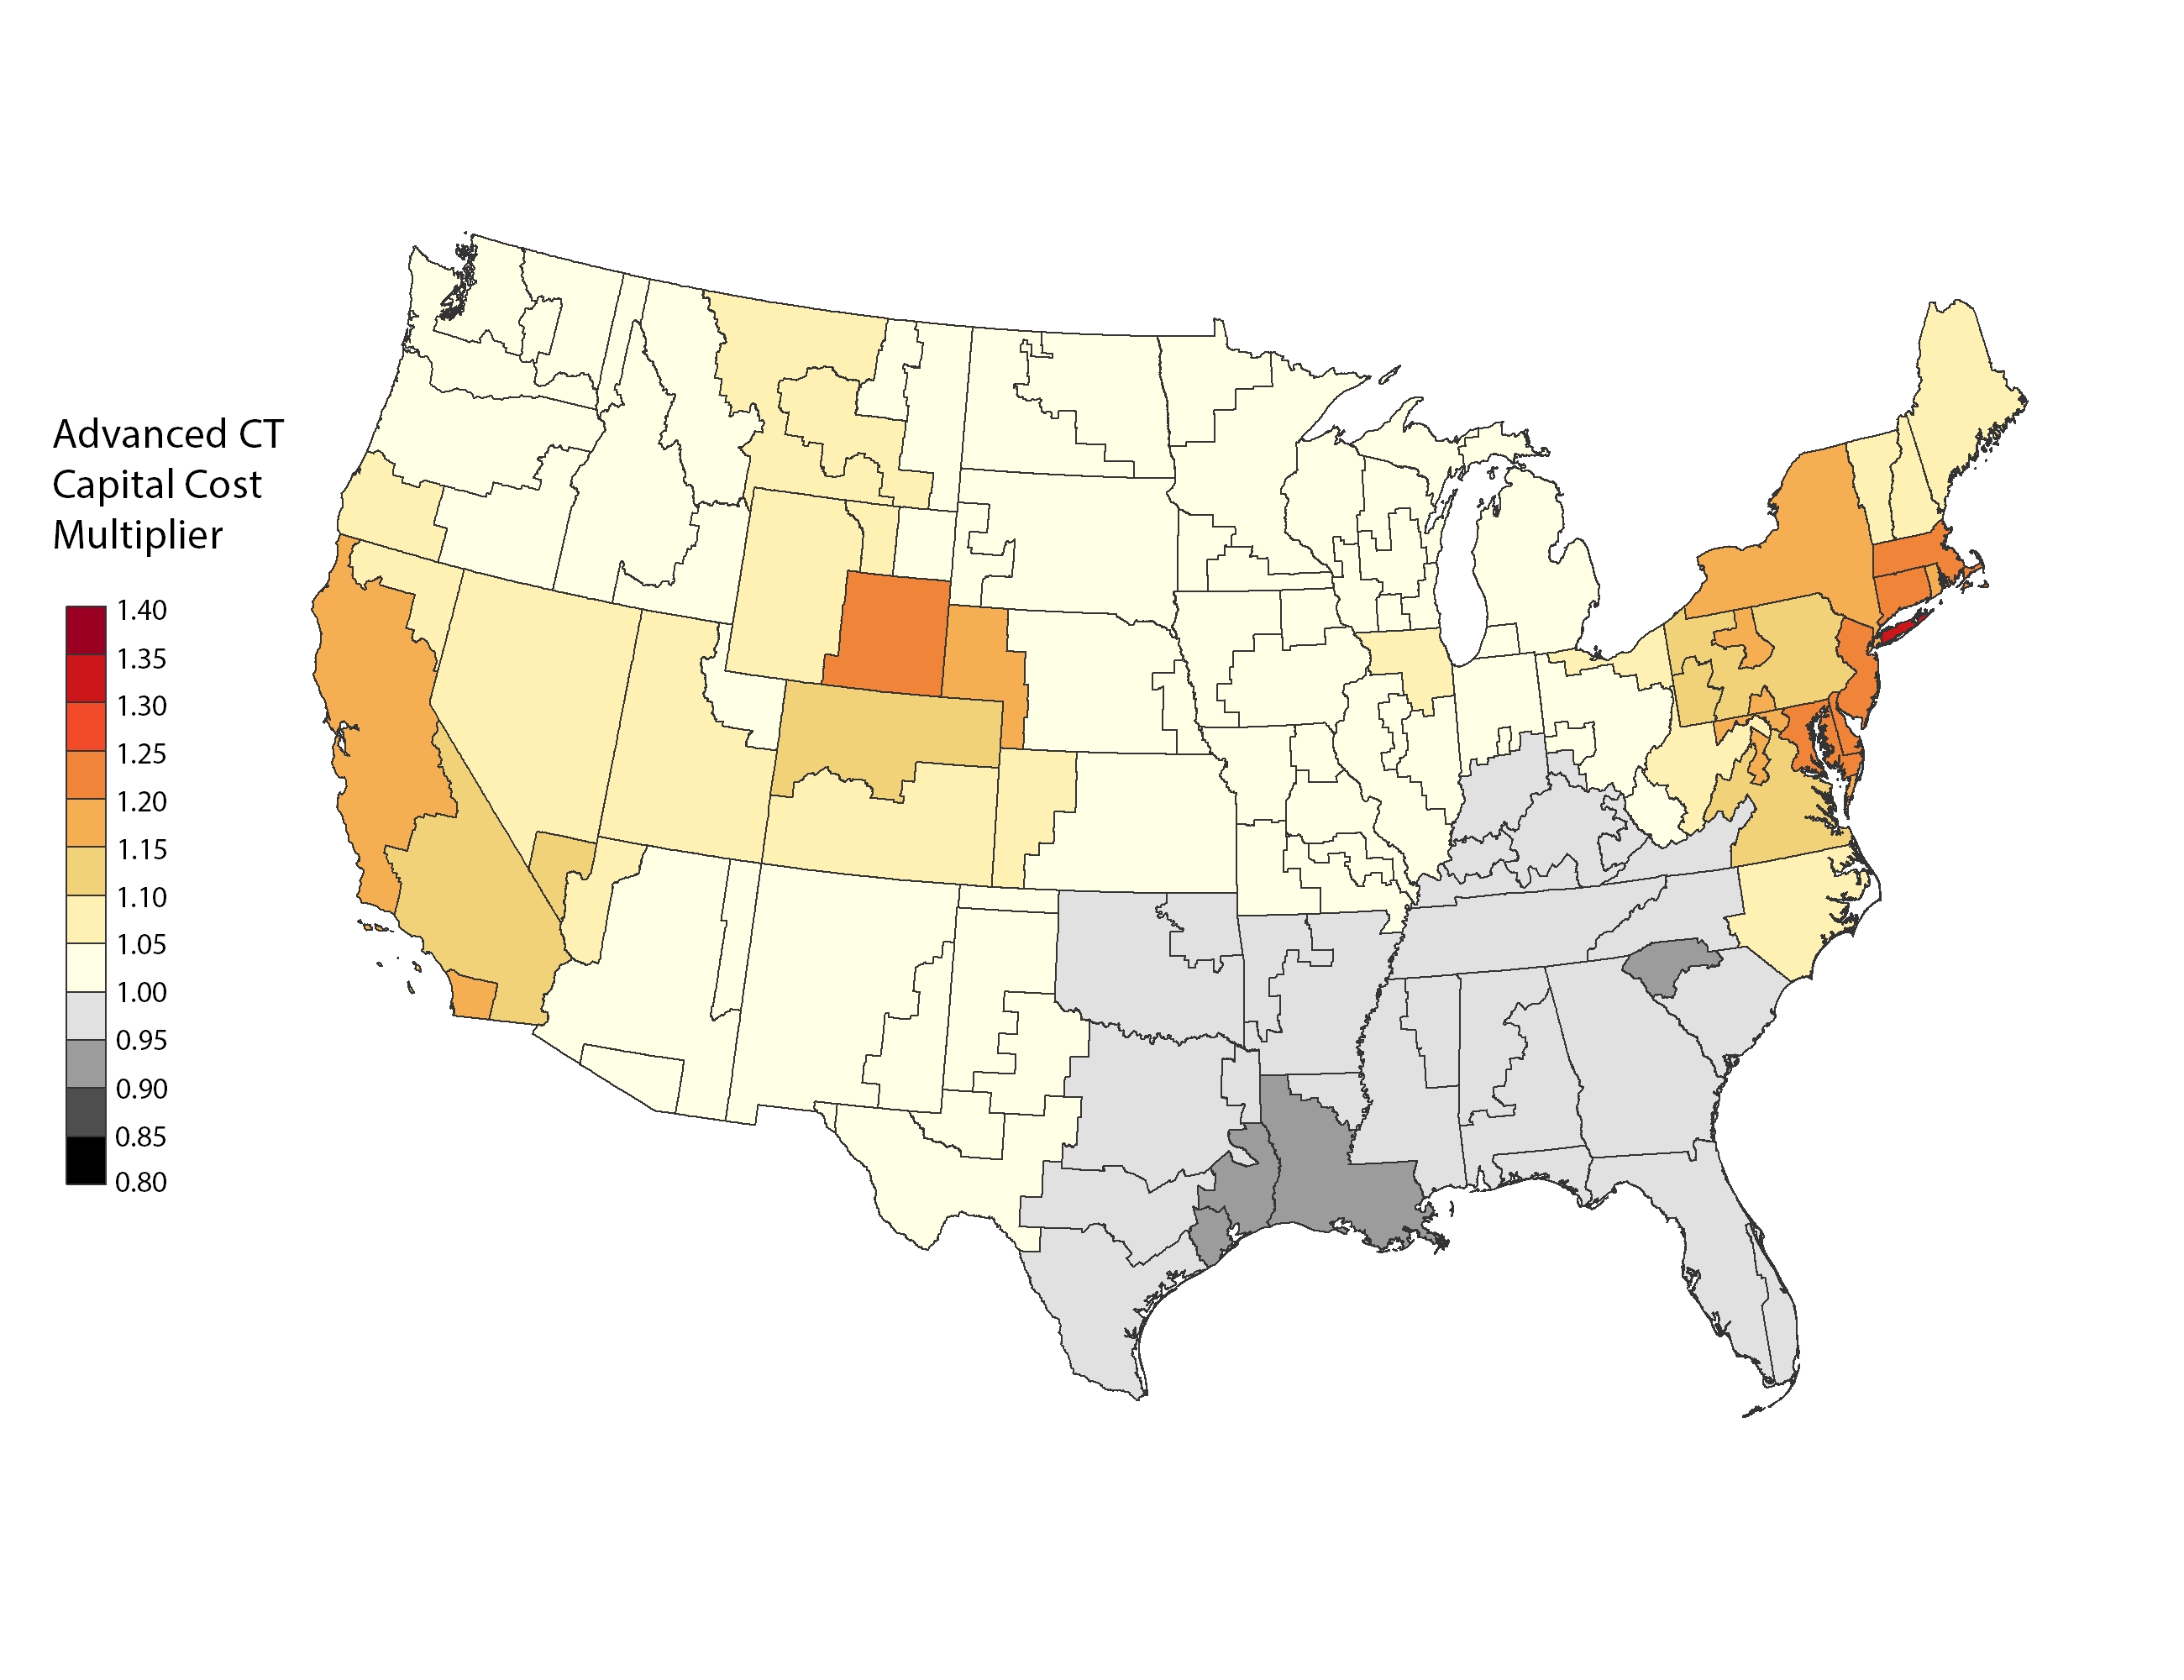
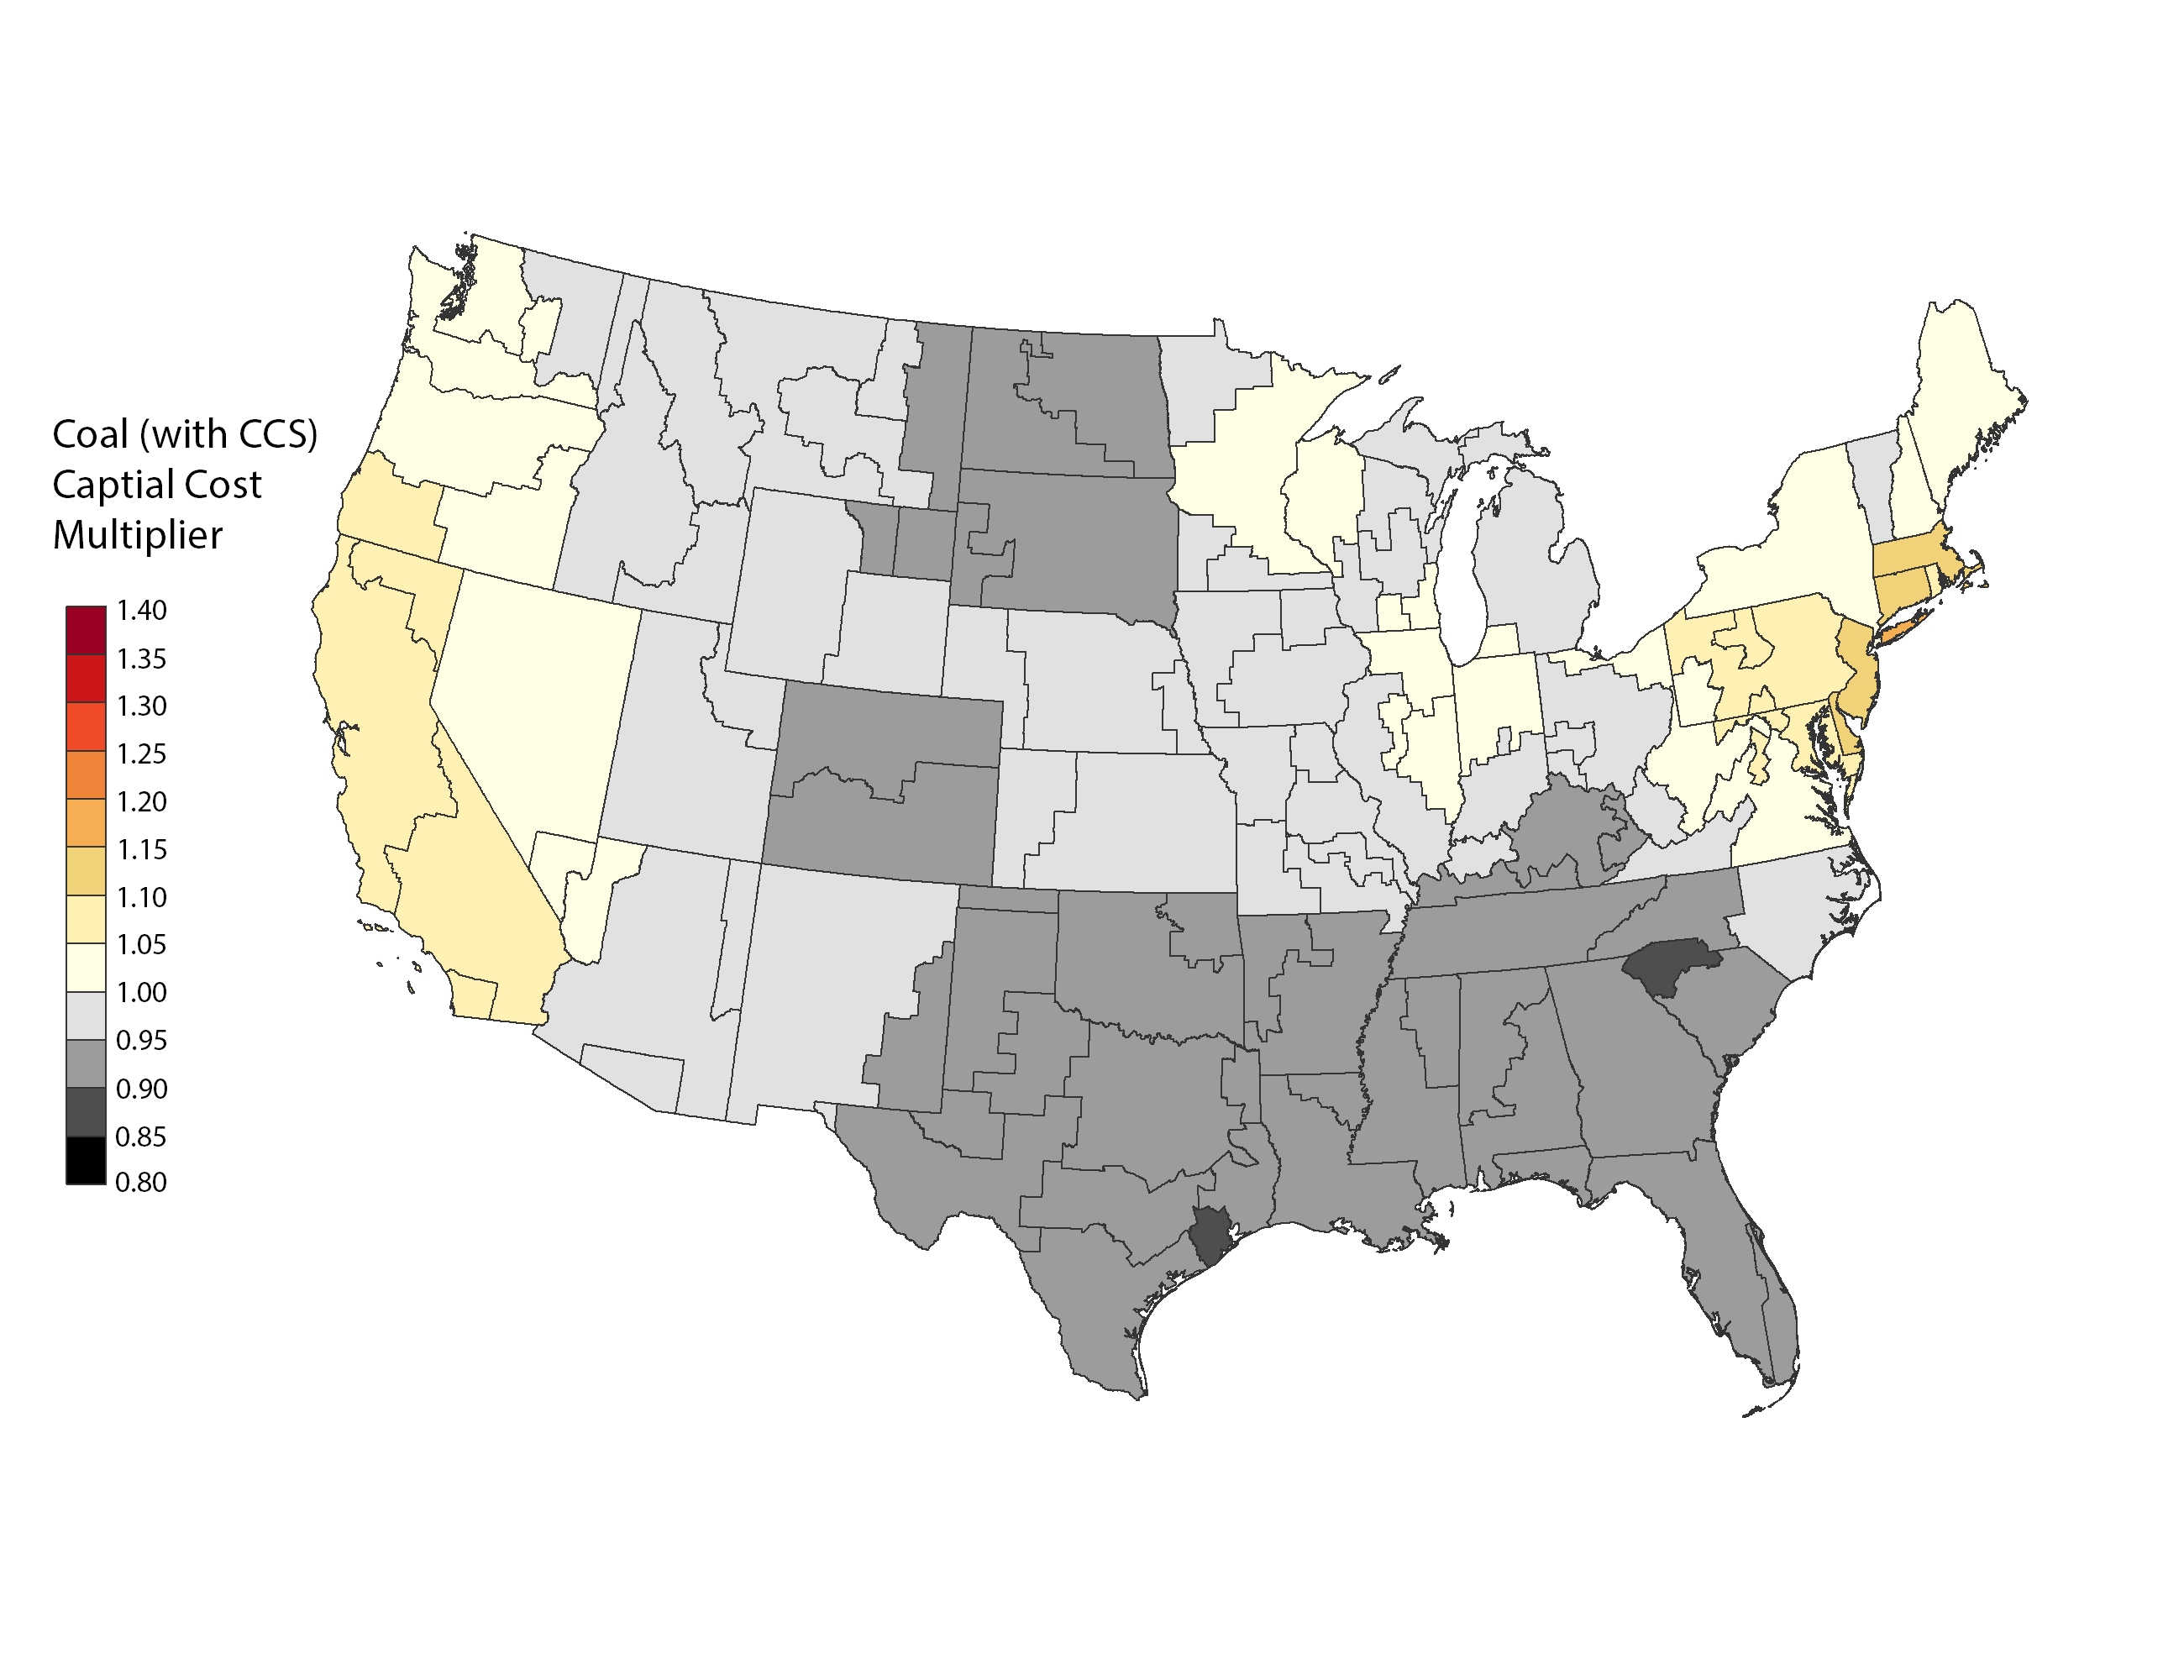
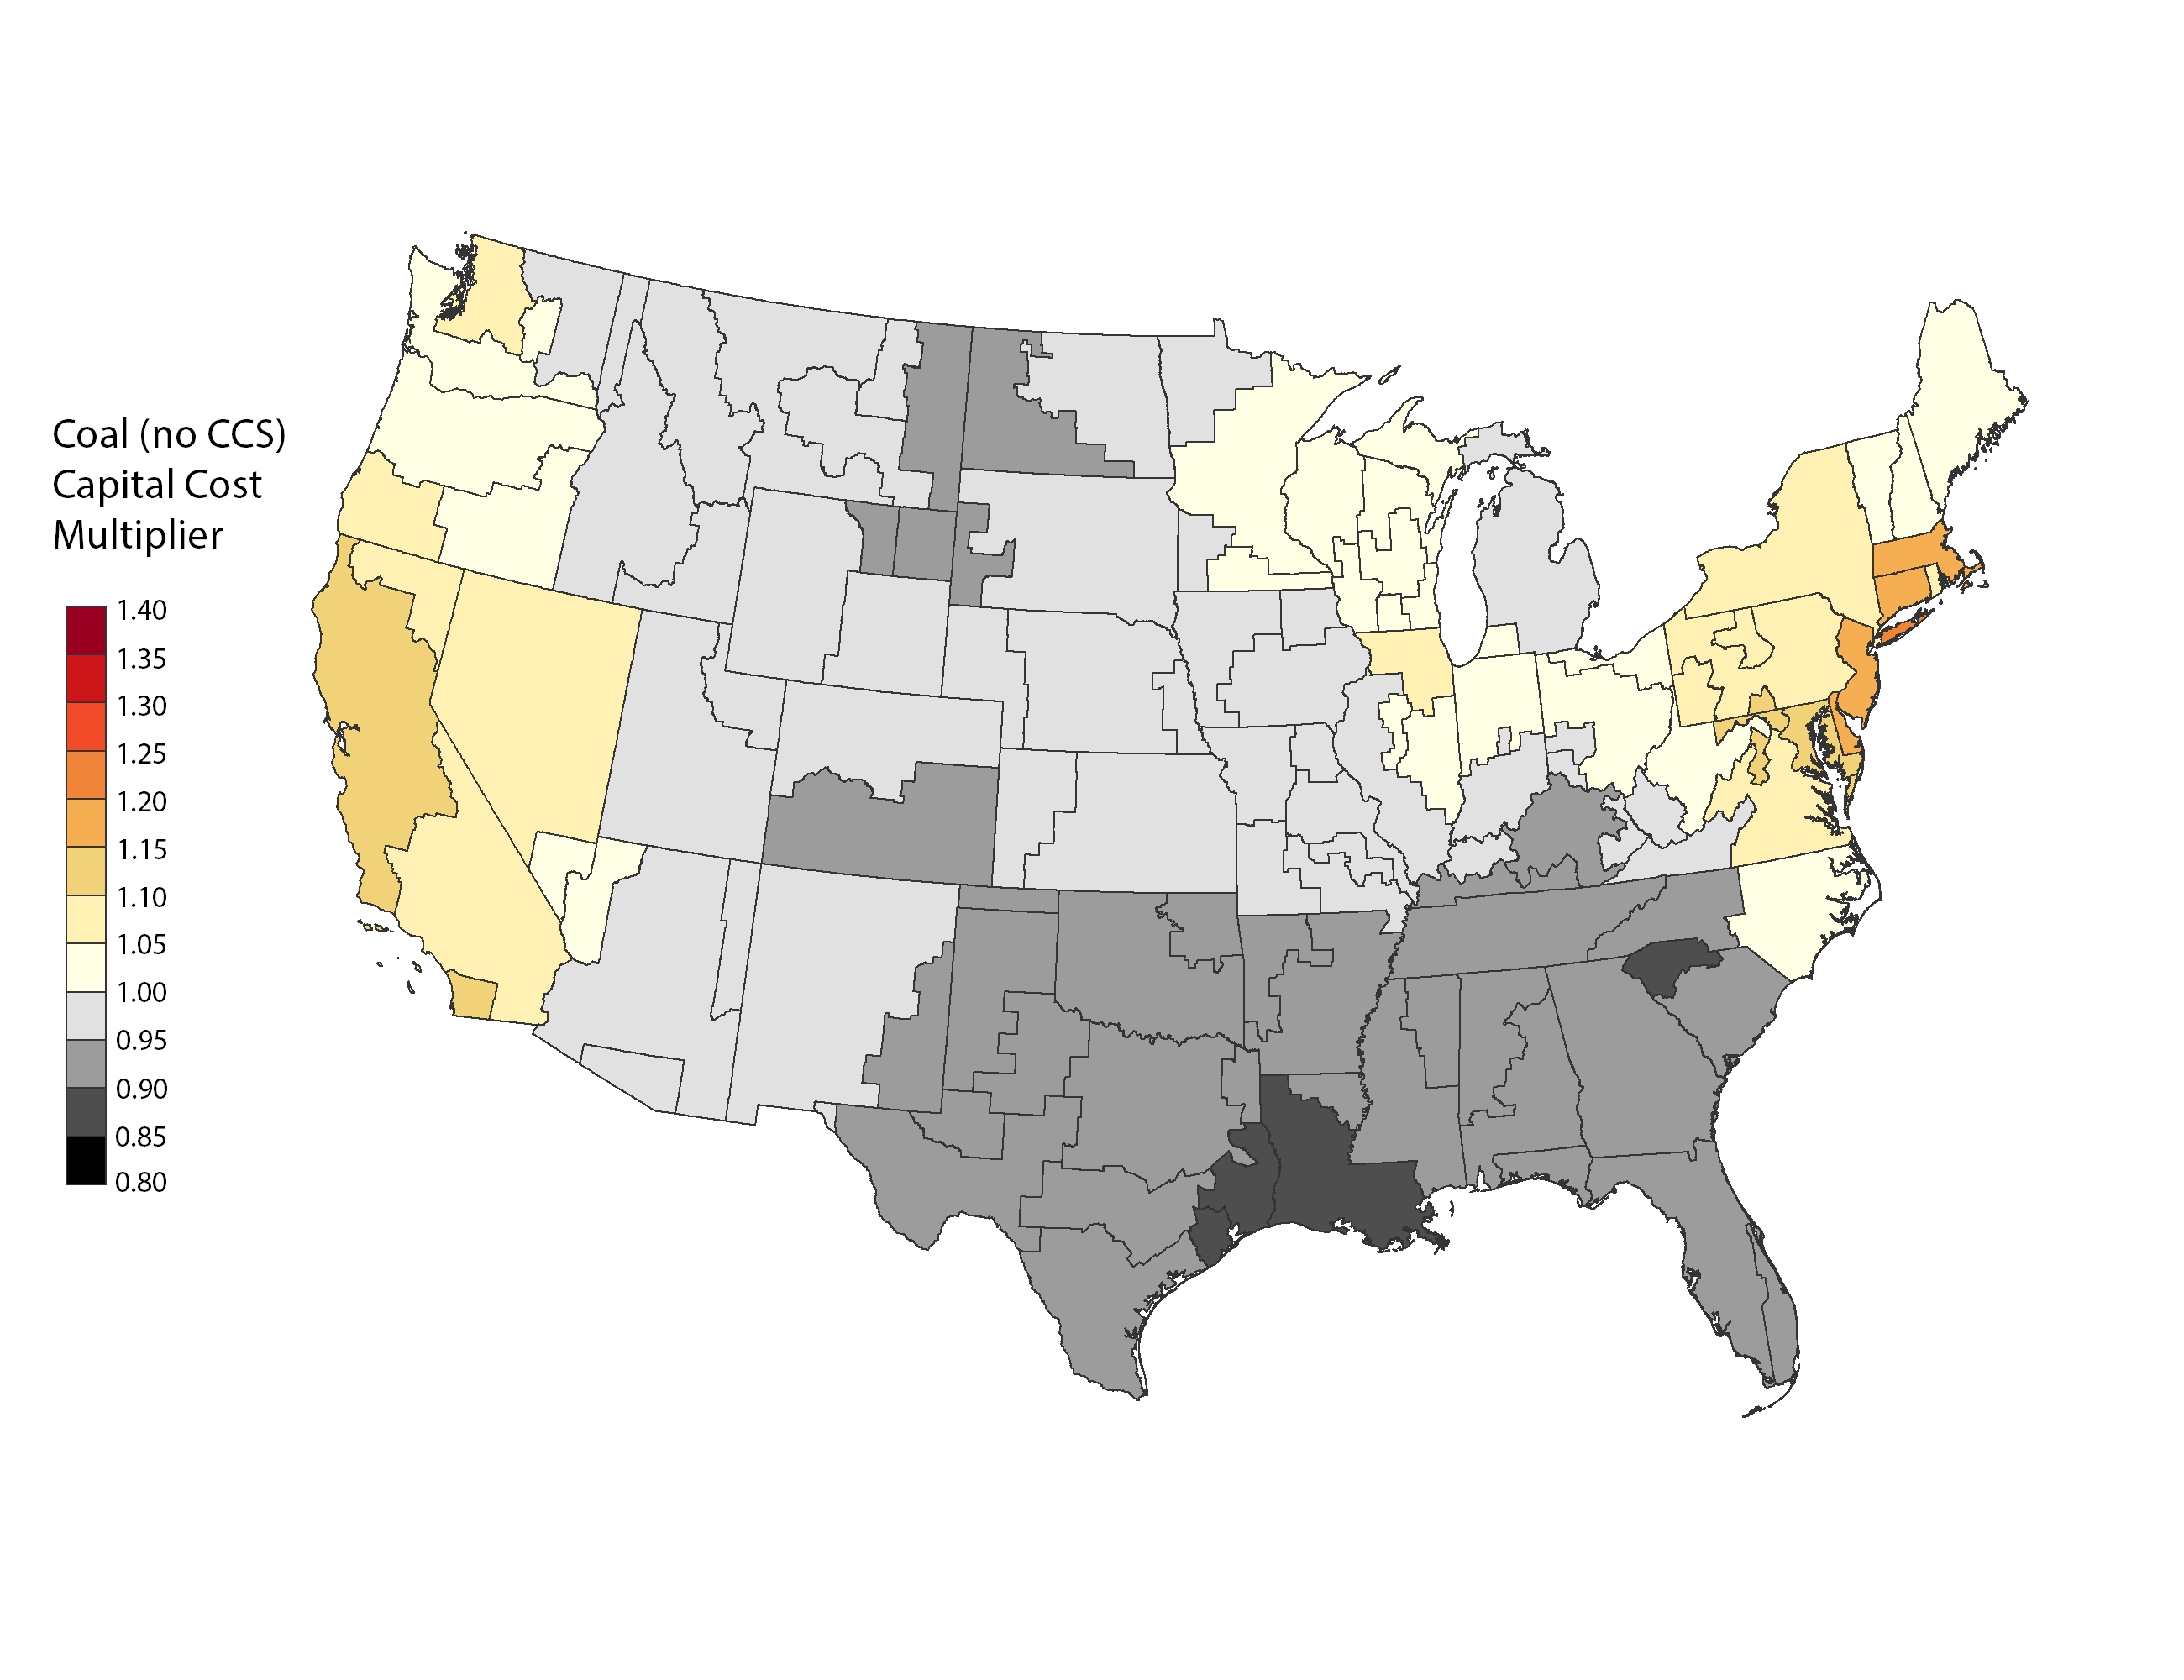
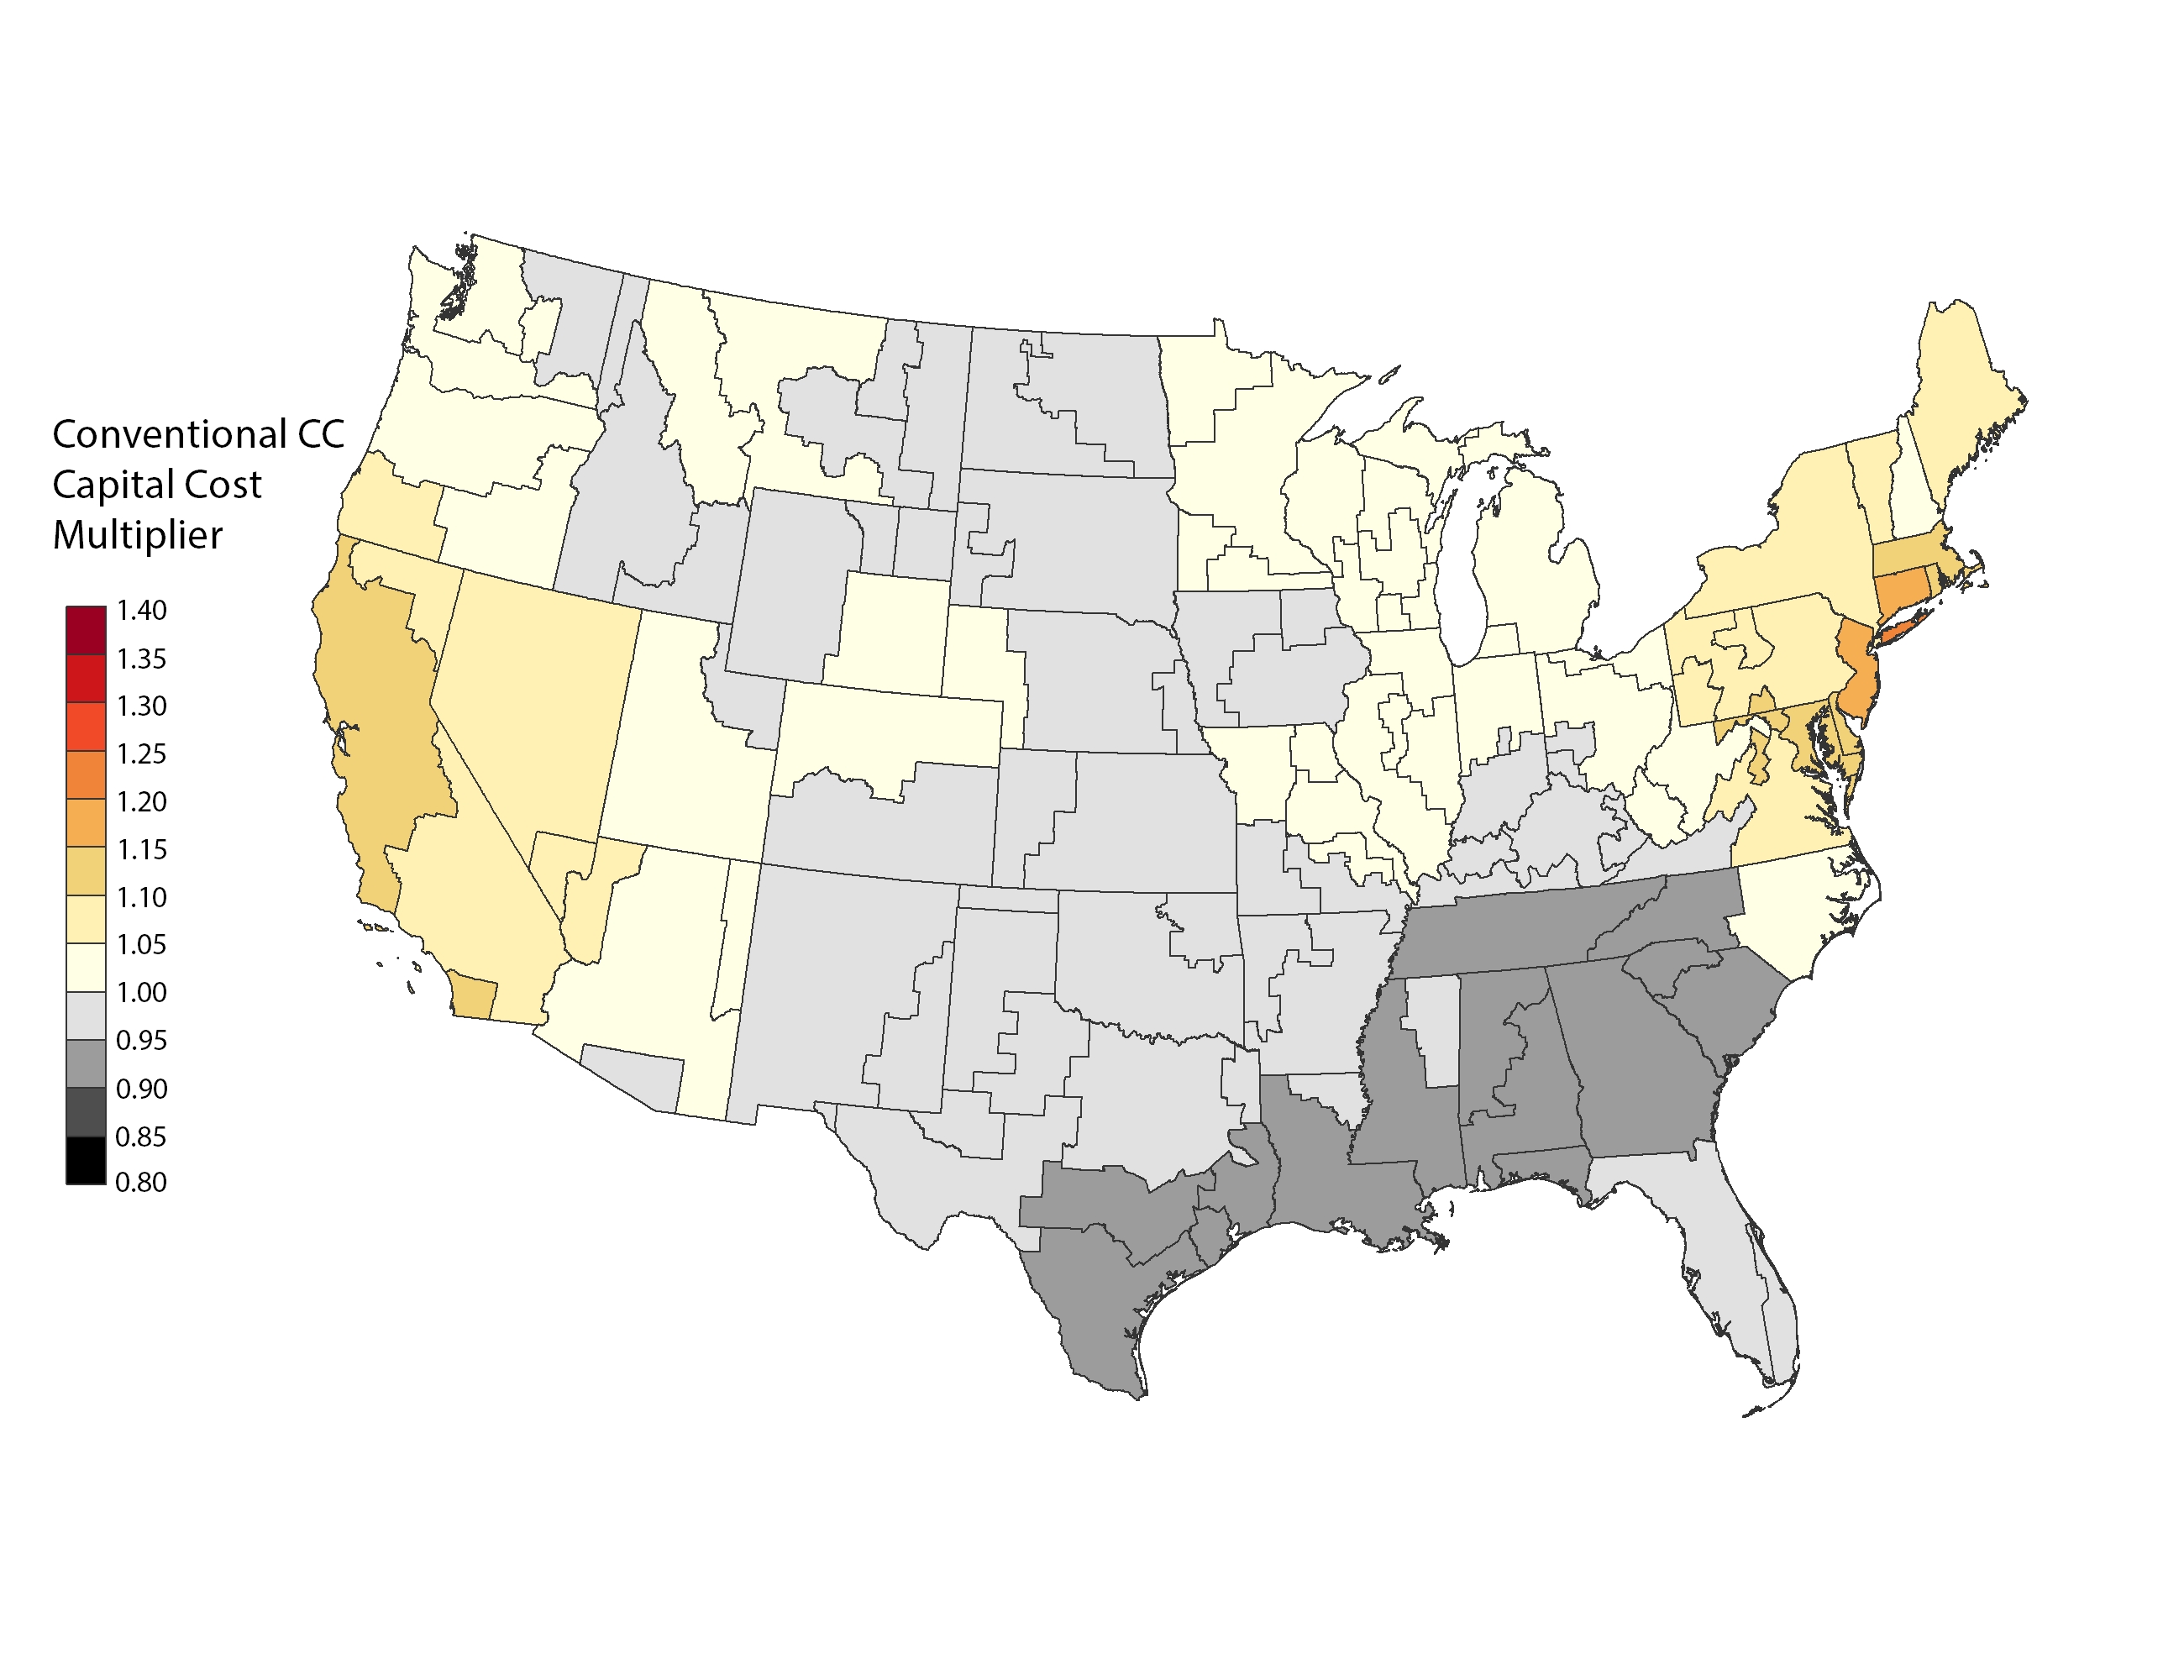
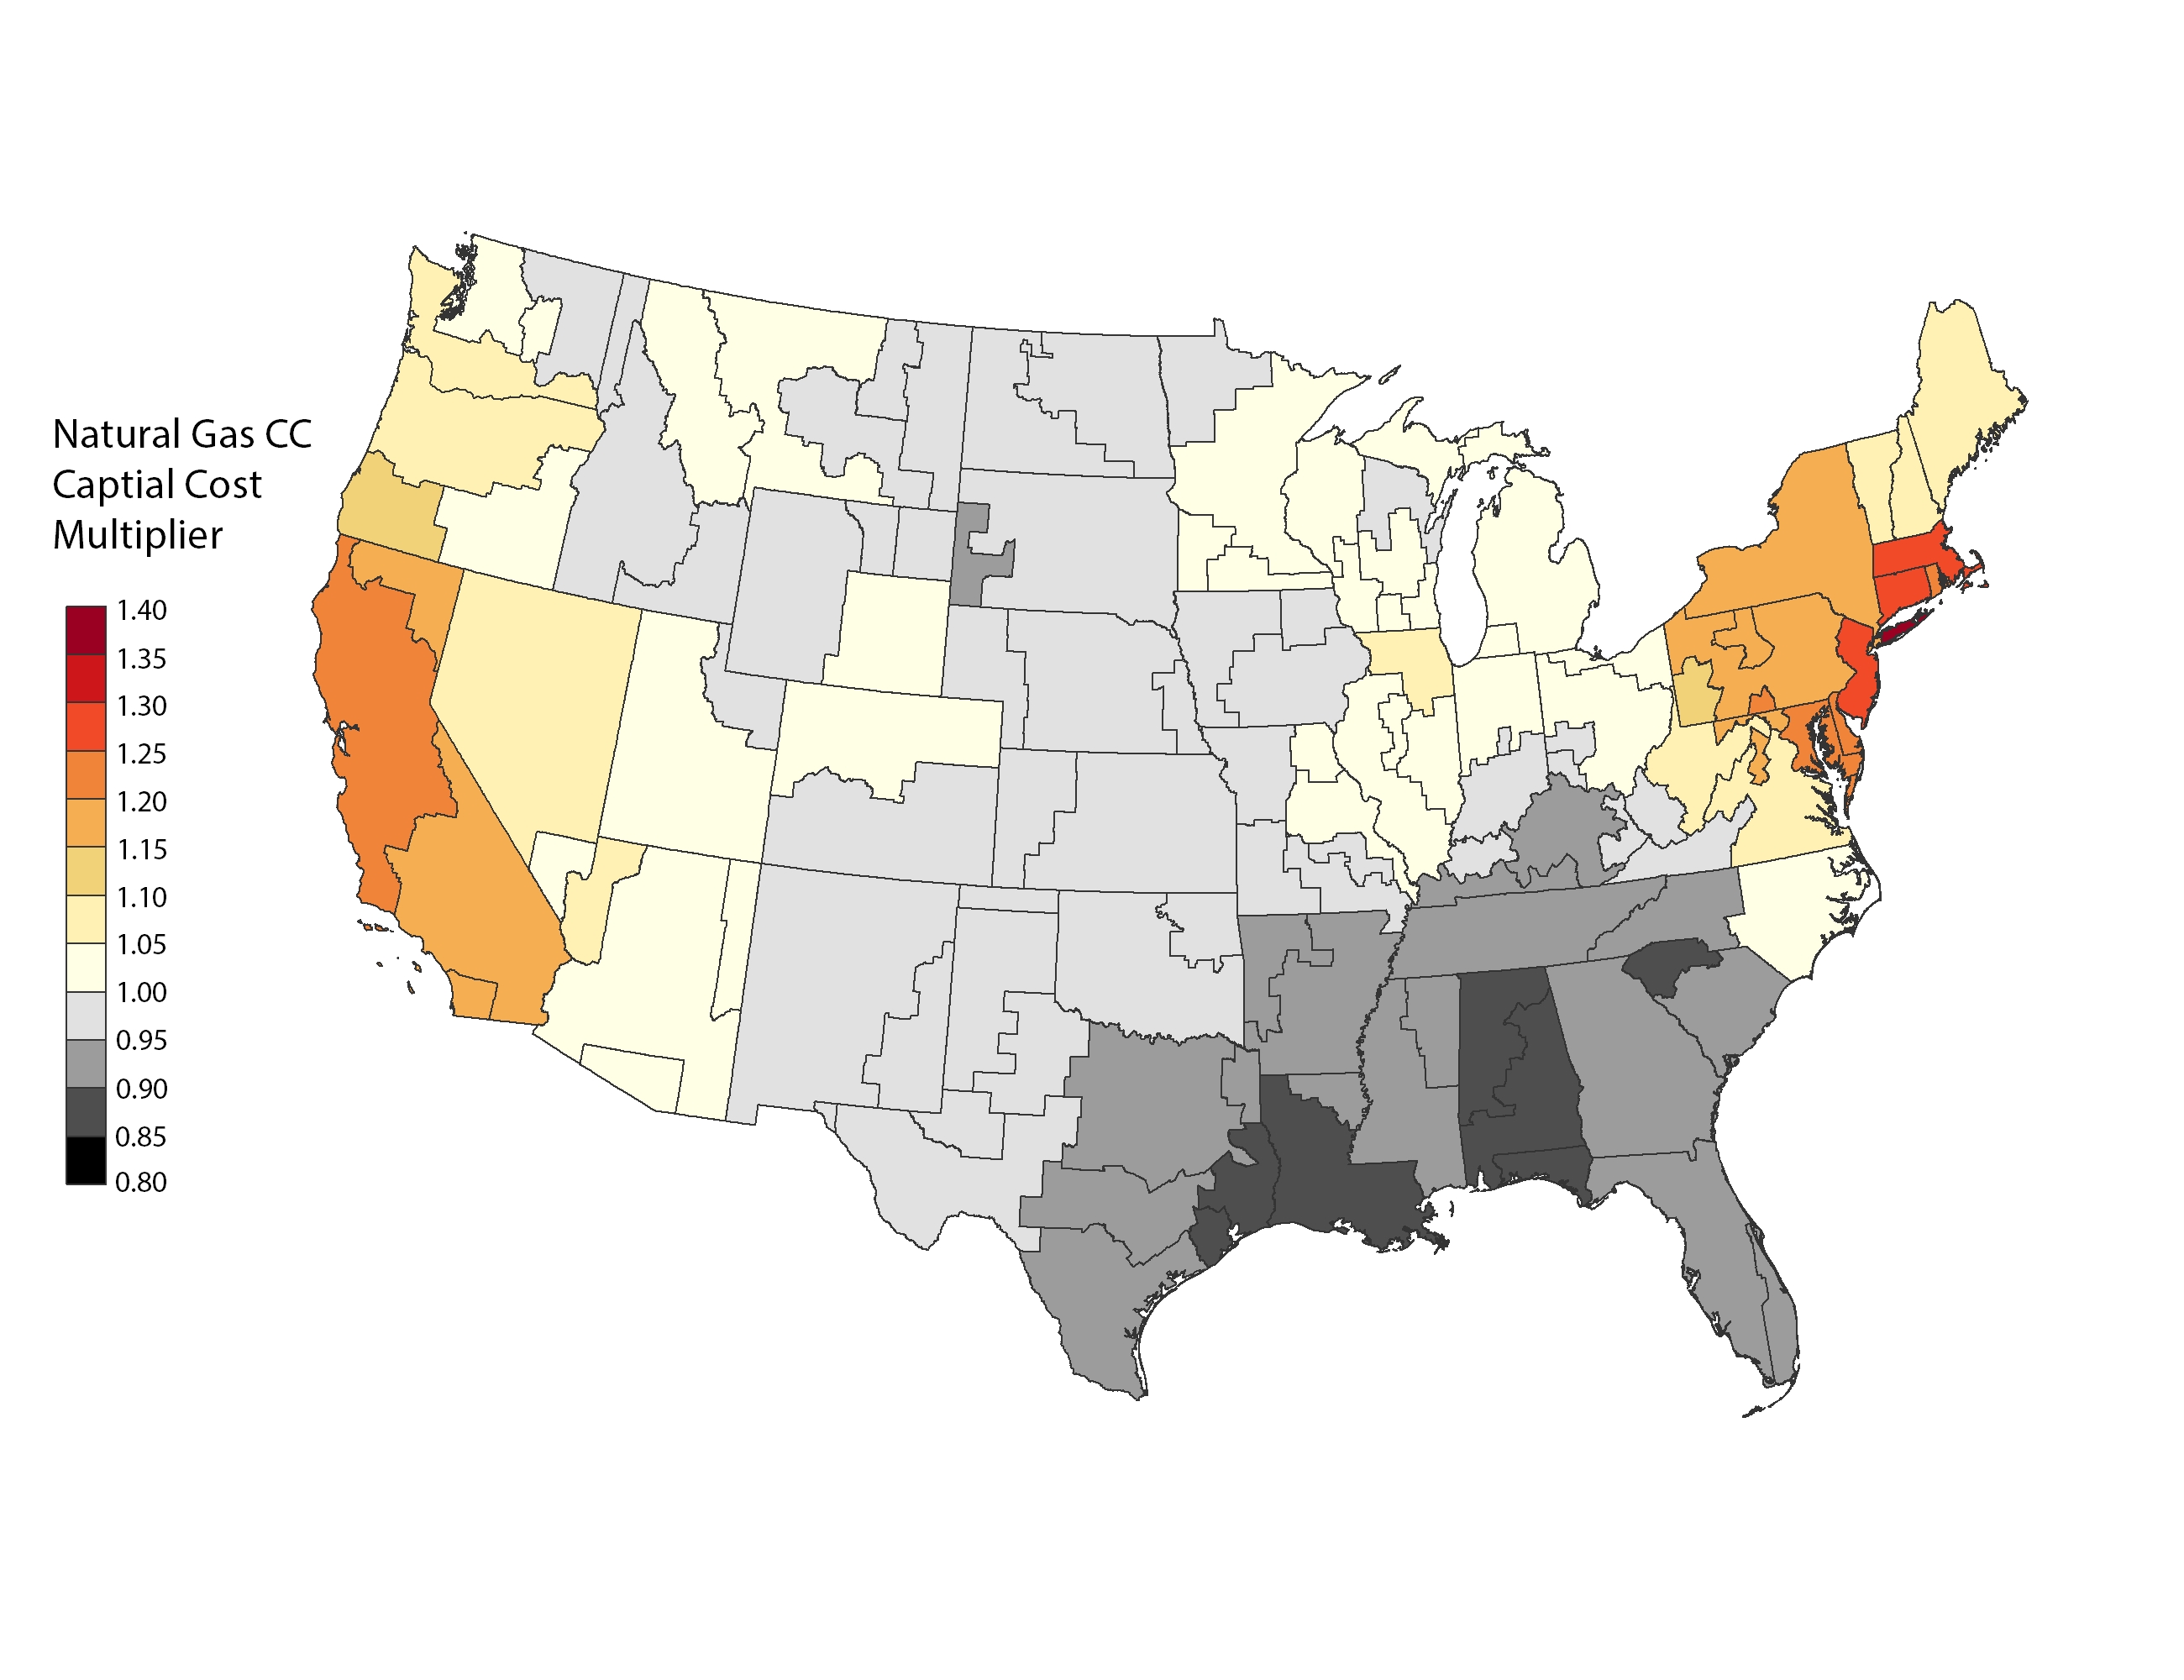
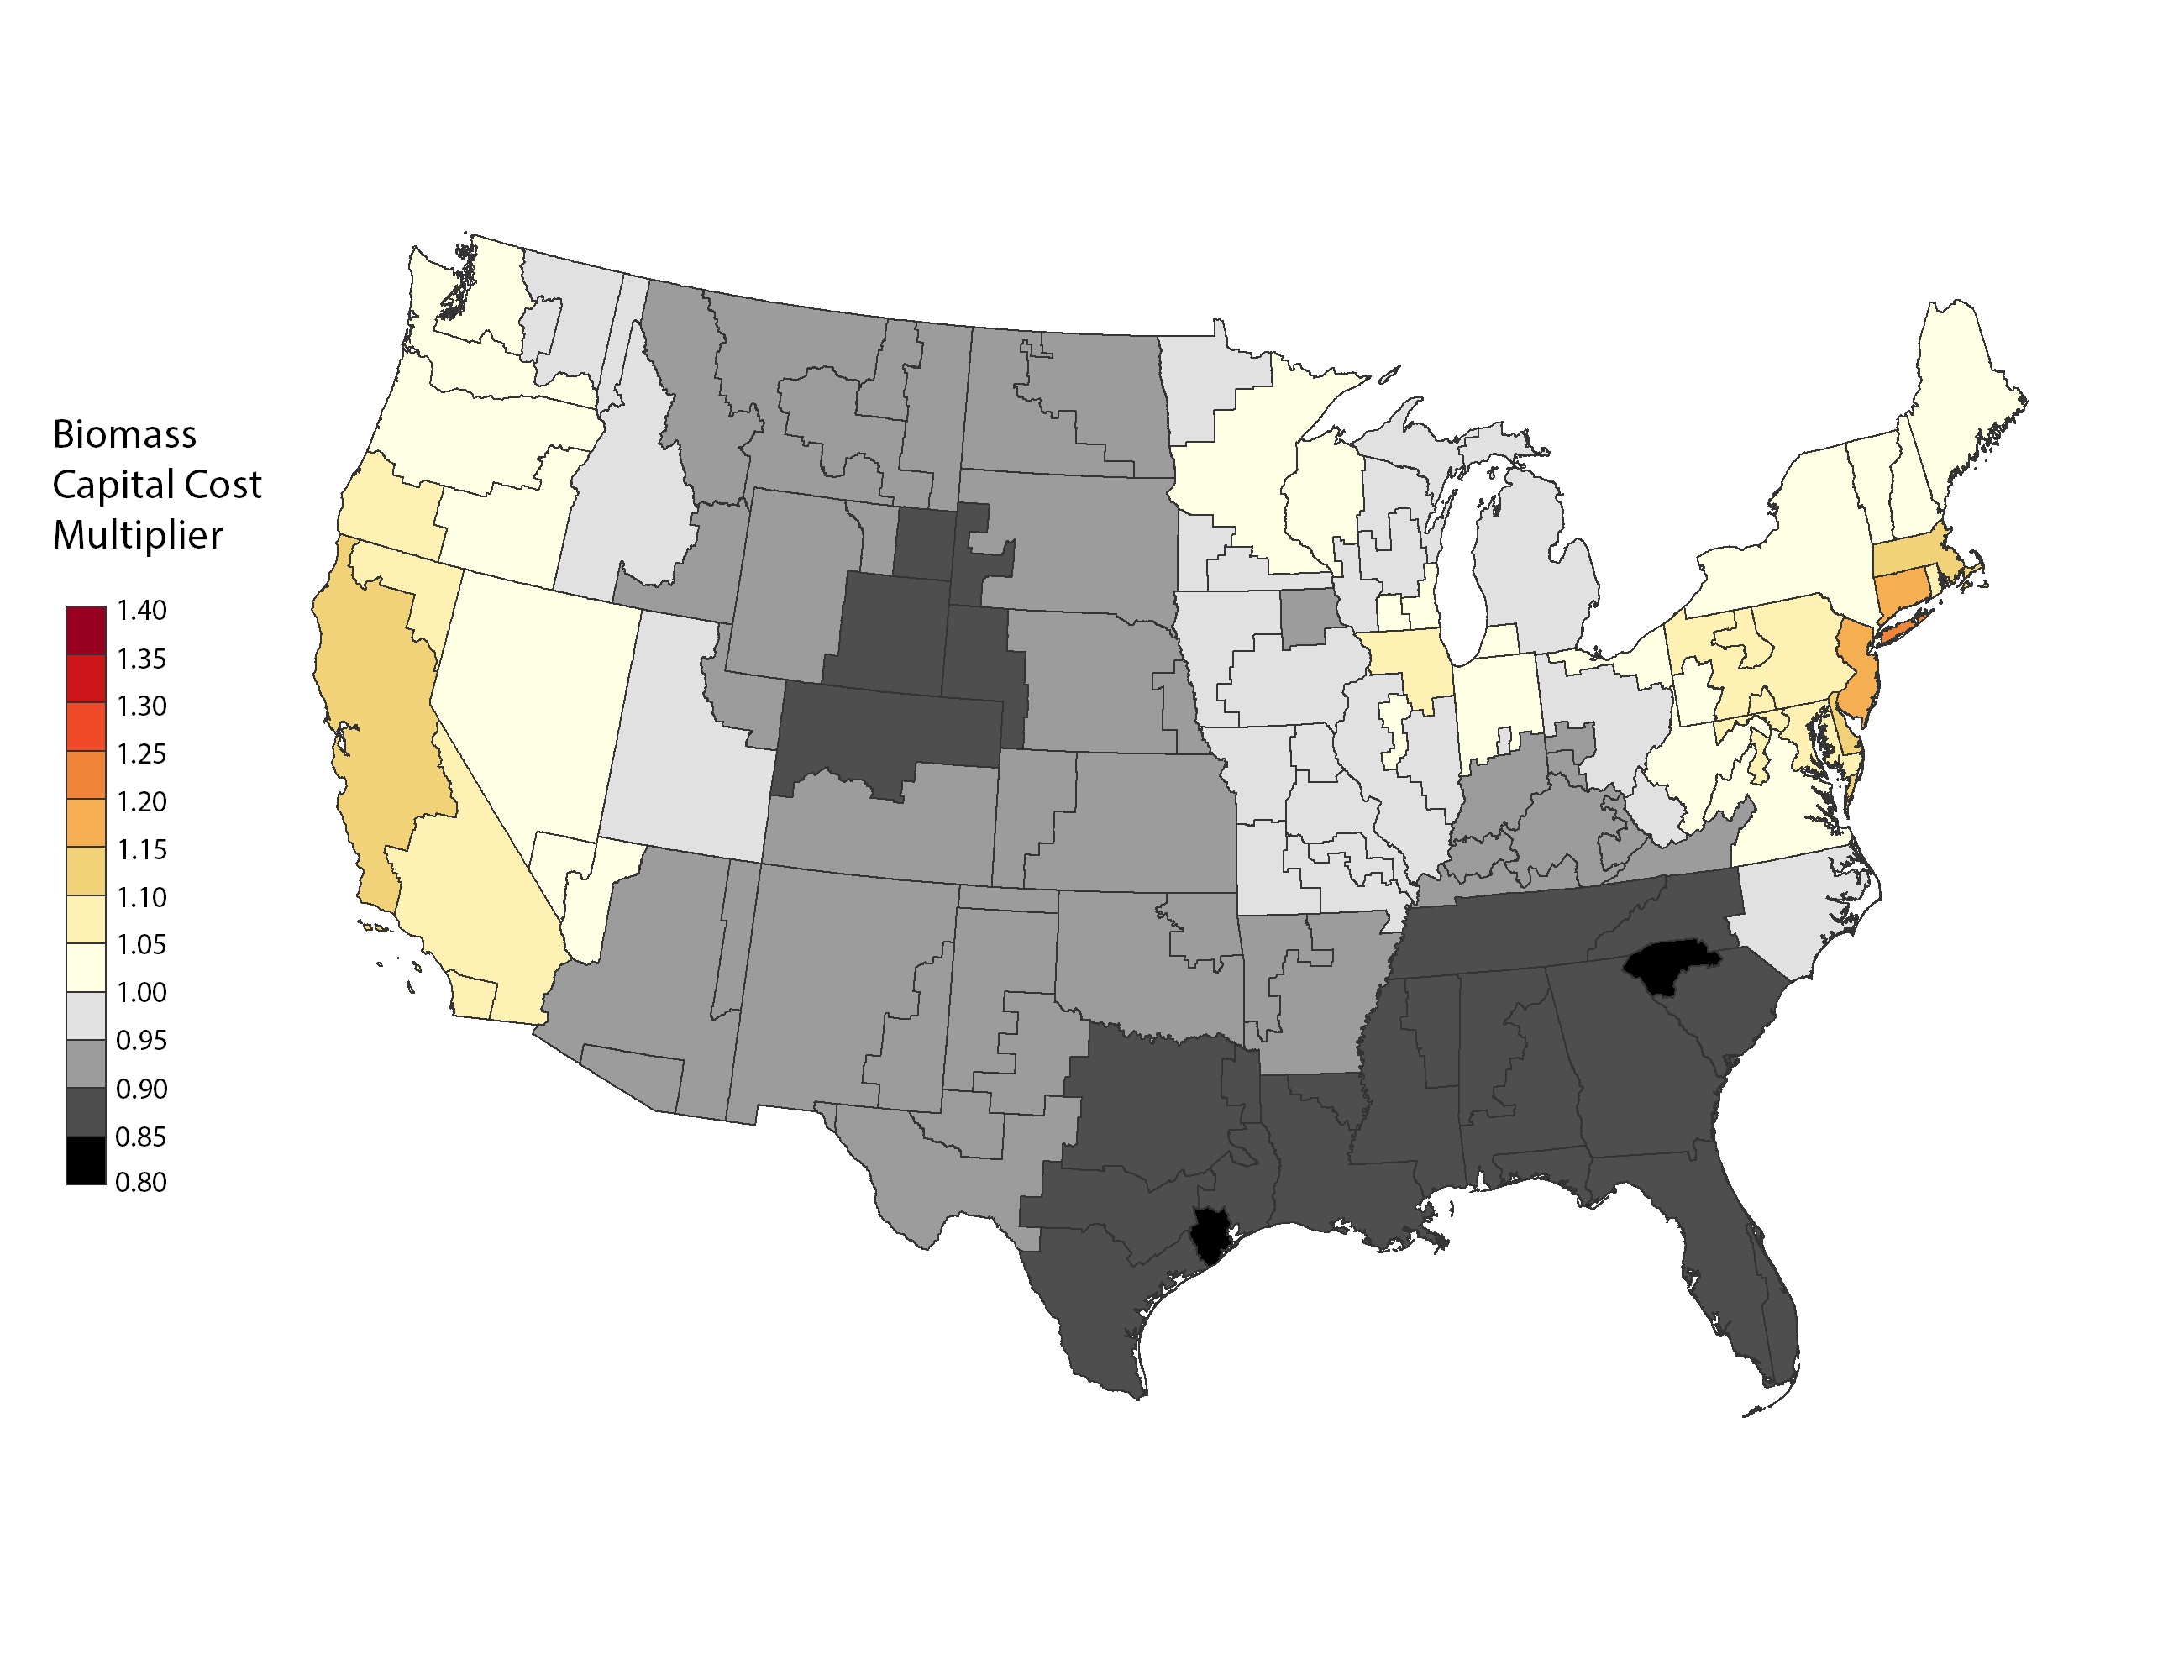
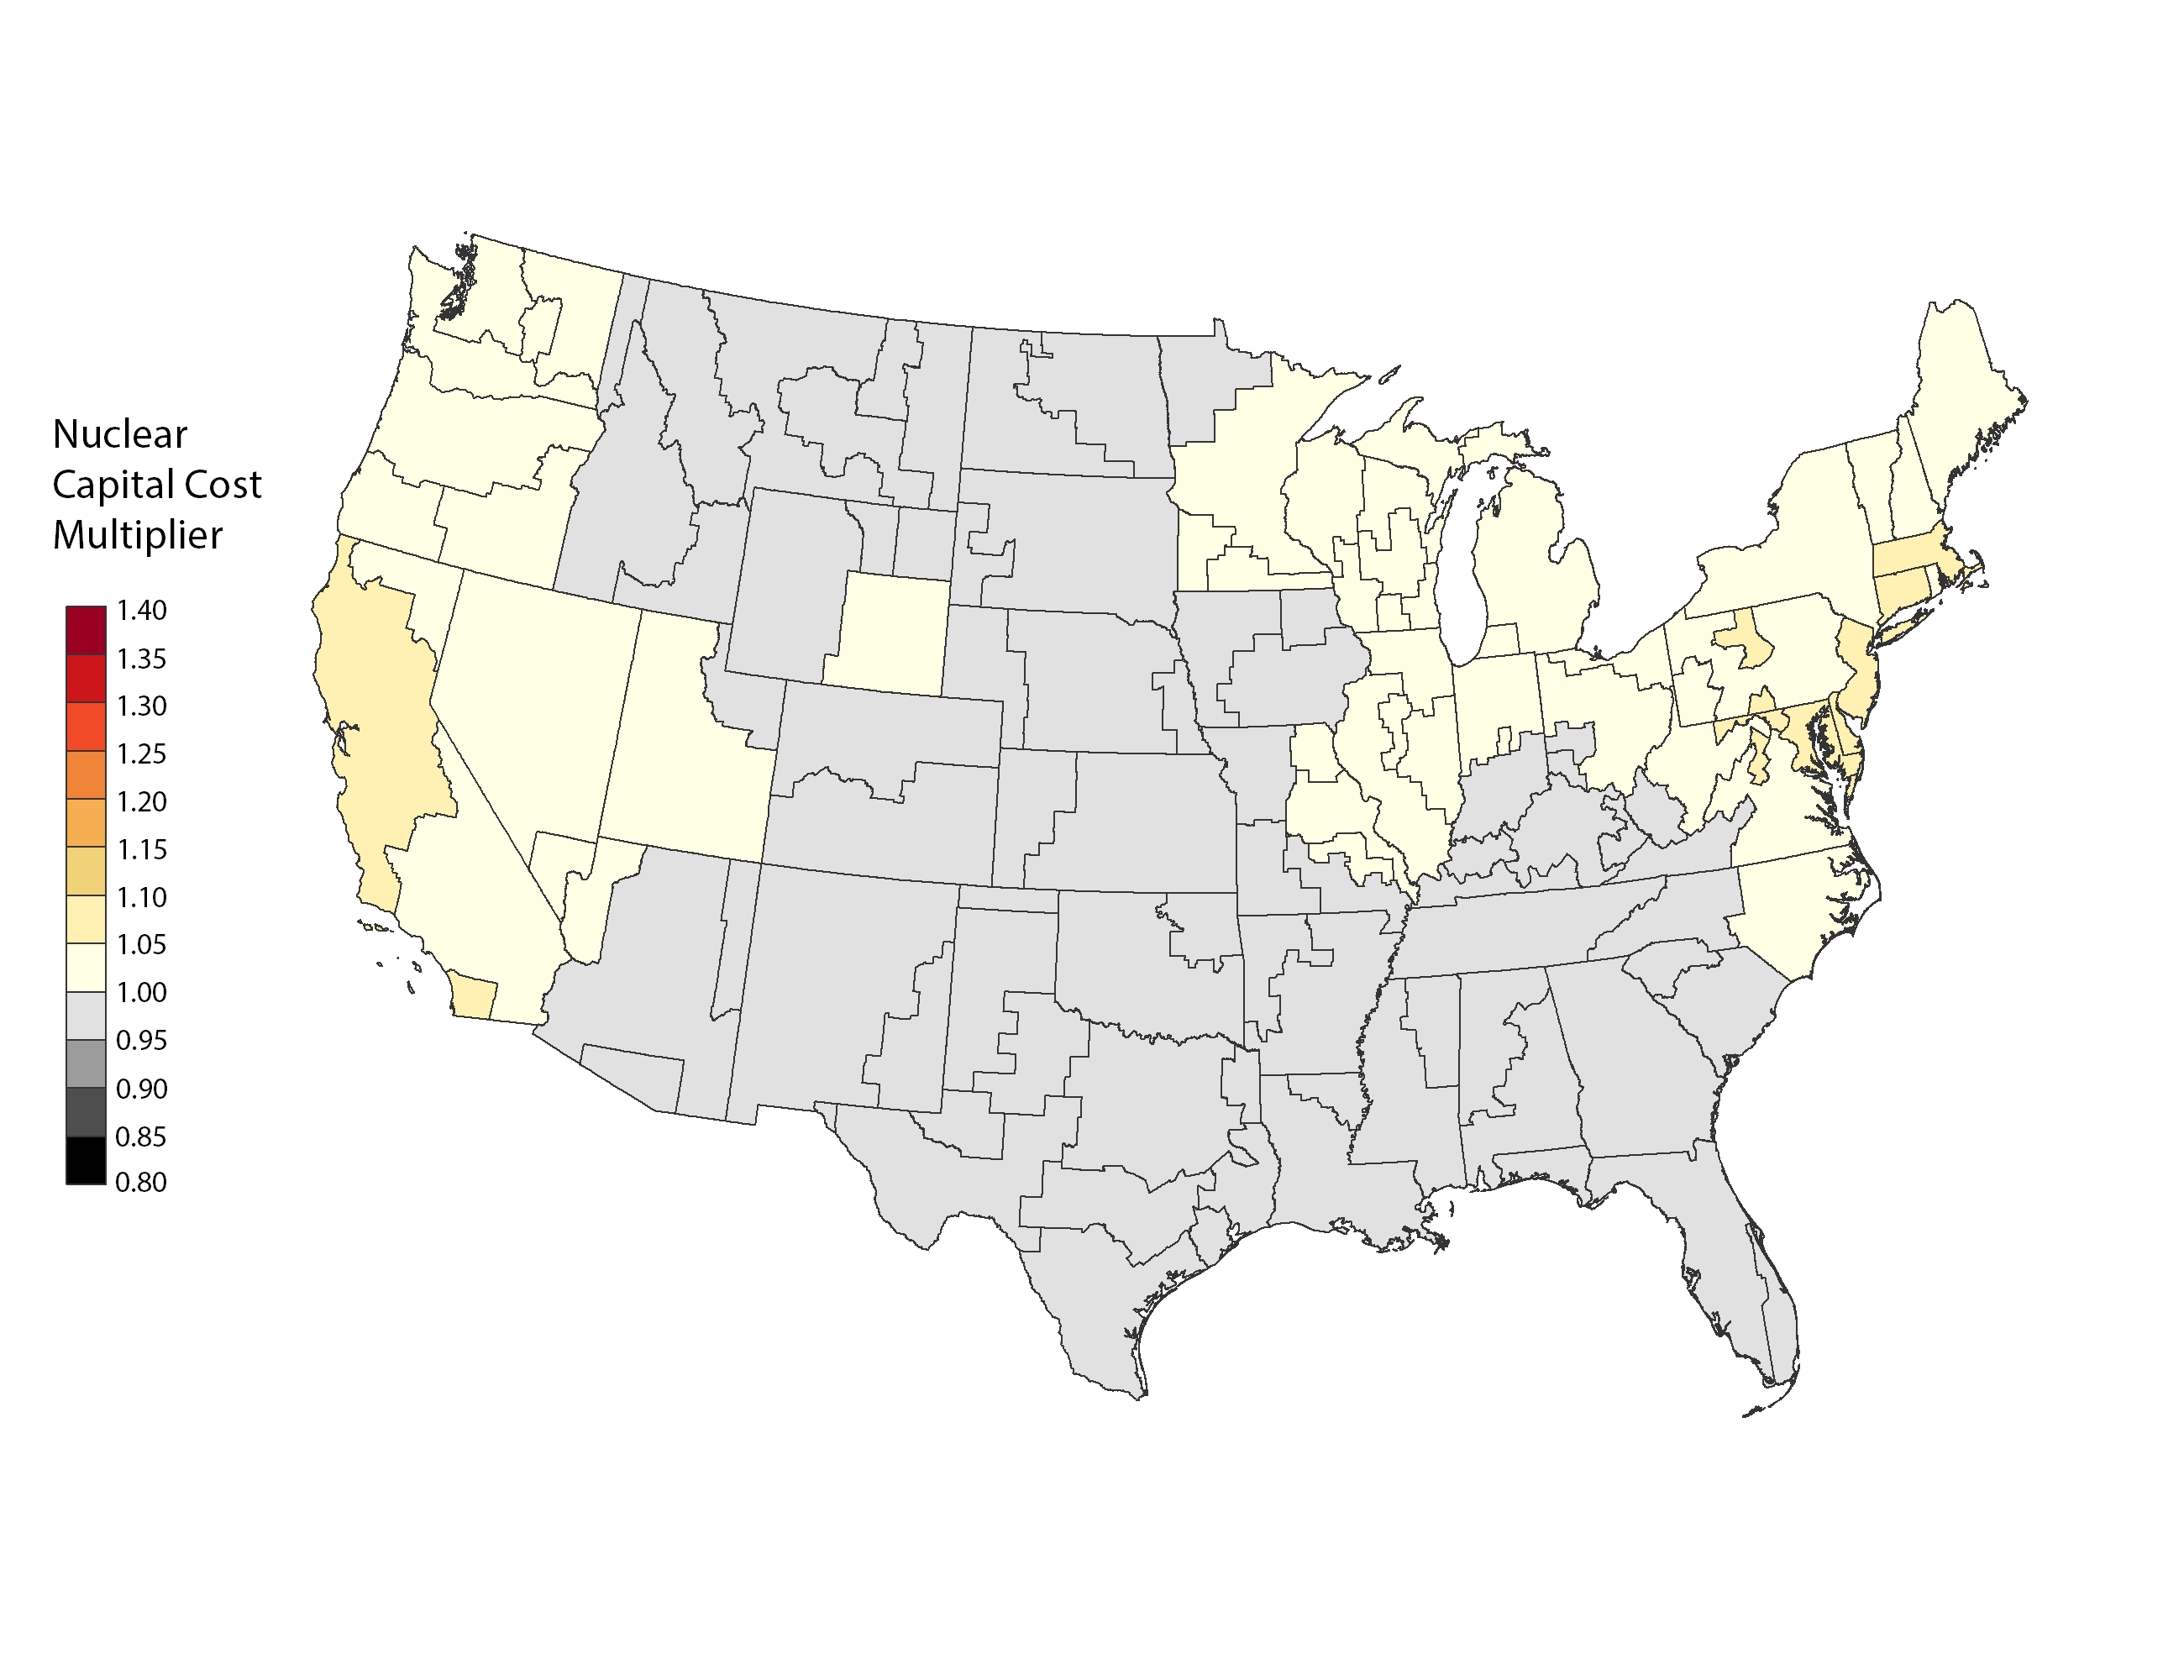
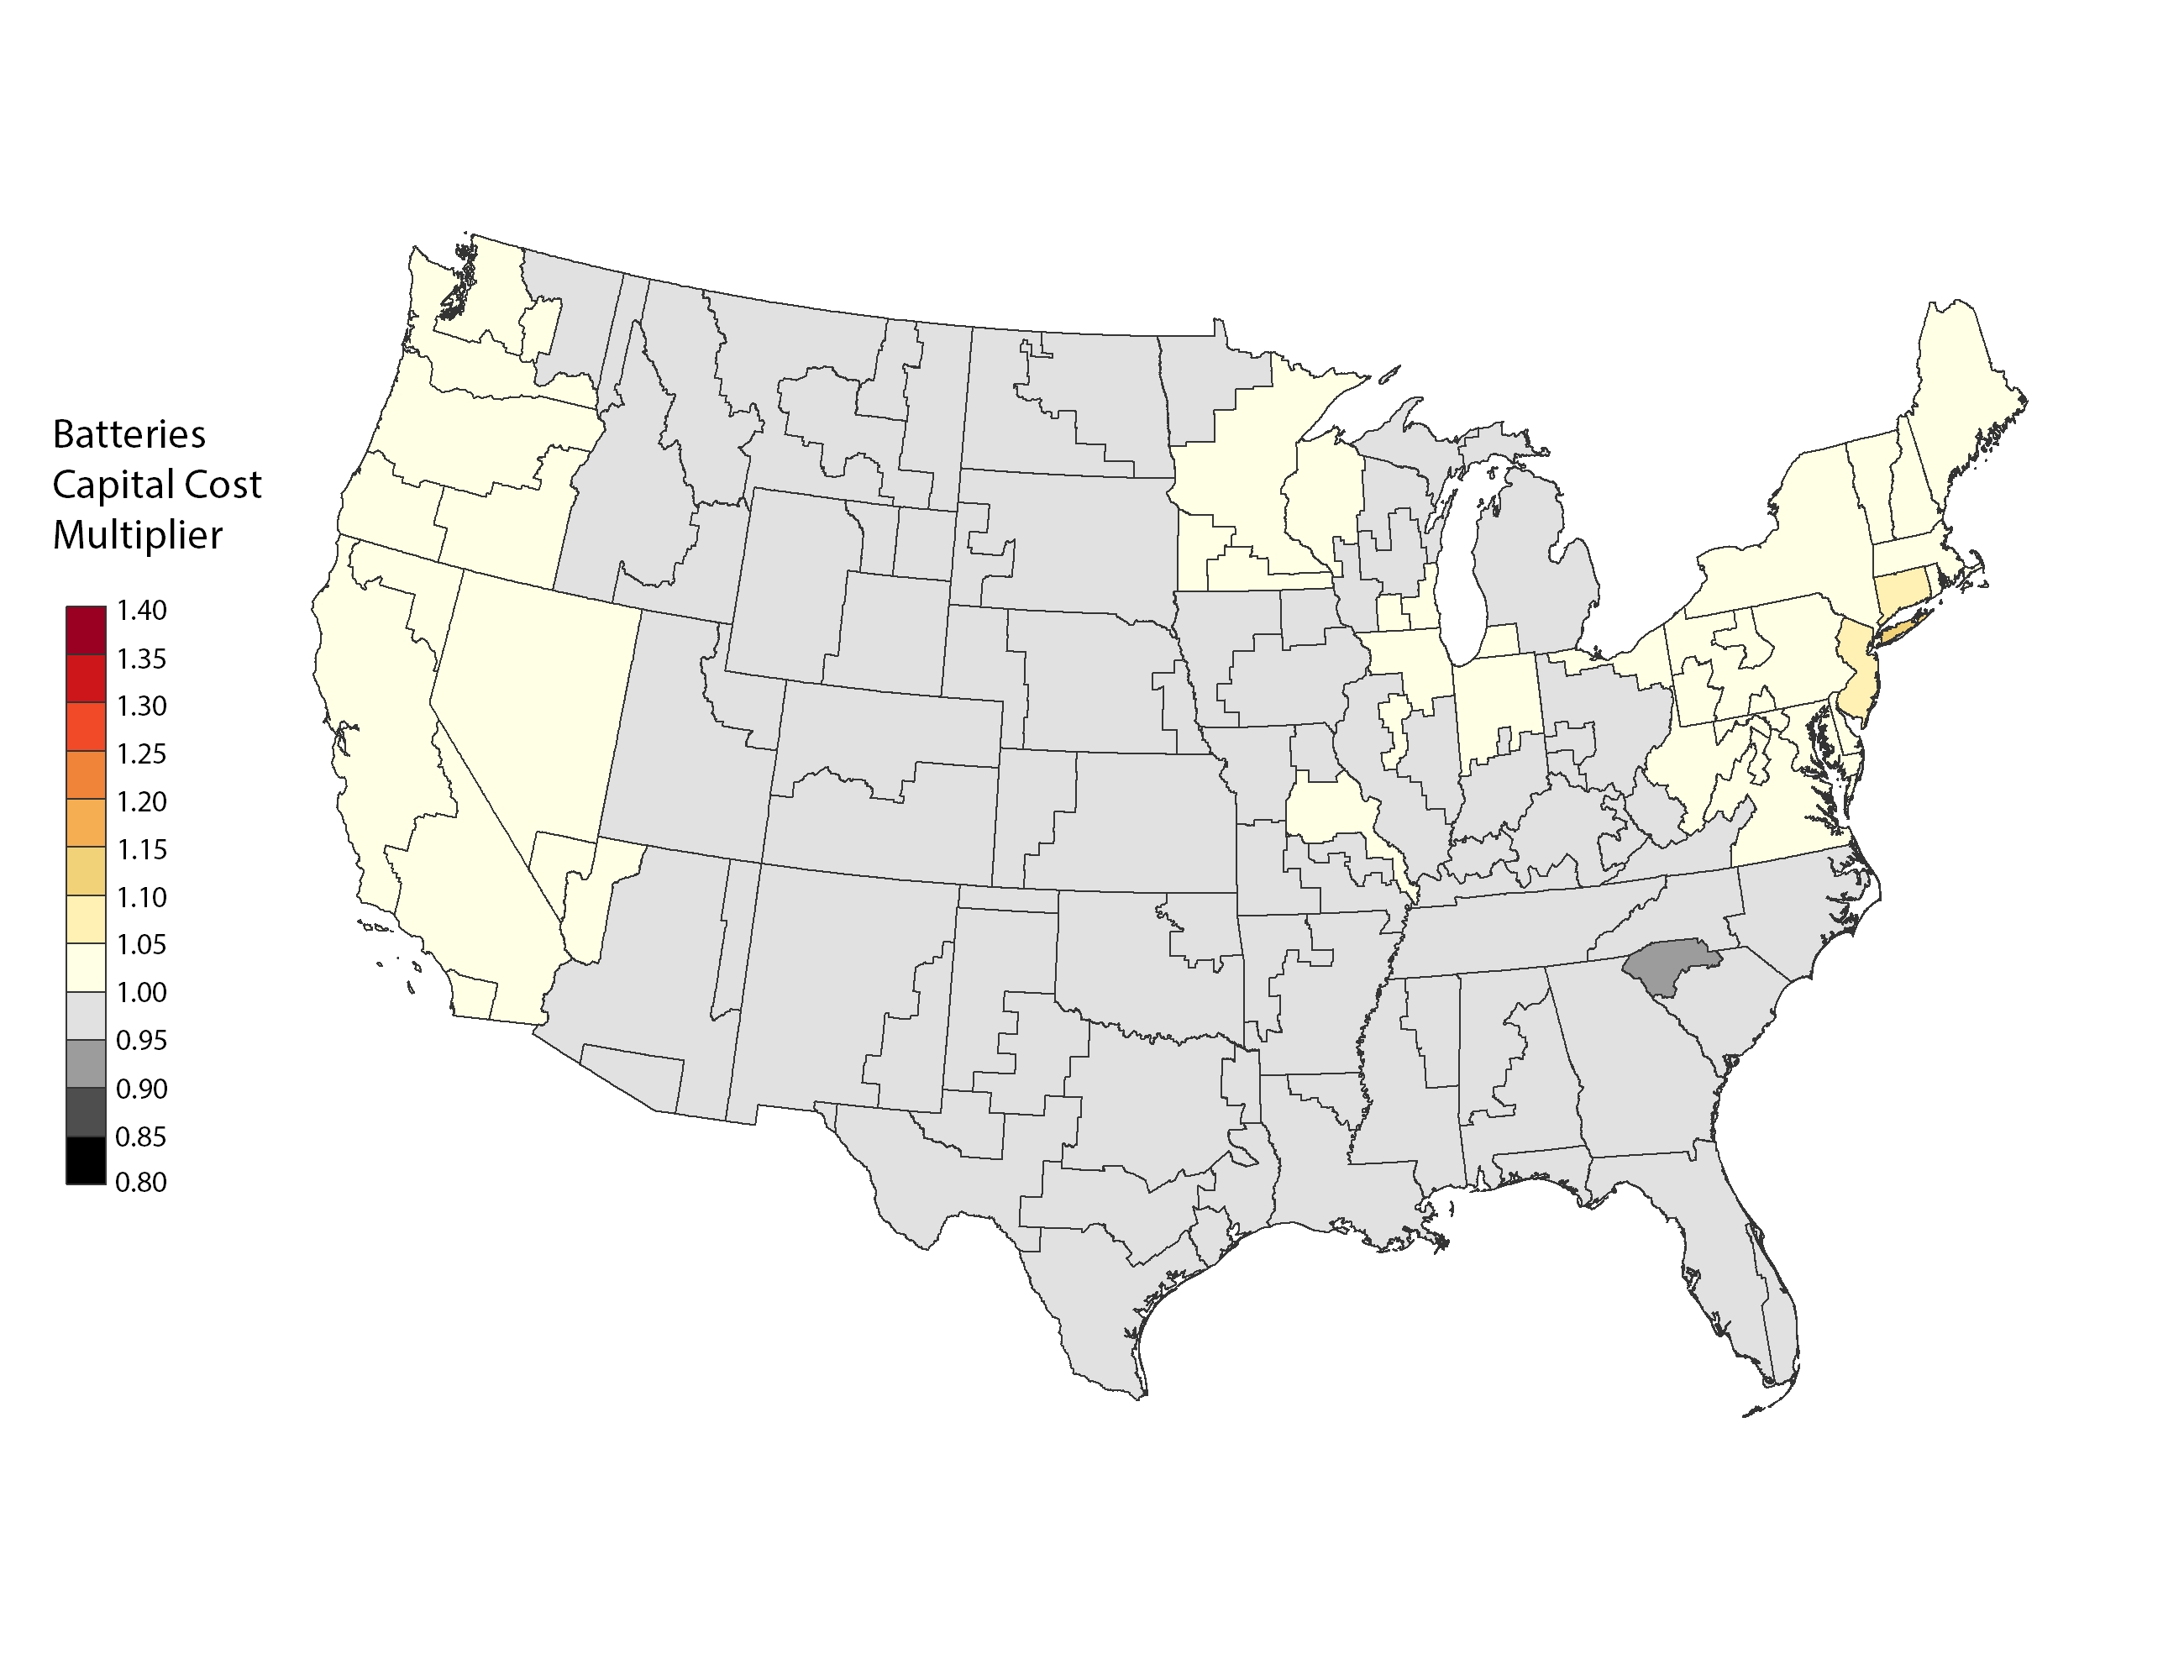
For most generation technologies, regional cost multipliers are applied to reflect variations in installation costs across the United States as described in the ReEDS model documentation and shown with updated data here. These regional multipliers are applied to the overnight capital cost of the associated technology. The regional multipliers are technology-specific and are usually derived from EIA (2016a) that is the source of capital cost assumptions for the NEMS model. While the regional costs presented in EIA (2016a) are based on particular cities, the regional multipliers for ReEDS are calculated by interpolating between these cities and using the average value over the ReEDS regions for each technology. For land-based wind technology an additional multiplier of up to 20% is applied to areas in the northeast based on market data observations (Wiser and Bolinger (2016); DOE (2015)). A similar approach was developed for commercial and residential PV technologies by Fu et al. (2016) and is applied in dSolar. The regional multipliers as implemented in ReEDS and dSolar are shown in the following figure.
References
DOE (U.S. Department of Energy). 2015. Wind Vision: A New Era for Wind Power in the United States. U.S. Department of Energy. DOE/GO-102015-4557. March 2015. http://energy.gov/sites/prod/files/2015/03/f20/wv_full_report.pdf.
EIA (U.S. Energy Information Administration). 2016a. Capital Cost Estimates for Utility Scale Electricity Generating Plants. Washington, D.C.: U.S. Department of Energy. November 2016. https://www.eia.gov/analysis/studies/powerplants/capitalcost/pdf/capcost_assumption.pdf.
Fu, Ran, Donald Chung, Travis Lowder, David Feldman, Kristen Ardani, and Robert Margolis. 2016. U.S. Photovoltaic (PV) Prices and Cost Breakdowns: Q1 2016 Benchmarks for Residential, Commercial, and Utility-Scale Systems. Golden, CO: National Renewable Energy Laboratory. NREL/PR-6A20-67142. September 2016. http://www.nrel.gov/docs/fy16osti/67142.pdf.
Wiser, Ryan, and Mark Bolinger. 2016. 2015 Wind Technologies Market Report. August 2016. https://emp.lbl.gov/sites/default/files/2015-windtechreport.final_.pdf.