Annual Technology Baseline 2018
National Renewable Energy Laboratory
Recommended Citation:
NREL (National Renewable Energy Laboratory). 2018. 2018 Annual Technology Baseline. Golden, CO: National Renewable Energy Laboratory. http://atb.nrel.gov/.
Please consult Guidelines for Using ATB Data:
https://atb.nrel.gov/electricity/user-guidance.html
Offshore Wind
Levelized Cost of Energy (LCOE) Projections
Levelized cost of energy (LCOE) is a simple metric that combines the primary technology cost and performance parameters: CAPEX, O&M, and capacity factor. It is included in the ATB for illustrative purposes. The ATB focuses on defining the primary cost and performance parameters for use in electric sector modeling or other analysis where more sophisticated comparisons among technologies are made. The LCOE accounts for the energy component of electric system planning and operation. The LCOE uses an annual average capacity factor when spreading costs over the anticipated energy generation. This annual capacity factor ignores specific operating behavior such as ramping, start-up, and shutdown that could be relevant for more detailed evaluations of generator cost and value. Electricity generation technologies have different capabilities to provide such services. For example, wind and PV are primarily energy service providers, while the other electricity generation technologies provide capacity and flexibility services in addition to energy. These capacity and flexibility services are difficult to value and depend strongly on the system in which a new generation plant is introduced. These services are represented in electric sector models such as the ReEDS model and corresponding analysis results such as the Standard Scenarios.
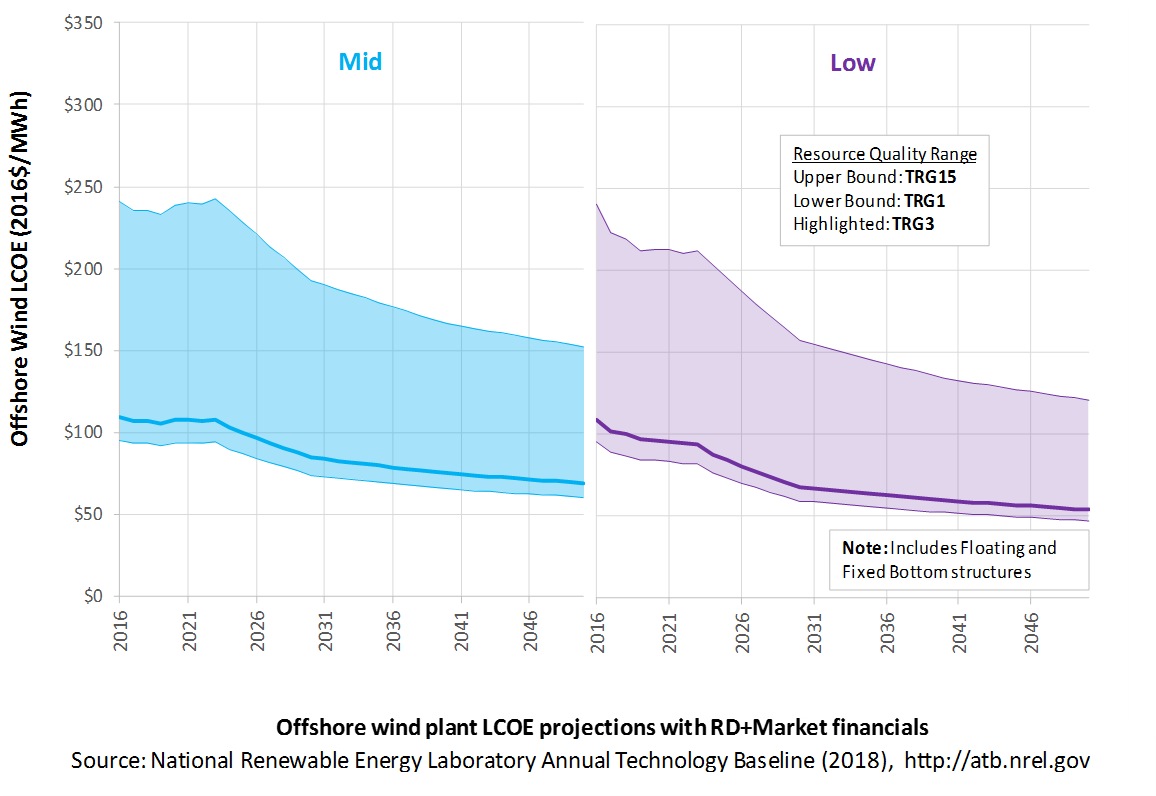
The following three figures illustrate LCOE, which includes the combined impact of CAPEX, O&M, and capacity factor projections for off-shore wind across the range of resources present in the contiguous United States. For the purposes of the ATB, the costs associated with technology and project risk in the U.S. market are represented in the financing costs, not in the upfront capital costs (e.g. developer fees, contingencies). An individual technology may receive more favorable financing terms outside of the U.S., due to less technology and project risk, caused by more project development experience (e.g. offshore wind in Europe), or more government or market guarantees. The R&D Only LCOE sensitivity cases present the range of LCOE based on financial conditions that are held constant over time unless R&D affects them, and they reflect different levels of technology risk. This case excludes effects of tax reform, tax credits, technology-specific tariffs, and changing interest rates over time. The R&D + Market LCOE case adds to these the financial assumptions (1) the changes over time consistent with projections in the Annual Energy Outlook and (2) the effects of tax reform, tax credits, and tariffs. The ATB representative plant characteristics that best align with those of recently installed or anticipated near-term land-based wind plants are associated with TRG 4. Data for all the resource categories can be found in the ATB data spreadsheet.
R&D Only | R&D + Market
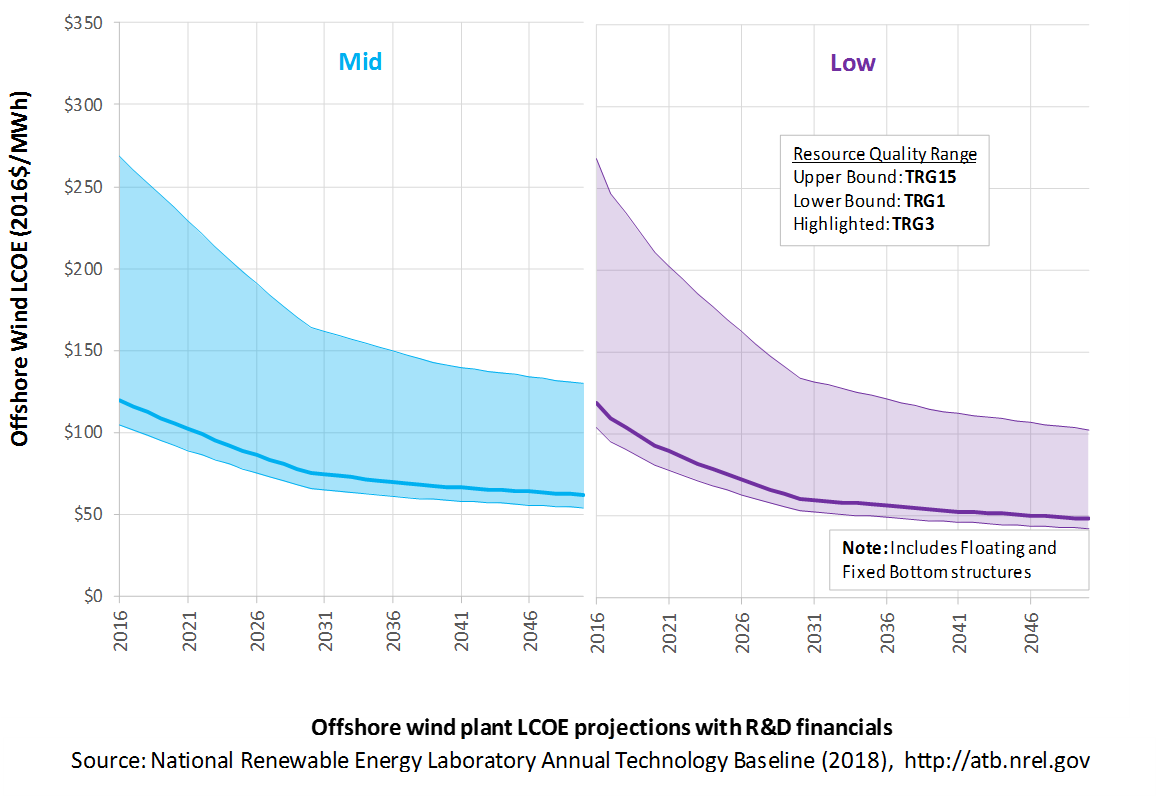
The methodology for representing the CAPEX, O&M, and capacity factor assumptions behind each pathway is discussed in Projections Methodology. In general, the degree of adoption of technology innovation distinguishes the Constant, Mid, and Low technology cost scenarios. These projections represent trends that reduce CAPEX and improve performance. Development of these scenarios involves technology-specific application of the following general definitions:
- Constant Technology = Base Year (or near-term estimates of projects under construction) equivalent through 2050 maintains current relative technology cost differences
- Mid Technology Cost Scenario = technology advances through continued industry growth, public and private R&D investments, and market conditions relative to current levels that may be characterized as "likely" or "not surprising"
- Low Technology Cost Scenario = Technology advances that may occur with breakthroughs, increased public and private R&D investments, and/or other market conditions that lead to cost and performance levels that may be characterized as the " limit of surprise" but not necessarily the absolute low bound.
- To estimate LCOE, assumptions about the cost of capital to finance electricity generation projects are required, and the LCOE calculations are sensitive to these financial assumptions. Three project finance structures are used within the ATB:
- R&D Only Financial Assumptions: This sensitivity case allows technology-specific changes to debt interest rates, return on equity rates, and debt fraction to reflect effects of R&D on technological risk perception, but it holds background rates constant at 2016 values from AEO 2018 and excludes effects of tax reform, tax credits, and tariffs.
- R&D Only + Market Financial Assumptions: This sensitivity case retains the technology-specific changes to debt interest, return on equity rates, and debt fraction from the R&D Only case and adds in the variation over time consistent with AEO 2018, as well as effects of tax reform, tax credits, and technology-specific tariffs. For a detailed discussion of these assumptions, see Changes from 2017 ATB to 2018 ATB.
- ReEDS Financial Assumptions: ReEDS uses the R&D Only + Market Financial Assumptions for the "Mid" technology cost scenario.
- A constant cost recovery period -over which the initial capital investment is recovered-is assumed for all technologies throughout this website, and can be varied in the ATB data spreadsheet.
- The equations and variables used to estimate LCOE are defined on the equations and variables page. For illustration of the impact of changing financial structures such as WACC, see Project Finance Impact on LCOE. For LCOE estimates for the Constant, Mid, and Low technology cost scenarios for all technologies, see 2018 ATB Cost and Performance Summary.
- In general, differences among the technology cost cases reflect different levels of adoption of innovations. Reductions in technology costs reflect the cost reduction opportunities that are listed below.
- Continued turbine scaling to larger-megawatt turbines with larger rotors such that swept area/megawatt capacity decreases resulting in higher capacity factors for a given location
- Greater market competition in the production of primary components (e.g., turbines, support structure), and installation services
- Economy-of-scale and productivity improvements in manufacturing, including mass production of substructure component and optimized installation strategies
- Improved plant siting and operation to reduce plant-level energy losses, resulting in higher capacity factors
- More efficient O&M procedures combined with more reliable components to reduce annual average FOM costs
- Adoption of a wide range of innovative control, design, and material concepts that facilitate the high-level trends described above.
References
EIA (U.S. Energy Information Administration). 2018. Annual Energy Outlook 2018 with Projections to 2050. Washington, D.C.: U.S. Department of Energy. February 6, 2018. https://www.eia.gov/outlooks/aeo/pdf/AEO2018.pdf.