
Project Finance Impact on LCOE
Levelized cost of energy (LCOE) is a summary metric that combines the primary technology cost and performance parameters: CAPEX, O&M, and CF. It is included in the ATB for illustrative purposes. The ATB focuses on defining the primary cost and performance parameters for use in electric sector modeling or other analysis where more sophisticated comparisons among technologies are made. The LCOE accounts for the energy component of electric system planning and operation. The LCOE uses an annual average capacity factor when spreading costs over the anticipated energy generation. This annual capacity factor ignores specific operating behavior such as ramping, start-up, and shutdown that could be relevant for more detailed evaluations of generator cost and value. Electricity generation technologies have different capabilities to provide such services. For example, wind and PV are primarily energy service providers while the other electricity generation technologies can provide capacity and flexibility services in addition to energy. These capacity and flexibility services are difficult to value and depend strongly on the system in which a new generation plant is introduced. These services are represented in electric sector models such as the ReEDS model and corresponding analysis results such as the Standard Scenarios.
To estimate LCOE, assumptions about the cost of capital to finance electricity generation projects and the period over which that investment is recovered are required. The sensitivity of LCOE to these values is shown below. The equations and variables used to estimate LCOE are defined on the Equations and Variables page. For LCOE estimates for the Constant, Mid, and Low technology cost scenarios for all technologies, see 2019 ATB Cost and Performance Summary.
Explanation of Project Finance Parameters
In the 2019 ATB, two options for representing assumptions for project finance are available:
- R&D Only Financial Assumptions:This sensitivity case allows technology-specific changes to debt interest rates, return on equity rates, and debt fraction to reflect effects of R&D on technological risk perception, but it holds background rates constant at 2017 values from AEO2019 (EIA, 2019) and excludes effects of tax reform and tax credits. The development of this financial sensitivity case reflects that we are trying to differentiate risk across technologies through differentiated financing terms. Although we recognize that in practice these risks may be reflected in CAPEX, in soft costs, or elsewhere (e.g., through a contingency fund), we decided that reflecting risk in the financing terms is clearest and most consistent. The ATB assumptions primarily reflect technology risk within the U.S. market, with some consideration of international development. An individual technology may receive more favorable financing terms outside of the United States, due to less technology and project risk as a result of more project development experience (e.g., offshore wind in Europe) or more government or market guarantees. This sensitivity case allows technology-specific changes to debt interest rates, return on equity rates, and debt fraction to reflect effects of R&D on technological risk perception, but it holds background rates constant at 2017 values from AEO2019 (EIA, 2019) and excludes effects of tax reform and tax credits.
- R&D Only + Market Financial Assumptions: This sensitivity case retains the technology-specific changes to debt interest, return on equity rates, and debt fraction from the R&D Only case and adds in the variation over time consistent with AEO2019 (EIA, 2019) as well as effects of tax reform and tax credits.
A constant cost recovery period-over which the initial capital investment is recovered-of 30 years is assumed for all technologies throughout this website, and it can be varied in the ATB data spreadsheet. The default financing options for the associated Standard Scenarios using the ReEDS model use the R&D Only + Market financial assumptions with a 20-year cost recovery period.
This approach to financial assumptions includes technology-specific financial assumptions to capture more granularity of current and future energy markets, as well as to show cost reduction potential through improvements in financing rates attributable to technological risk reduction from R&D. Multiple financing options are currently available in the marketplace, with varying associated costs; the availability of these options will likely grow as technologies become more mature. Additionally, many macroeconomic factors may influence financing rates in the future, independent of the method by which a project is financed or the underlying changes in characteristics of a technology; these factors include the underlying inflation rate as well as the cost of the Federal Reserve interest rate. For these reasons, we assume the same inflation rate, tax rate (changing in 2018 to reflect the new federal corporate tax rate in the R&D + Market case), and in many instances, interest rate across technologies.
To create a consistent financial landscape across technologies, we have also binned technologies by their general maturity within the U.S. market, as well as any unique characteristics that they may have in raising funds. We have given some technologies the same financing assumptions despite certain differences in the marketplace today that are caused by resource variability, capacity factor, credit quality and ease of funding, as well as market size. However, given the variety of reported financing costs currently available in the marketplace, we feel it is justified, as their reported financing costs overlap quite a bit.
For the reasons described above, land-based wind and distributed and utility PV are viewed as relatively mature technologies and have the same return on equity and debt interest as the financing costs for other mature technologies as outlined in AEO2019 (EIA, 2019). To acknowledge the possibility for improved financing terms for wind and PV technologies beyond those currently achieved by mature technologies such as natural gas and coal; to capture this, we increase the assumed debt fraction from 60% in 2017 (under the R&D Only Financial Assumptions) to 65% in the Mid and 70% in the Low cost scenario in 2030, which is when we assume these technologies will be viewed as fully mature. (Under the R&D + Market Financial Assumptions, the ATB assumes that the debt fraction is reduced to 40% in years in which technologies receive tax credits due to tax credits' impact on financial transactions.)
These debt fractions are consistent with land-based wind and PV values calculated in Bolinger(2014) and Feldman and Bolinger(2016); we assume higher financing rates for concentrating solar power (CSP), offshore wind, and geothermal generation plants. U.S. CSP currently has lower levels of deployment, historically has relied on governmental involvement with financing, and recently has had project start-up challenges. While offshore wind deployment is mature in Europe, only one plant has been installed in the United States to date. Several projects are currently under development; however, because of previous project cancellations and delays, there is still more project risk in offshore wind than in land-based wind. Geothermal plants incur higher financing costs that are due to exploration and well field development risk in early project stages. For these reasons, we assume that in 2017 CSP and offshore wind projects have equity rate premiums relative to PV and wind, of 4%. CSP also has a lower debt fraction of 50% (under the R&D Only Financial Assumptions). Geothermal incurs higher financing costs through a 6% premium over onshore wind and PV nominal WACC. These values are similar to premiums and leverage as calculated by DOE technology program analysts. However, in the Low and Mid costs scenarios for CSP and offshore wind, and in the Low cost scenario for geothermal plants, these technologies become financially mature by 2030 and have financing costs comparable to land-based wind and PV generating assets.
We assume hydropower plants are financed through 100% bond financing, similarly to how they have been financed in the past. For consistency, the interest rate of these bonds is the same as the interest rates for other mature technologies.
Financing assumptions for natural gas, nuclear, and biopower plants are all based on the assumptions from AEO2019 (EIA, 2019); the weighted-average cost of capital (WACC) for coal plants is three percentage points higher.
The following table summarizes the rationale behind the differentiated financial assumptions across the technologies.
| Technology | Financial Assumptions (2017) | Financial Assumptions (2030-2050) | Difference Relative to Mature Technology Financing | Rationale |
| Land-Based Wind | Mature | Low (lowest-risk mature); Mid (lower-risk mature); Constant (mature) | From 2017 to 2030 debt fraction increases from 60% (R&D case)* to 65% in mid-case and 70% in Low case. | R&D achievements and further deployment could make RE less risky than traditional generating assets (e.g., fewer moving parts, no fuel risk, fewer environmental concerns). |
| Offshore Wind | Mature but elevated risk | Low (lowest-risk mature); Mid (lower-risk mature); Constant (elevated risk) | From 2017 to 2030, premium on equity rate of return for low- and mid-case declines from 4 to 0 percentage points. Premium on equity rate of return for Constant case is a constant 4%. Debt fraction same as land-based wind. | There is still more project risk in offshore wind than in land-based wind due to the minimal U.S. installations and a relatively high cancellation rate to-date. |
| Utility-Scale PV | Mature | Low (lowest-risk mature); Mid (lower-risk mature); Constant (mature) | Debt fraction same as land-based wind. | |
| Commercial PV | Mature | Low (lowest-risk mature); Mid (lower-risk mature); Constant (mature) | Debt fraction same as land-based wind. | |
| Residential PV | Mature | Low (lowest-risk mature); Mid (lower-risk mature); High (mature) | Debt fraction same as land-based wind. | |
| Concentrating Solar Power | Mature but elevated risk | Low (lowest-risk mature); Mid (lower-risk mature); Constant (elevated risk) | From 2017 to 2030, premium on equity rate of return for low- and mid-case declines from 4 to 0 percentage points. Premium on equity rate of return for Constant case is a constant 4%. From 2017 to 2030 debt fraction increases from 50% (R&D case)* to 65% in mid-case and 70% in Low case. Constant case remains at 50%. | CSP currently has lower levels of deployment, has historically relied on governmental involvement with financing, and has had recent project start-up challenges. Mature technology (U.S. and globally), but with marginally elevated risk for the U.S. due to a lack of current deployments. |
| Geothermal | Mature but elevated risk | Low (lowest-risk mature); Mid (mature but elevated risk); Constant (elevated risk) | Premium on WACC for mid- and high-case is a constant 6%. From 2017 to 2030, premium on WACC for Low case declines from 6 to 0 percentage points. | There is exploration and well field development risk in early project stages. In the low case, exploration technology improvements and the use of EGS techniques eliminates most of the exploration and well field development risk. |
| Hydropower | Infrastructure | Infrastructure | 100% bond financing | Many hydropower plants have been financed in this manner in the past. |
| Natural Gas | Mature | Mature | ||
| Coal | Mature / elevated risk | Mature / elevated risk | 3 percentage point premium on WACC applied to conventional coal in market case | Regulatory risk |
| Nuclear | Mature | Mature | ||
| Biopower | Mature | Mature |
Sensitivity to Financial Assumptions
The following figure illustrates the sensitivity of Base Year LCOE values to these financial assumptions.
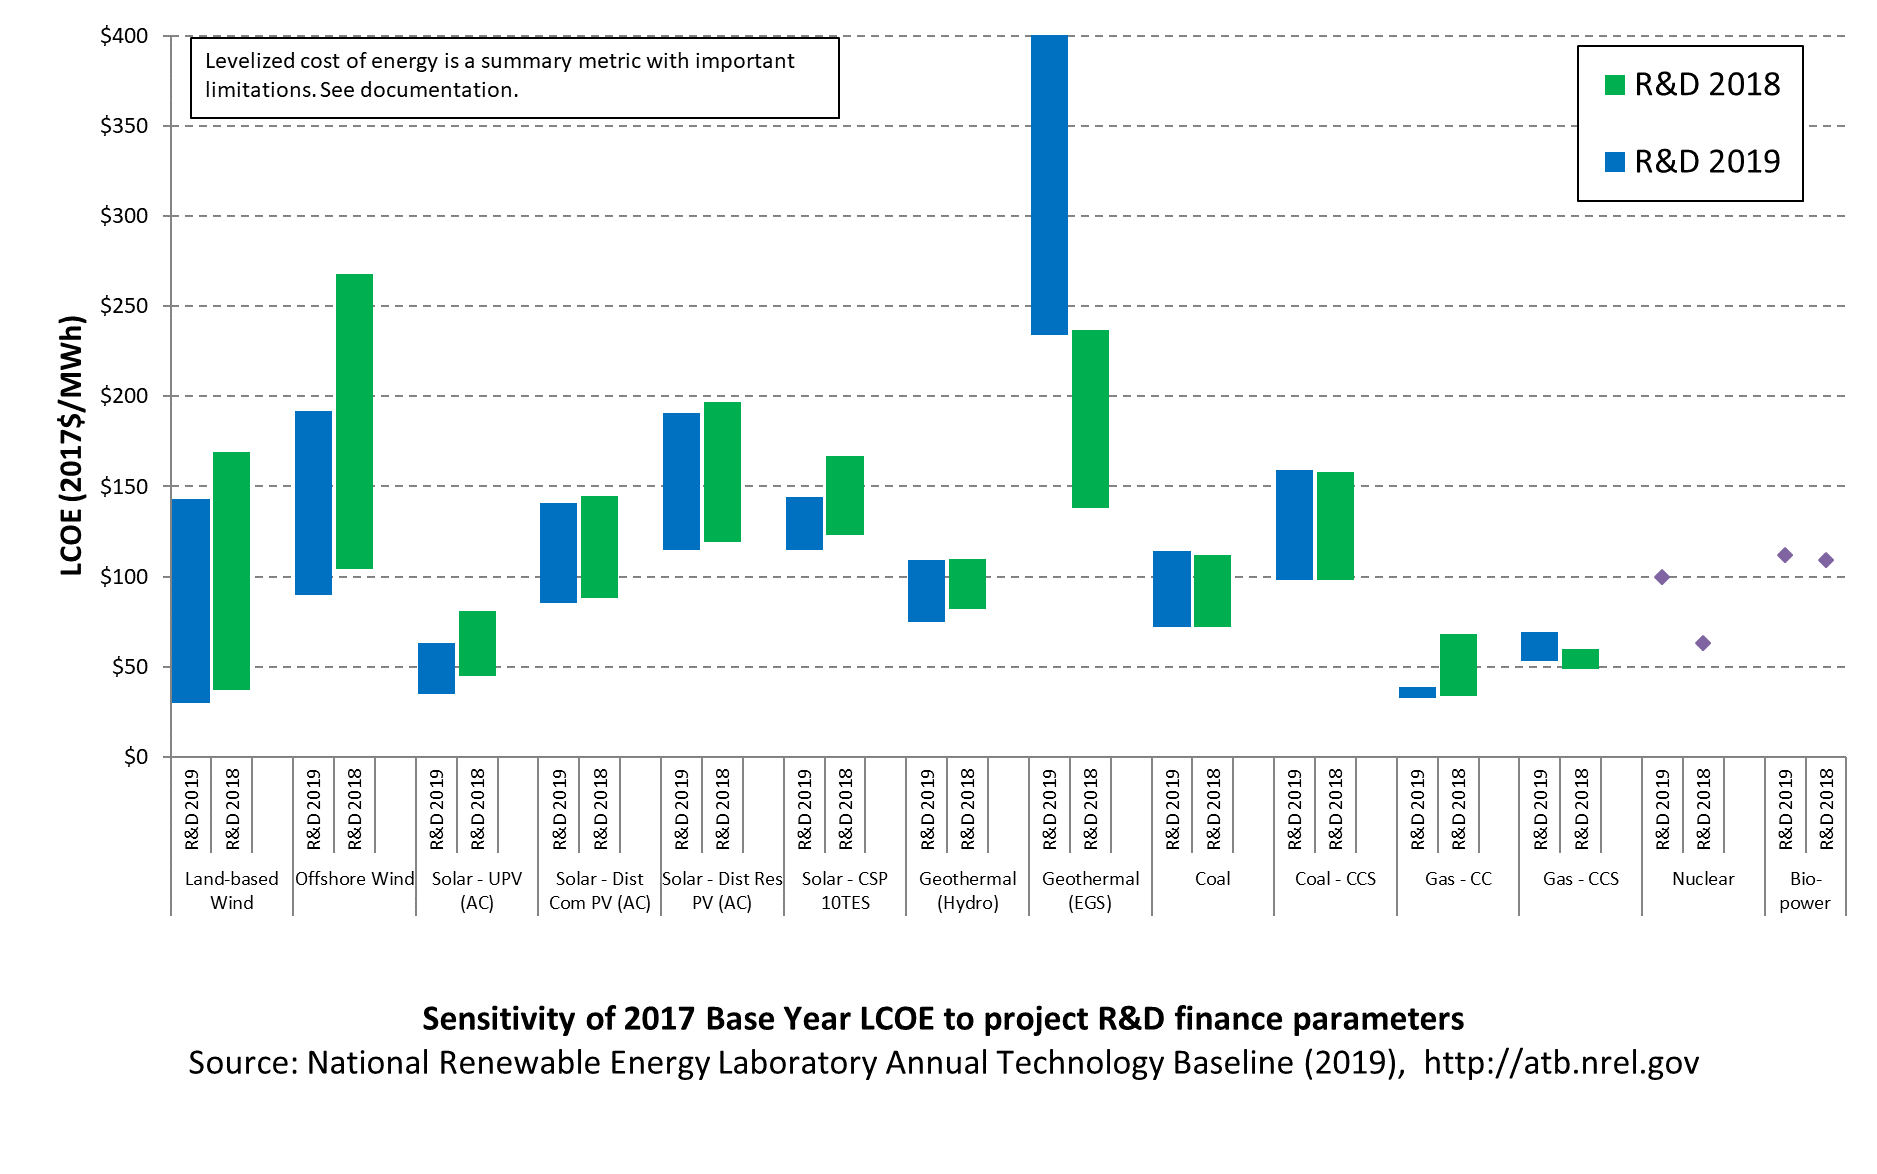
The range of LCOE for renewable technologies reflects the range of available resource conditions. The range of LCOE for coal and natural gas plants reflects the two capacity factor values implemented in the ATB.
The previous figure is intended to illustrate the impact that financial assumptions have on LCOE estimates. It is not intended to predict future market conditions.
Sensitivity to Cost Recovery Period
An important assumption for computing LCOE is the period over which the electricity generation plant cost and performance are levelized. In the ATB, this period is defined as the cost recovery period, and it represents the period over which the initial capital investment to build a plant is recovered.
The following figure illustrates the sensitivity of Base Year LCOE values to changes in the cost recovery period, showing cost recovery periods of 20 years, 30 years, and cost recovery period equal to technological life for all technologies. The two fixed cost recovery periods reflect the perspective of a hypothetical investor that evaluates each technology investment over a common capital recovery time horizon independent of the technology. The case where cost recovery period equals technological life is not consistent with this investor perspective and is provided as an approximate indicator of residual value.
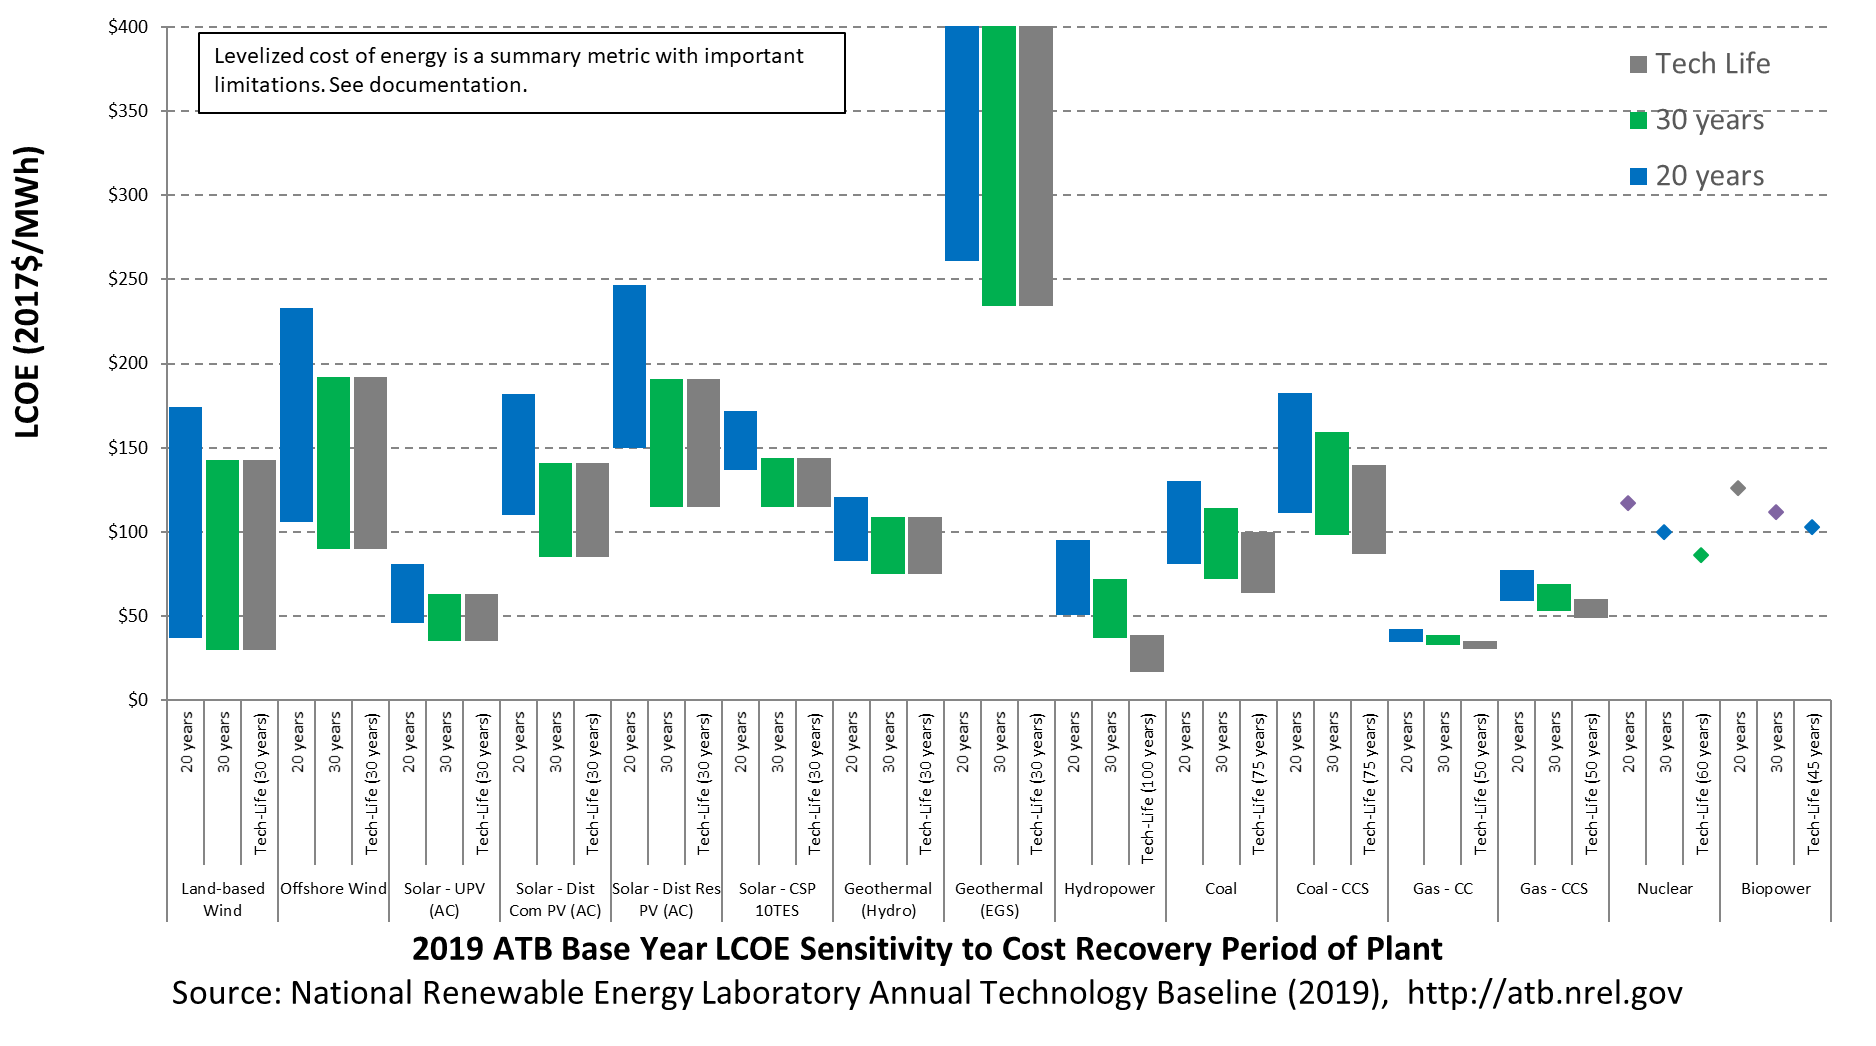
The technical life for each technology is shown in the following table. A technical life that is longer than the cost recovery period means there may be residual value left after costs have been recovered. The technical life values in the table are updated from those previously implemented in the ReEDS model and reflected in prior versions of ATB and Standard Scenarios model results to reflect a 30-year life for wind technologies consistent with current industry trends.
| Technology | Technical Life (years) |
| Land-based wind | 30 |
| Offshore wind | 30 |
| Solar-utility PV | 30 |
| Solar-distributed commercial PV | 30 |
| Solar-distributed residential PV | 30 |
| Solar-CSP | 30 |
| Geothermal | 30 |
| Hydropower | 100 |
| Coal | 75 |
| Gas - CC | 55 |
| Gas - CCS | 55 |
| Nuclear | 60 |
| Biopower | 45 |
Assumptions about the residual value of the plant over time, major component replacement or repair time schedules, and contractual or regulatory renewal schedules (e.g., licenses or leases) would affect the period over which a plant may operate. In general, cost recovery period will be less than or equal to technical life so that capital investments are recovered before the plant is no longer technically viable.
References
The following references are specific to this page; for all references in this ATB, see References.Bolinger, M. (2014). An Analysis of the Costs, Benefits, and Implications of Different Approaches to Capturing the Value of Renewable Energy Tax Incentives (No. LBNL-6610E). Retrieved from Lawrence Berkeley National Laboratory website: https://emp.lbl.gov/sites/all/files/lbnl-6610e.pdf
EIA. (2019a). Annual Energy Outlook 2019 with Projections to 2050. Retrieved from U.S. Energy Information Administration website: https://www.eia.gov/outlooks/aeo/pdf/AEO2019.pdf
Feldman, D., & Bolinger, M. (2016). On the Path to SunShot: Emerging Opportunities and Challenges in Financing Solar (No. NREL/TP-6A20-65638). Retrieved from National Renewable Energy Laboratory website: http://www.nrel.gov/docs/fy16osti/65638.pdf