
2019 ATB Cost and Performance Summary
The table and figures below summarize current (2017) and projected (2030, 2050) technology cost and performance from the 2019 ATB data spreadsheet by generation technology and year, including CF (capacity factor) range, CAPEX (capital expenditure) range, fuel cost, O&M (operations and maintenance) cost (fixed and variable), and calculated levelized cost of energy (LCOE) range.
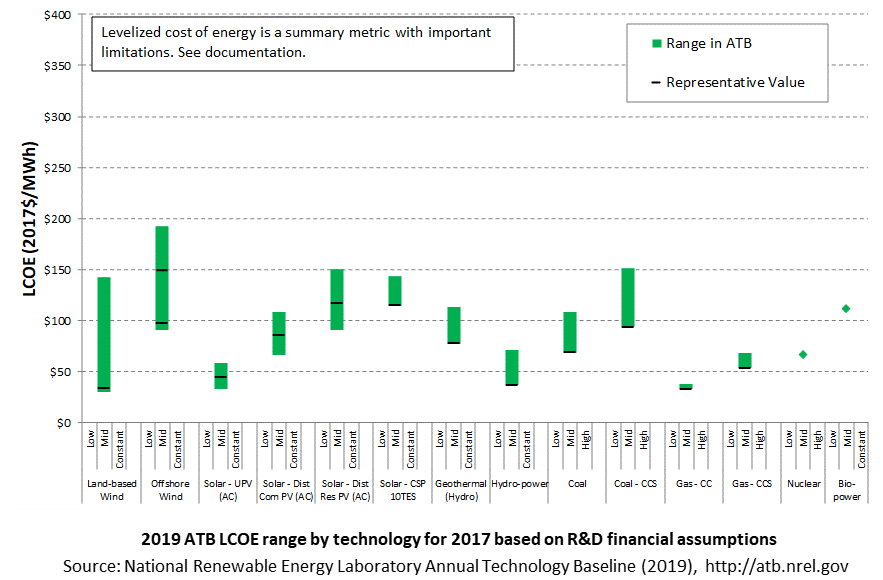
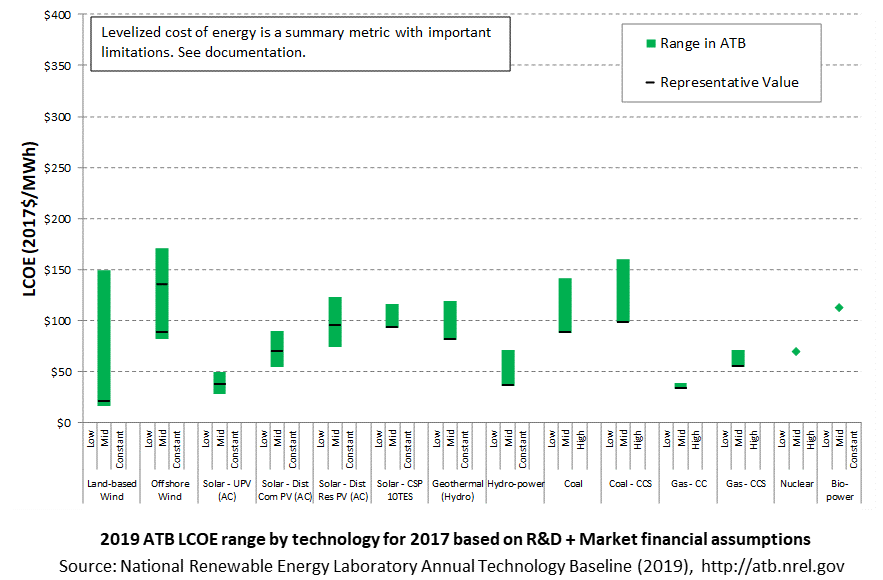
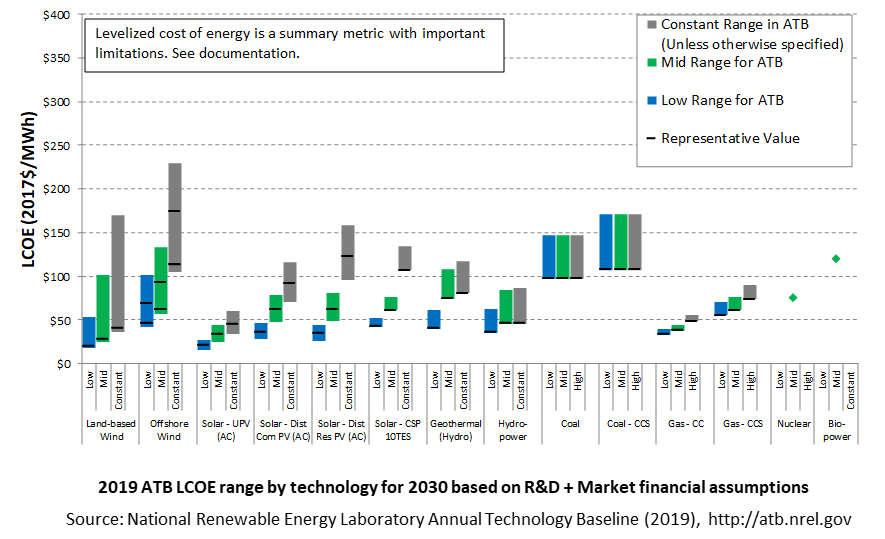
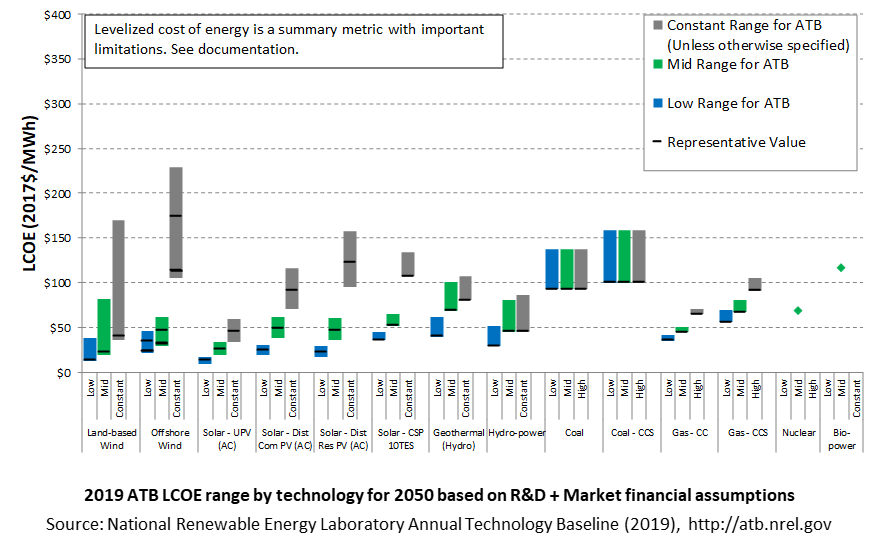
Levelized cost of energy (LCOE) is a summary metric that combines the primary technology cost and performance parameters: CAPEX, O&M, and CF. It is included in the ATB for illustrative purposes. The ATB focuses on defining the primary cost and performance parameters for use in electric sector modeling or other analysis where more sophisticated comparisons among technologies are made. The LCOE accounts for the energy component of electric system planning and operation. The LCOE uses an annual average capacity factor when spreading costs over the anticipated energy generation. This annual capacity factor ignores specific operating behavior such as ramping, start-up, and shutdown that could be relevant for more detailed evaluations of generator cost and value. Electricity generation technologies have different capabilities to provide such services. For example, wind and PV are primarily energy service providers while the other electricity generation technologies provide capacity and flexibility services in addition to energy. These capacity and flexibility services are difficult to value and depend strongly on the system in which a new generation plant is introduced. These services are represented in electric sector models such as the ReEDS model and corresponding analysis results such as the Standard Scenarios.
To estimate LCOE, assumptions about the cost of capital to finance electricity generation projects are required, and the LCOE calculations are sensitive to these financial assumptions. Two project finance structures are used within the ATB:
- R&D Only Financial Assumptions: This sensitivity
case allows technology-specific changes to debt interest rates, return
on equity rates, and debt fraction to reflect effects of R&D on
technological risk perception, but it holds background rates constant
at 2017 values from AEO2019
(EIA, 2019) and excludes effects of tax reform and tax credits. A constant cost recovery period-or period over which the initial capital investment is recovered-of 30 years is assumed for all technologies. - R&D Only + Market Financial Assumptions: This sensitivity case retains the technology-specific changes to debt interest, return on equity rates, and debt fraction from the R&D Only case and adds in the variation over time consistent with AEO2019 (EIA, 2019) as well as effects of tax reform and tax credits. As in the R&D Only case, a constant cost recovery period-or period over which the initial capital investment is recovered-of 30 years is assumed for all technologies. For a detailed discussion of these assumptions, see Project Finance Impact on LCOE.
Effects of the recent changes to Modified Accelerated Cost Recovery System (MACRS) and corporate tax rates are represented. The equations and variables used to estimate LCOE are defined on the Equations and Variables page. For illustration of the impact of changing financial structures such as WACC, see Project Finance Impact on LCOE.
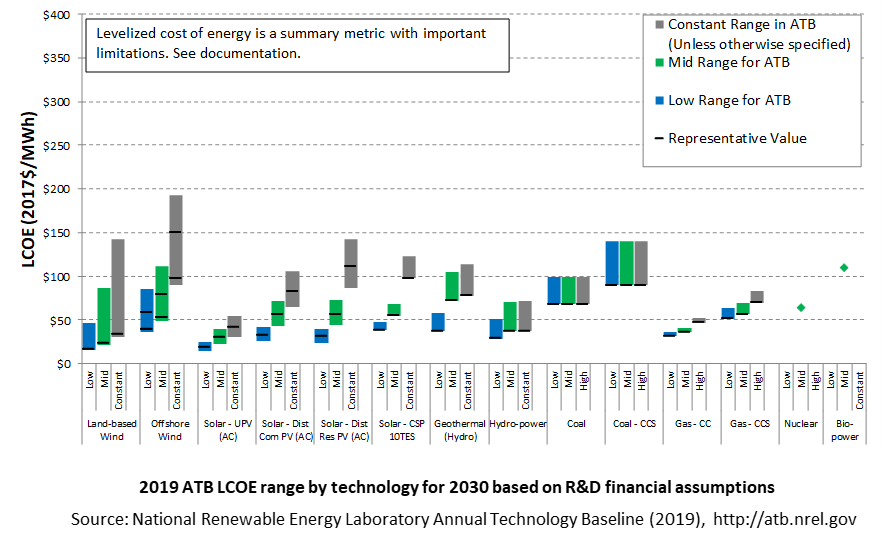
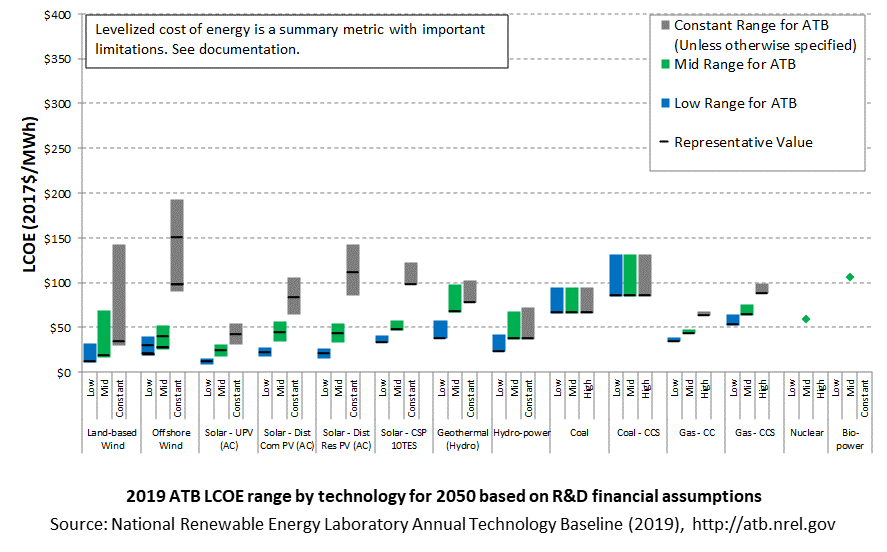
For the renewable electricity generation technologies, Constant, Mid, and Low technology cost scenarios appearing in the table and figures refer to a range of perspectives based on publicly available literature. These three technology advance scenarios are generally described as follows:
- Constant: Base Year (or near-term estimates of projects under construction) equivalent through 2050 maintains current relative technology cost differences.
- Mid: technology advances through continued industry growth, public and private R&D investments, and market conditions relative to current levels that may be characterized as "likely" or "not surprising"
- Low: Technology advances that may occur with breakthroughs, increased public and private R&D investments, and/or other market conditions that lead to cost and performance levels that may be characterized as the "limit of surprise" but not necessarily the absolute low bound.
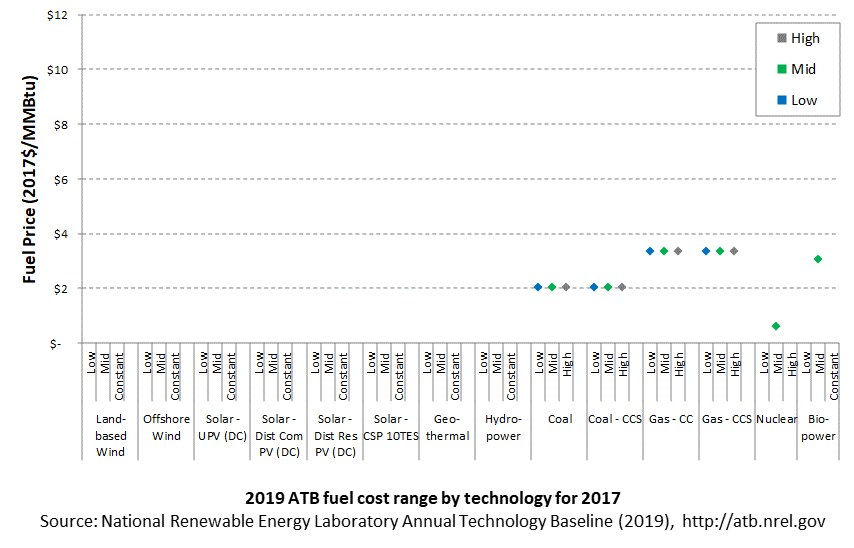
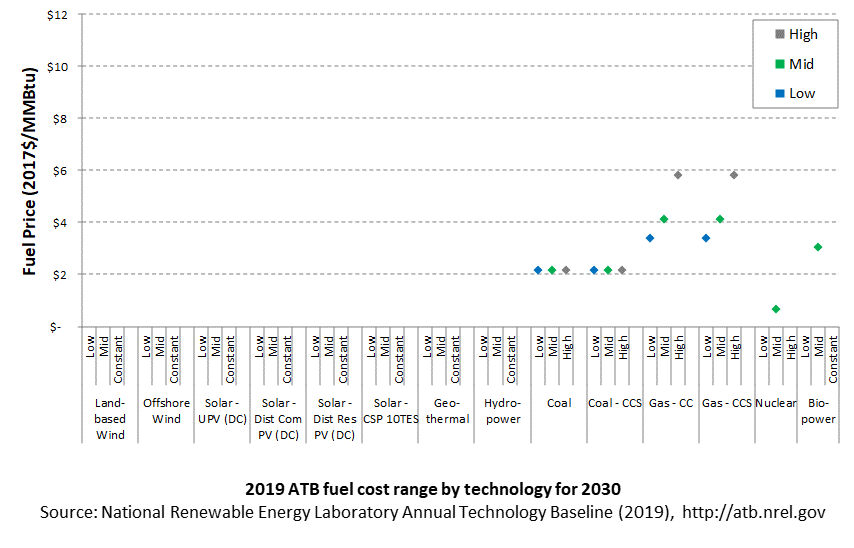
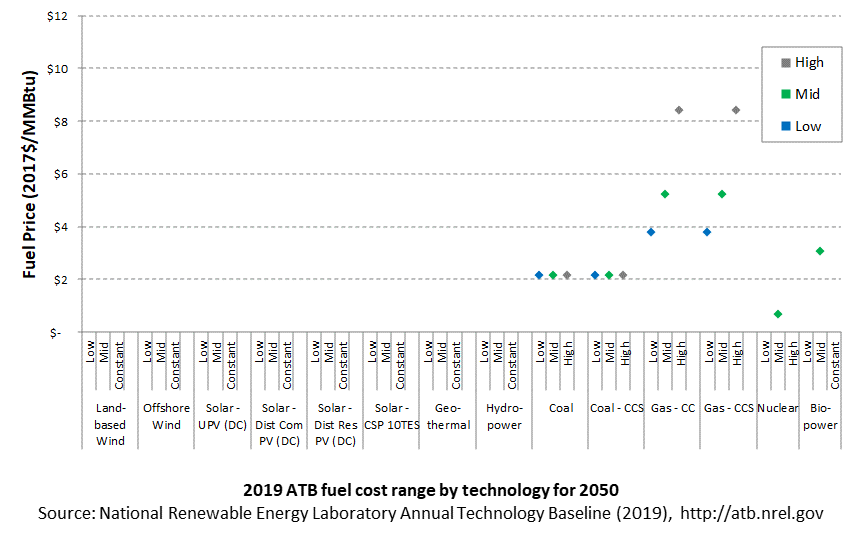
For conventional technologies, Constant, Mid, and Low technology cost designations appearing in the tables and figures refer to a range of fuel price projections derived from AEO2019 (EIA, 2019) .
The following technology abbreviations are used in these summary tables:
- CC: combined cycle
- CCS: carbon capture and storage
- CSP: concentrating solar power
- CT: combustion turbine
- IGCC: integrated gasification combined cycle
- PC: pulverized coal
- TES: thermal energy storage.
Cost and Performance Summary Tables for the Mid Technology Cost Scenario
LCOE Summary Table 2017-R&D Only
| CF Range | CAPEX Range | OPEX | LCOE Range | |||||||
| Technology | Min. (%) | Max. (%) | Min. ($/kW) | Max. ($/kW) | Fuel Costs ($/MWh) | Fixed O&M ($/kW-yr) | Variable O&M ($/MWh) | Min. ($/MWh) | Max. ($/MWh) | |
| Dispatchable | ||||||||||
| Coal | PC | 54% | 85% | $4.036 | $4,036 | $ 18 | $ 33 | $ 5 | $ 69 | $ 95 |
| IGCC | 54% | 85% | $4,409 | $4,409 | $ 18 | $ 54 | $ 8 | $ 78 | $ 108 | |
| CCS-30% | 54% | 85% | $5,633 | $5,633 | $ 20 | $ 69 | $ 7 | $ 94 | $ 132 | |
| CCS-90% | 54% | 85% | $6,229 | $6,229 | $ 24 | $ 80 | $ 10 | $ 108 | $ 151 | |
| Natural Gas | CT | 7% | 30% | $ 919 | $ 919 | $ 33 | $ 12 | $ 7 | $ 64 | $ 148 |
| CC | 51% | 87% | $927 | $927 | $ 22 | $ 11 | $ 3 | $ 33 | $ 38 | |
| CC-CCS | 51% | 87% | $2,292 | $2,292 | $ 25 | $ 34 | $ 7 | $ 54 | $ 68 | |
| Nuclear | 92% | 92% | $6,742 | $6,742 | $ 7 | $ 101 | $ 2 | $ 67 | $ 67 | |
| Biopower | 56% | 56% | $3,990 | $4,184 | $ 41 | $ 112 | $ 6 | $ 86 | $ 112 | |
| Geothermal | 80% | 90% | $4,681 | $35,813 | $ 0 | $ 135 | $ 0 | $ 78 | $ 618 | |
| CSP with 10-hr TES | 50% | 64% | $7,330 | $7,330 | $ 0 | $ 66 | $ 4 | $ 115 | $ 144 | |
| Non-Dispatchable | ||||||||||
| Wind | Land-based | 10% | 48% | $1,610 | $1,610 | $ 0 | $ 44 | $ 0 | $ 30 | $ 143 |
| Offshore | 28% | 51% | $3,774 | $6,323 | $ 0 | $ 87 | $ 0 | $ 90 | $ 192 | |
| Photovoltaic | Utility | 15% | 27% | $1,308 | $2,328 | $ 0 | $ 20 | $ 0 | $ 33 | $ 59 |
| Commercial | 12% | 20% | $1,857 | $1,857 | $ 0 | $ 18 | $ 0 | $ 66 | $ 109 | |
| Residential | 13% | 21% | $2,770 | $2,770 | $ 0 | $ 23 | $ 0 | $ 91 | $ 150 | |
| Hydropower | 60% | 64% | $4,022 | $7,469 | $ 0 | $ 43 | $ 0 | $ 37 | $ 72 | |
LCOE Summary Table 2030-R&D Only
| CF Range | CAPEX Range | OPEX | LCOE Range | |||||||
| Technology | Min. (%) | Max. (%) | Min. ($/kW) | Max. ($/kW) | Fuel Costs ($/MWh) | Fixed O&M ($/kW-yr) | Variable O&M ($/MWh) | Min. ($/MWh) | Max. ($/MWh) | |
| Dispatchable | ||||||||||
| Coal | PC | 54% | 85% | $3,869 | $3,869 | $ 19 | $ 33 | $ 5 | $ 68 | $ 93 |
| IGCC | 54% | 85% | $3,930 | $3,930 | $ 16 | $ 54 | $ 8 | $ 72 | $ 99 | |
| CCS-30% | 54% | 85% | $5,264 | $5,264 | $ 20 | $ 69 | $ 7 | $ 90 | $ 126 | |
| CCS-90% | 54% | 85% | $5,821 | $5,821 | $ 20 | $ 80 | $ 10 | $ 100 | $ 141 | |
| Natural Gas | CT | 7% | 30% | $852 | $852 | $ 37 | $ 12 | $ 7 | $ 67 | $ 145 |
| CC | 51% | 87% | $852 | $852 | $ 26 | $ 11 | $ 3 | $ 36 | $ 42 | |
| CC-CCS | 51% | 87% | $1,987 | $1,987 | $ 31 | $ 34 | $ 7 | $ 57 | $ 70 | |
| Nuclear | 92% | 92% | $6,246 | $6,246 | $ 7 | $ 101 | $ 2 | $ 64 | $ 64 | |
| Biopower | 56% | 56% | $3,823 | $4,020 | $ 41 | $ 112 | $ 6 | $ 83 | $ 110 | |
| Geothermal | 80% | 90% | $4,364 | $33,554 | $ 0 | $ 135 | $ 0 | $ 72 | $ 571 | |
| CSP with 10-hr TES | 50% | 64% | $4,681 | $4.681 | $ 0 | $ 51 | $ 4 | $ 55 | $ 69 | |
| Non-Dispatchable | ||||||||||
| Wind | Land-based | 13% | 54% | $1,252 | $1,252 | $ 0 | $ 39 | $ 0 | $ 21 | $ 87 |
| Offshore | 29% | 52% | $2,646 | $4,087 | $ 0 | $ 60 | $ 0 | $ 49 | $ 112 | |
| Photovoltaic | Utility | 15% | 27% | $ 862 | $ 862 | $ 0 | $ 7 | $ 0 | $ 22 | $ 40 |
| Commercial | 12% | 20% | $1,267 | $1,267 | $ 0 | $ 13 | $ 0 | $ 43 | $ 71 | |
| Residential | 13% | 21% | $1,408 | $1,408 | $ 0 | $ 11 | $ 0 | $ 44 | $ 72 | |
| Hydropower | 60% | 64% | $4,022 | $7,261 | $ 0 | $ 43 | $ 0 | $ 37 | $ 70 | |
LCOE Summary Table 2050-R&D Only
| CF Range | CAPEX Range | OPEX | LCOE Range | |||||||
| Technology | Min. (%) | Max. (%) | Min. ($/kW) | Max. ($/kW) | Fuel Costs ($/MWh) | Fixed O&M ($/kW-yr) | Variable O&M ($/MWh) | Min. ($/MWh) | Max. ($/MWh) | |
| Dispatchable | ||||||||||
| Coal | PC | 54% | 85% | $3,639 | $3,639 | $ 19 | $ 33 | $ 5 | $ 66 | $ 90 |
| IGCC | 54% | 85% | $3,636 | $3,636 | $ 16 | $ 54 | $ 8 | $ 69 | $ 94 | |
| CCS-30% | 54% | 85% | $4,735 | $4,735 | $ 20 | $ 69 | $ 7 | $ 85 | $ 118 | |
| CCS-90% | 54% | 85% | $5,236 | $5,236 | $ 20 | $ 80 | $ 10 | $ 94 | $ 132 | |
| Natural Gas | CT | 7% | 30% | $ 800 | $ 800 | $ 48 | $ 12 | $ 7 | $ 76 | $ 151 |
| CC | 51% | 87% | $ 800 | $ 800 | $ 33 | $ 11 | $ 3 | $ 43 | $ 48 | |
| CC-CCS | 51% | 87% | $1,726 | $1,726 | $ 39 | $ 34 | $ 7 | $ 63 | $ 75 | |
| Nuclear | 92% | 92% | $5,085 | $5,085 | $ 7 | $ 101 | $ 2 | $ 59 | $ 59 | |
| Biopower | 56% | 56% | $3,491 | $3,799 | $ 41 | $ 112 | $ 6 | $ 81 | $ 107 | |
| Geothermal | 80% | 90% | $3,967 | $30,353 | $ 0 | $ 135 | $ 0 | $ 67 | $ 526 | |
| CSP with 10-hr TES | 50% | 64% | $4,645 | $4,645 | $ 0 | $ 51 | $ 4 | $ 47 | $ 58 | |
| Non-Dispatchable | ||||||||||
| Wind | Land-based | 14% | 55% | $978 | $1,052 | $ 0 | $ 33 | $ 0 | $ 17 | $ 69 |
| Offshore | 32% | 54% | $1,594 | $2,282 | $ 0 | $ 43 | $ 0 | $ 24 | $ 52 | |
| Photovoltaic | Utility | 15% | 27% | $ 683 | $ 683 | $ 0 | $ 8 | $ 0 | $ 18 | $ 31 |
| Commercial | 12% | 20% | $1,014 | $1,014 | $ 0 | $ 10 | $ 0 | $ 34 | $ 56 | |
| Residential | 13% | 21% | $1,070 | $1,070 | $ 0 | $ 9 | $ 0 | $ 33 | $ 54 | |
| Hydropower | 60% | 64% | $4,022 | $6,863 | $ 0 | $ 43 | $ 0 | $ 37 | $ 68 | |
LCOE Summary Table 2017-R&D + Market
| CF Range | CAPEX Range | OPEX | LCOE Range | |||||||
| Technology | Min. (%) | Max. (%) | Min. ($/kW) | Max. ($/kW) | Fuel Costs ($/MWh) | Fixed O&M ($/kW-yr) | Variable O&M ($/MWh) | Min. ($/MWh) | Max. ($/MWh) | |
| Dispatchable | ||||||||||
| Coal | PC | 54% | 85% | $3,993 | $3,993 | $ 18 | $ 33 | $ 5 | $ 88 | $ 126 |
| IGCC | 54% | 85% | $4,363 | $4,363 | $ 18 | $ 54 | $ 8 | $ 99 | $ 142 | |
| CCS-30% | 54% | 85% | $5,573 | $5,573 | $ 20 | $ 69 | $ 7 | $ 99 | $ 140 | |
| CCS-90% | 54% | 85% | $6,163 | $6,163 | $ 24 | $ 80 | $ 10 | $ 113 | $ 160 | |
| Natural Gas | CT | 7% | 30% | $ 916 | $ 916 | $ 33 | $ 12 | $ 7 | $ 66 | $ 155 |
| CC | 51% | 87% | $924 | $924 | $ 22 | $ 11 | $ 3 | $ 33 | $ 39 | |
| CC-CCS | 51% | 87% | $2,285 | $2,285 | $ 25 | $ 34 | $ 7 | $ 55 | $ 71 | |
| Nuclear | 92% | 92% | $6,670 | $6,670 | $ 7 | $ 101 | $ 2 | $ 70 | $ 70 | |
| Biopower | 56% | 56% | $3,968 | $4,161 | $ 41 | $ 112 | $ 6 | $ 87 | $ 113 | |
| Geothermal | 80% | 90% | $4,637 | $35,468 | $ 0 | $ 135 | $ 0 | $ 81 | $ 652 | |
| CSP with 10-hr TES | 50% | 64% | $7,861 | $7,861 | $ 0 | $ 66 | $ 4 | $ 93 | $ 116 | |
| Non-Dispatchable | ||||||||||
| Wind | Land-based | 10% | 48% | $1,623 | $1,623 | $ 0 | $ 44 | $ 0 | $ 17 | $ 149 |
| Offshore | 28% | 52% | $3,757 | $6,293 | $ 0 | $ 122 | $ 0 | $ 82 | $ 171 | |
| Photovoltaic | Utility | 15% | 27% | $1,109 | $1,109 | $ 0 | $ 20 | $ 0 | $ 28 | $ 50 |
| Commercial | 12% | 20% | $1,854 | $1,854 | $ 0 | $ 18 | $ 0 | $ 54 | $ 89 | |
| Residential | 13% | 21% | $2,770 | $2,770 | $ 0 | $ 23 | $ 0 | $ 75 | $ 123 | |
| Hydropower | 60% | 66% | $4,010 | $7,487 | $ 0 | $ 43 | $ 0 | $ 37 | $ 71 | |
LCOE Summary Table 2030-R&D + Market
| CF Range | CAPEX Range | OPEX | LCOE Range | |||||||
| Technology | Min. (%) | Max. (%) | Min. ($/kW) | Max. ($/kW) | Fuel Costs ($/MWh) | Fixed O&M ($/kW-yr) | Variable O&M ($/MWh) | Min. ($/MWh) | Max. ($/MWh) | |
| Dispatchable | ||||||||||
| Coal | PC | 54% | 85% | $3,828 | $3,828 | $ 19 | $ 33 | $ 5 | $ 97 | $ 139 |
| IGCC | 54% | 85% | $3,926 | $3,926 | $ 16 | $ 54 | $ 8 | $ 101 | $ 147 | |
| CCS-30% | 54% | 85% | $5,208 | $5,208 | $ 20 | $ 69 | $ 7 | $ 107 | $ 154 | |
| CCS-90% | 54% | 85% | $5,559 | $5,559 | $ 20 | $ 80 | $ 10 | $ 119 | $ 171 | |
| Natural Gas | CT | 7% | 30% | $ 849 | $ 849 | $ 37 | $ 12 | $ 7 | $ 72 | $ 168 |
| CC | 51% | 87% | $ 850 | $ 850 | $ 26 | $ 11 | $ 3 | $ 38 | $ 44 | |
| CC-CCS | 51% | 87% | $1,981 | $1,981 | $ 31 | $ 34 | $ 7 | $ 61 | $ 77 | |
| Nuclear | 92% | 92% | $6,180 | $6,180 | $ 7 | $ 101 | $ 2 | $ 75 | $ 75 | |
| Biopower | 56% | 56% | $3,802 | $3,989 | $ 41 | $ 112 | $ 6 | $ 94 | $ 121 | |
| Geothermal | 80% | 90% | $4,345 | $33,231 | $ 0 | $ 135 | $ 0 | $ 74 | $ 591 | |
| CSP with 10-hr TES | 50% | 64% | $4,415 | $5,589 | $ 0 | $ 51 | $ 4 | $ 61 | $ 76 | |
| Non-Dispatchable | ||||||||||
| Wind | Land-based | 13% | 54% | $1,262 | $1,262 | $ 0 | $ 39 | $ 0 | $ 25 | $ 102 |
| Offshore | 30% | 54% | $2,633 | $4,068 | $ 0 | $ 74 | $ 0 | $ 57 | $ 133 | |
| Photovoltaic | Utility | 15% | 27% | $ 860 | $ 860 | $ 0 | $ 10 | $ 0 | $ 25 | $ 44 |
| Commercial | 12% | 20% | $1,265 | $1,265 | $ 0 | $ 13 | $ 0 | $ 48 | $ 79 | |
| Residential | 13% | 21% | $1,408 | $1,408 | $ 0 | $ 11 | $ 0 | $ 49 | $ 80 | |
| Hydropower | 60% | 66% | $4,010 | $7,203 | $ 0 | $ 43 | $ 0 | $ 46 | $ 84 | |
LCOE Summary Table 2050-R&D + Market
| CF Range | CAPEX Range | OPEX | LCOE Range | |||||||
| Technology | Min. (%) | Max. (%) | Min. ($/kW) | Max. ($/kW) | Fuel Costs ($/MWh) | Fixed O&M ($/kW-yr) | Variable O&M ($/MWh) | Min. ($/MWh) | Max. ($/MWh) | |
| Dispatchable | ||||||||||
| Coal | PC | 54% | 85% | $3,600 | $3,600 | $ 19 | $ 33 | $ 5 | $ 93 | $ 133 |
| IGCC | 54% | 85% | $3,598 | $3,598 | $ 16 | $ 54 | $ 8 | $ 96 | $ 138 | |
| CCS-30% | 54% | 85% | $4,684 | $4,684 | $ 21 | $ 69 | $ 7 | $ 100 | $ 143 | |
| CCS-90% | 54% | 85% | $5,180 | $5,180 | $ 20 | $ 80 | $ 10 | $ 111 | $ 159 | |
| Natural Gas | CT | 7% | 30% | $ 798 | $ 798 | $ 48 | $ 12 | $ 7 | $ 81 | $ 172 |
| CC | 51% | 87% | $ 798 | $ 798 | $ 33 | $ 11 | $ 3 | $ 44 | $ 51 | |
| CC-CCS | 51% | 87% | $1,721 | $1,721 | $ 29 | $ 34 | $ 7 | $ 67 | $ 81 | |
| Nuclear | 92% | 92% | $5,471 | $5,471 | $ 7 | $ 101 | $ 2 | $ 69 | $ 69 | |
| Biopower | 56% | 56% | $3,472 | $3,779 | $ 41 | $ 112 | $ 6 | $ 91 | $ 116 | |
| Geothermal | 80% | 90% | $3,930 | $30,061 | $ 0 | $ 135 | $ 0 | $ 69 | $ 543 | |
| CSP with 10-hr TES | 50% | 64% | $4,415 | $5,589 | $ 0 | $ 51 | $ 4 | $ 52 | $ 65 | |
| Non-Dispatchable | ||||||||||
| Wind | Land-based | 14% | 55% | $986 | $1,061 | $ 0 | $ 33 | $ 0 | $ 20 | $ 81 |
| Offshore | 32% | 57% | $1,587 | $2,271 | $ 0 | $ 41 | $ 0 | $ 30 | $ 61 | |
| Photovoltaic | Utility | 15% | 27% | $ 682 | $ 682 | $ 0 | $ 8 | $ 0 | $ 19 | $ 34 |
| Commercial | 12% | 20% | $1,012 | $1,012 | $ 0 | $ 10 | $ 0 | $ 38 | $ 62 | |
| Residential | 13% | 21% | $1,070 | $1,070 | $ 0 | $ 9 | $ 0 | $ 36 | $ 60 | |
| Hydropower | 60% | 66% | $4,010 | $6,843 | $ 0 | $ 43 | $ 0 | $ 45 | $ 81 | |
Cost and Performance Summary Figures
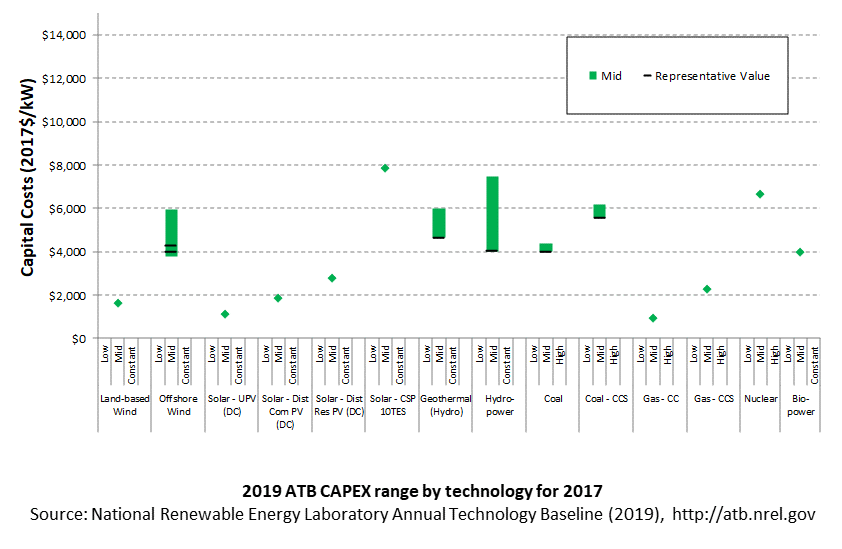
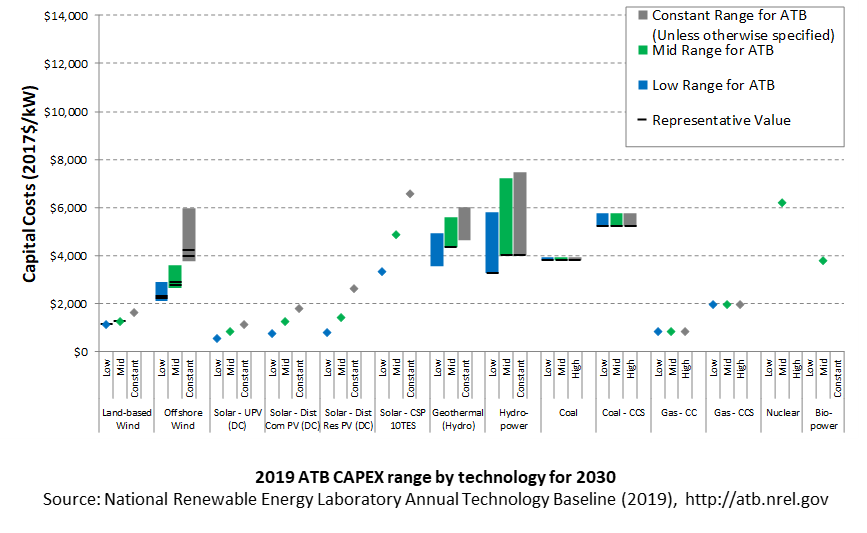
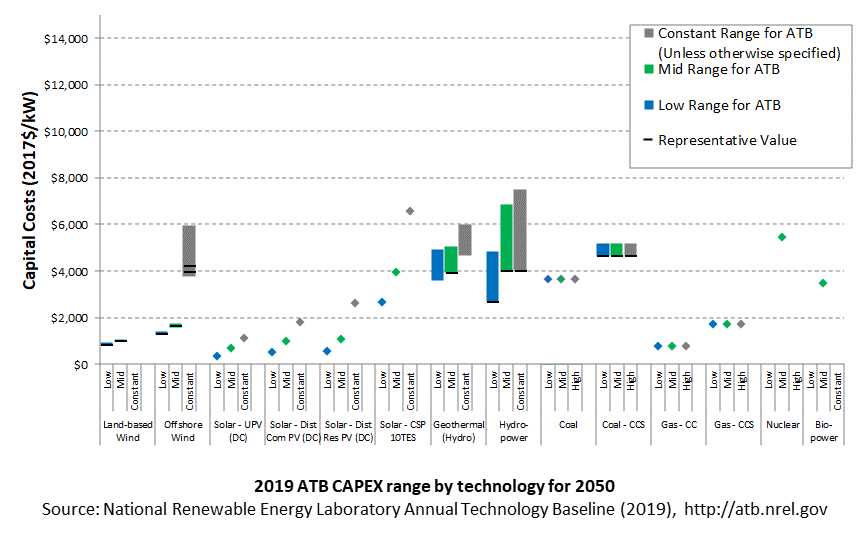
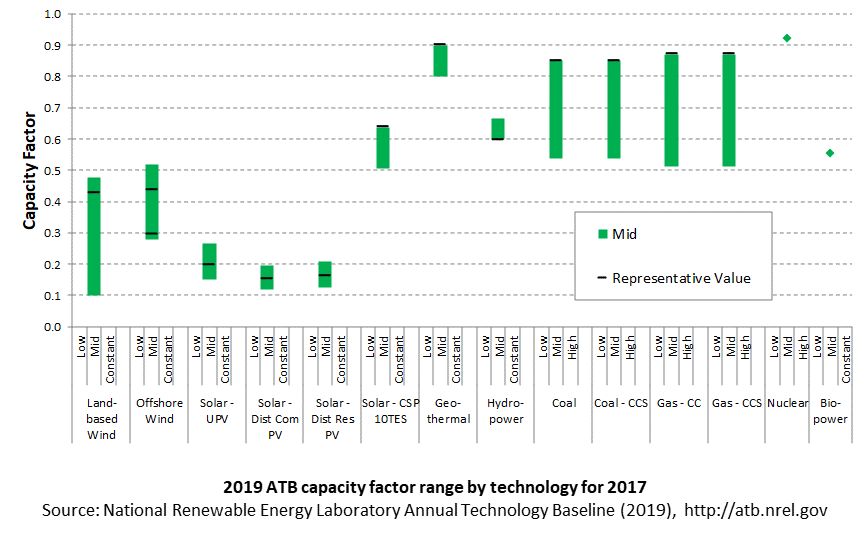
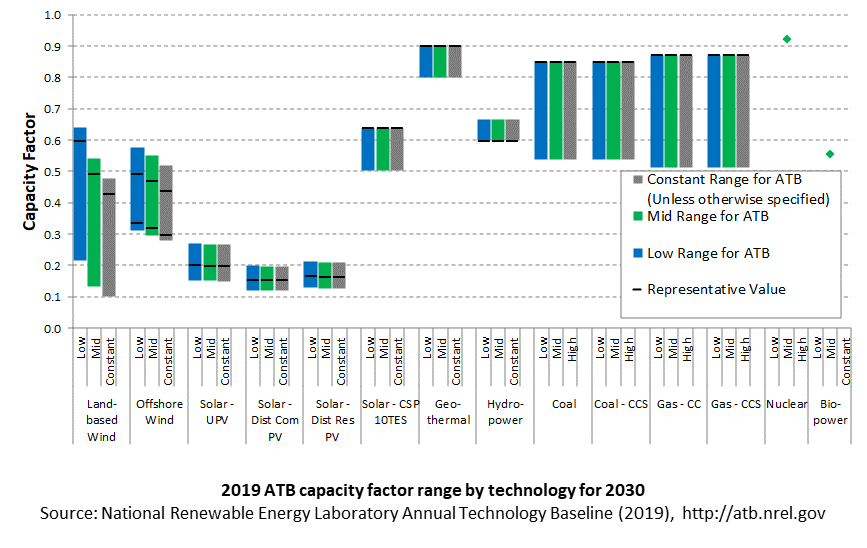
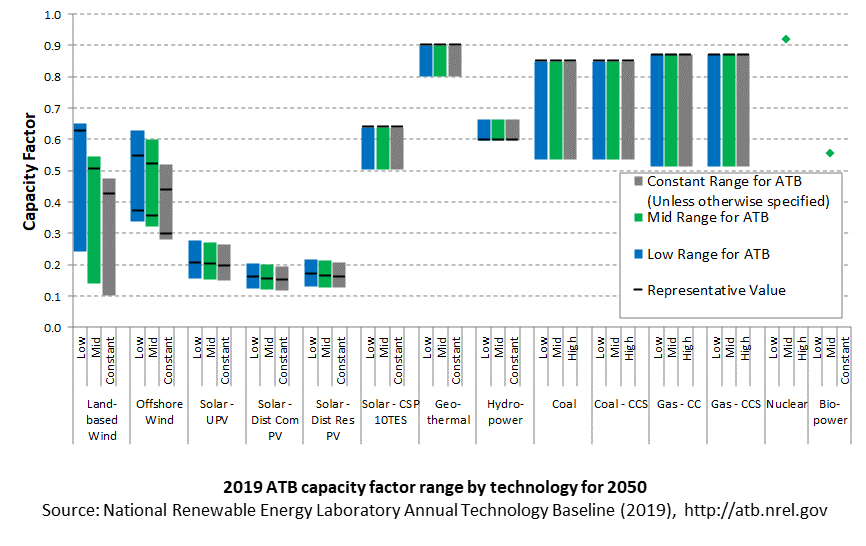
The following figures illustrate CAPEX, capacity factor, and LCOE for the Base Year (2017), 2030, and 2050. The colored bars represent the range of characteristics for all representative plants included in the ATB. The black bars reflect representative ATB plant characteristics that align most closely with recently installed or anticipated near-term installations of electricity generation plants. For the renewable technologies, the ATB representative plants span the range of resource characteristics available within the contiguous United States. For fossil fuel technologies, the colored bars illustrate the effect of capacity factor assumptions.
The ATB plant characteristics (and associated resource quality) that most closely align with recently installed or anticipated near-term installations of electricity generation plants are as follows (see individual technology sections for description of ATB representative plant characteristics):
- Land-based wind: TRG 4
- Offshore wind: TRGs 3-5
- Utility-scale PV: Kansas City
- Commercial PV: Kansas City
- Residential PV: Kansas City
- CSP: Excellent resource (this refers to Daggett, California resource of 7.65 kWh/m2/day)
- Geothermal: Hydrothermal Flash
- Hydropower: NPD 4
- Natural gas: Gas CC - High CF and Gas-CC-CCS-High CF
- Coal: Coal-New - High CF and Coal-CCS-30%-High CF
- Nuclear: no range represented in the ATB; this may be developed in future collaborations with nuclear experts
- Biopower: Dedicated.
CAPEX Figures
Capacity Factor Figures
Fuel Cost Figures
LCOE Figures
References
The following references are specific to this page; for all references in this ATB, see References.EIA. (2019a). Annual Energy Outlook 2019 with Projections to 2050. Retrieved from U.S. Energy Information Administration website: https://www.eia.gov/outlooks/aeo/pdf/AEO2019.pdf