
ATB in Context
For reference, we compare ATB scenarios with other sources: literature sources and the Annual Energy Outlook (EIA).
This section compiles capital expenditure projections from the literature in comparison to ATB scenarios for each technology. For discussion of the methods used to relate ATB scenarios to literature projections, please refer to individual technology sections.
Land-Based Wind
Projections of the cost of wind energy from the literature provide context for the ATB Constant, Mid, and Low technology cost projections. The ATB Mid cost projection results in LCOE reductions that are higher than other scenarios that are in median range of the literature ((Shreve, 2018), (BNEF, 2018b)), and lower than ((Kost, Shammugam, Julch, Huyen-Tran, & Schlegl, 2018), (Wiser et al., 2016)). The ATB Low cost projection, which corresponds to the NREL bottom-up cost analysis, is relatively in line with the leading experts prediction (Wiser et al., 2016).
- Mid case projection institutions: Bloomberg New Energy Finance, Wood Mackenzie, Global Wind Energy Council.
To jump to the 2019 ATB Land-Based Wind section, click here.
Offshore Wind
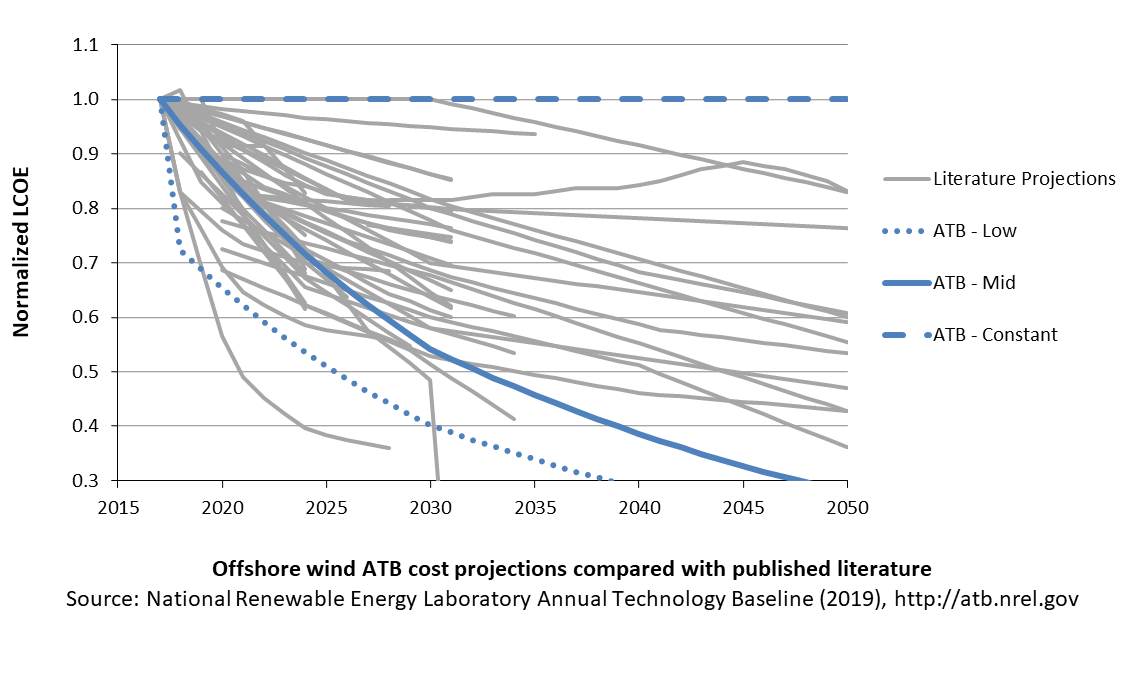
A broad sample of cost of offshore wind energy projections provides context for the ATB Constant, Mid, and Low technology cost projections. Based on a TRG3 resource classification, the ATB Mid cost projection results in LCOE reductions that are fairly aligned with the median scenarios of external studies ((BNEF, 2017a), (IRENA, 2016a), (Catapult, 2016), and (Lazard, 2017)). (EIA, 2017) estimates higher cost levels from 2022 to 2041, while EIA (2019) and (BNEF, 2018c) estimate lower cost levels for the United States by the mid-2020s. These external studies were reviewed to validate the baseline estimates and projections derived for the ATB.
To jump to the 2019 ATB Offshore Wind section, click here.
Utility-Scale PV
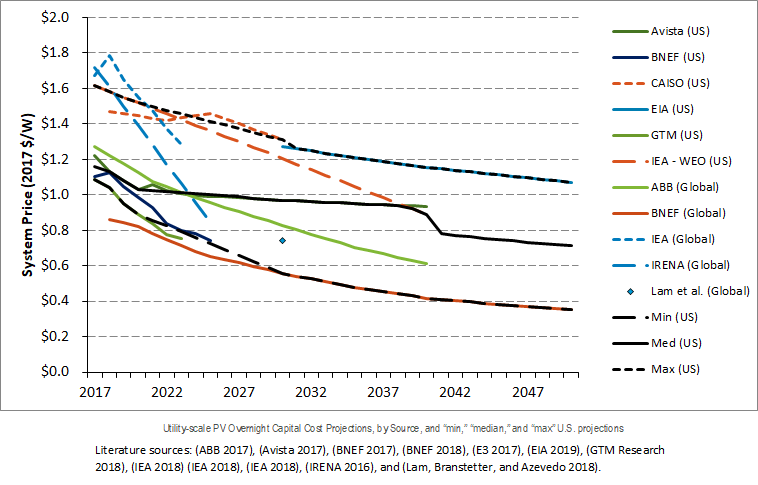
Projections of future utility-scale PV plant CAPEX are based on 11 system price projections from 9 separate institutions. The short-term forecasts were primarily provided by market analysis firms with expertise in the PV industry, through a subscription service with NREL. The long-term forecasts primarily represent the collection of publicly available, unique forecasts with either a long-term perspective of solar trends or through capacity expansion models with assumed learning by doing. Short-term U.S. price forecasts made in the past two years include: (Avista, 2017), (BNEF, 2018a), (E3, 2017), (GTM Research, 2018), and (IEA, 2018b). Long-term projections made in the past three years include (ABB, 2017), (BNEF, 2017b), (EIA, 2019), (IEA, 2018a), (IRENA, 2016b), and (Lam, Branstetter, & Azevedo, 2018).
- Short-Term Forecast Institutions: Avista, Bloomberg New Energy Finance, CAISO, GTM Research, International Energy Agency
- Long-Term Forecast Institutions: ABB; Bloomberg New Energy Finance; International Energy Agency; IRENA; Lam, Branstetter, and Azevedo (2018); U.S. Energy Information Administration.
To jump to the 2019 ATB Utility-Scale PV section, click here.
Commercial PV
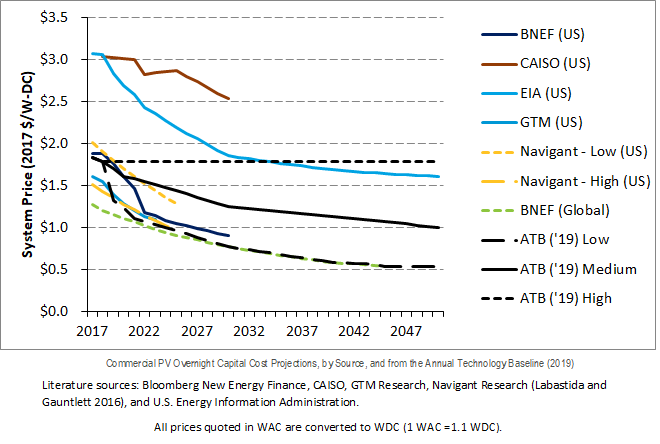
Projections of future commercial PV installation CAPEX are based on seven system price projections from five separate institutions. Projections included short-term U.S. price forecasts made in the past six months and long-term global and U.S. price forecasts made in the past primarily provided by market analysis firms with expertise in the PV industry, through a subscription service with NREL. The long-term forecasts primarily represent the collection of publicly available, unique forecasts with either a long-term perspective of solar trends or through capacity expansion models with assumed learning by doing.
- Short-Term Forecast Institutions: Bloomberg New Energy Finance, GTM Research, Navigant Research (Labastida & Gauntlett, 2016), U.S. Energy Information Administration
- Long-Term Forecast Institutions: Bloomberg New Energy Finance, CAISO, and U.S. Energy Information Administration.
To jump to the 2019 Commercial PV section, click here.
Residential PV
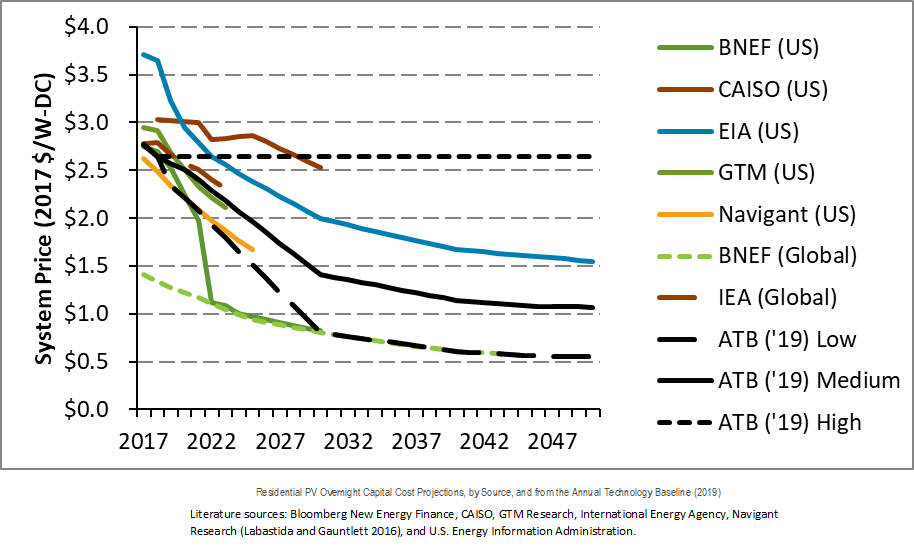
Projections of future residential PV installation CAPEX are based on seven system price projections from six separate institutions. Projections include short-term U.S. price forecasts and long-term global and U.S. price forecasts made in the past two years. The short-term forecasts were primarily provided by market analysis firms with expertise in the PV industry, through a subscription service with NREL. The long-term forecasts primarily represent the collection of publicly available, unique forecasts with either a long-term perspective of solar trends or through capacity expansion models with assumed learning by doing.
- Short-Term Forecast Institutions: Bloomberg New Energy Finance, CAISO, GTM Research, Navigant Research (Labastida & Gauntlett, 2016), U.S. Energy Information Administration
- Long-Term Forecast Institutions: Bloomberg New Energy Finance, International Energy Agency.
To jump to the 2019 ATB Residential PV section, click here.
Concentrating Solar Power
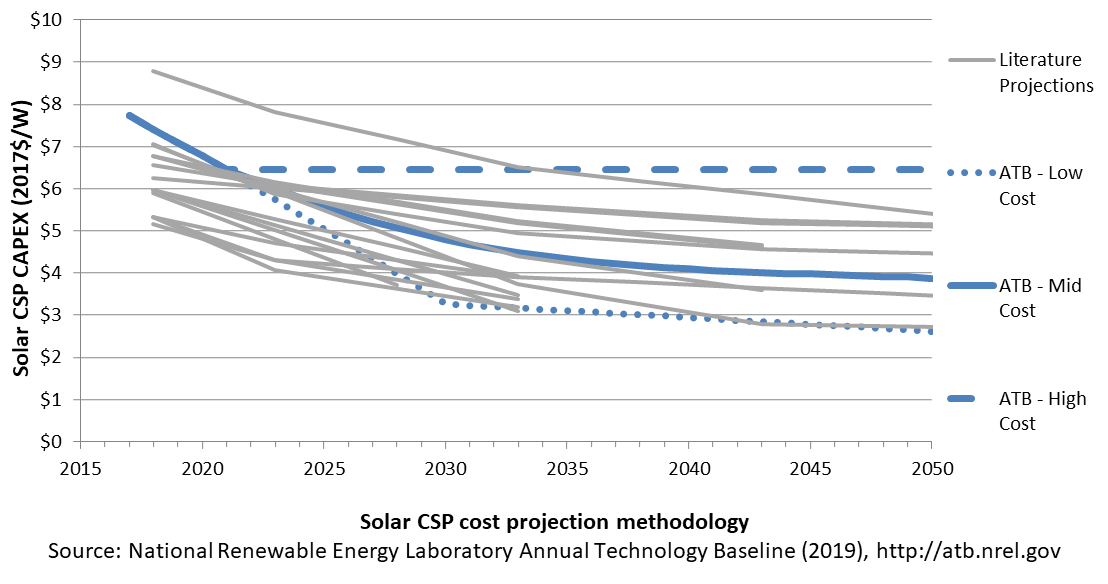
A range of literature projections is shown to illustrate the comparison with the ATB. When comparing the ATB projections with other projections, note that there are major differences in technology assumptions, radiation conditions, field sizes, storage configurations, and other factors. As shown in the chart, the ATB 2019 CSP Mid projection is in line with other recently analyzed projections from other organizations. The Low cost ATB projection is based on the lower bound of the literature sample, and on the Power to Change report (IRENA, 2016b).
To jump to the 2019 ATB Concentrating Solar Power section, click here.
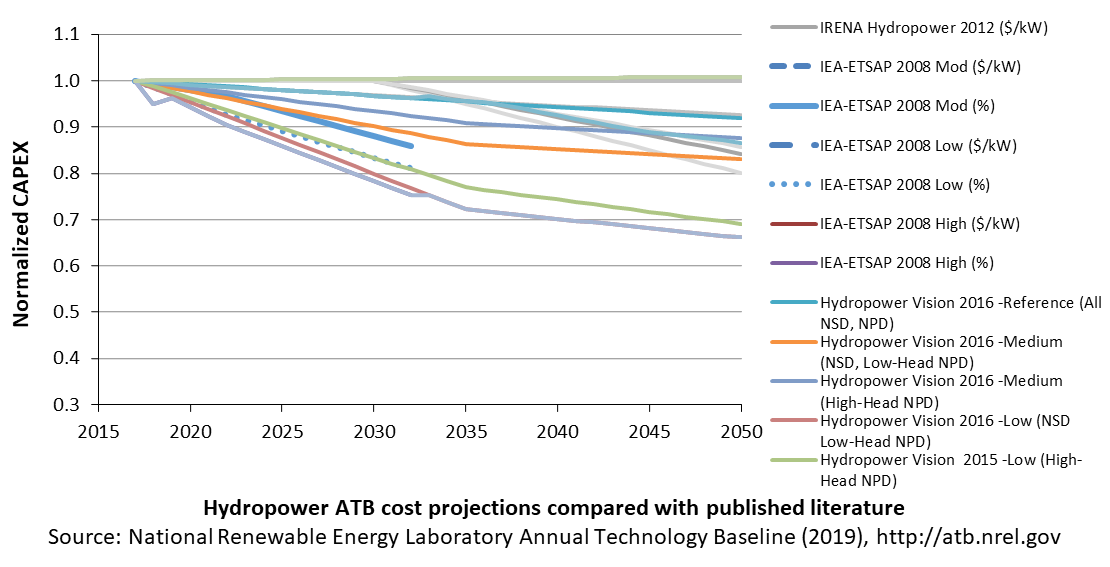
Hydropower
A range of literature projections is shown for comparison. The Mid and Low cost cases use a mix of inputs based on EIA technological learning assumptions, input from a technical team of Oak Ridge National Laboratory researchers, and the experience of expert hydropower consultants.
To jump to the 2019 ATB Hydropower section, click here.
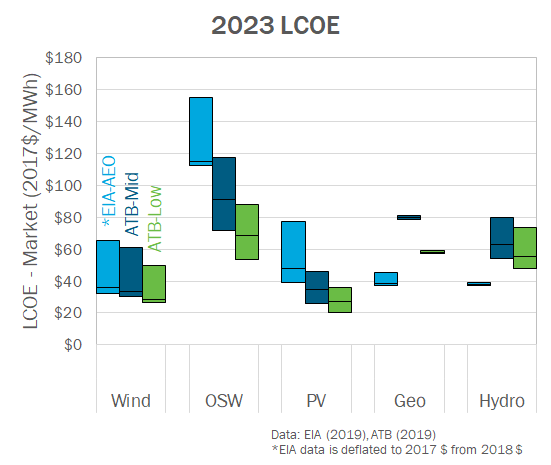
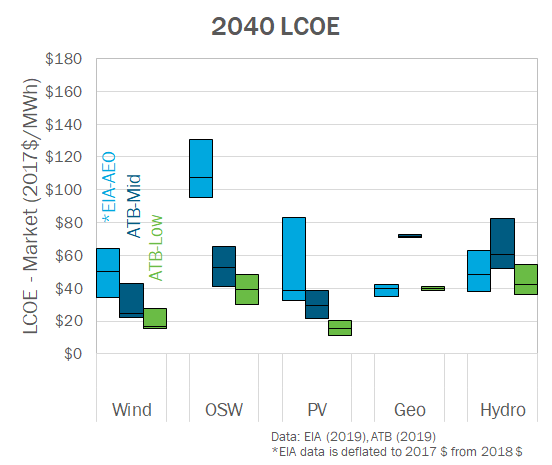
The following charts show comparisons of the ATB LCOE in the Market case with the AEO reference case LCOE by technology. For further discussion of LCOE comparisons in different scenarios, please see Project Finance Impact on LCOE.
References
The following references are specific to this page; for all references in this ATB, see References.ABB. (2017). Spring 2017 Power Reference Case: Preview of key changes and potential impacts. ABB Enterprise Software.
Avista. (2017). 2017 Electric Integrated Resource Plan. Retrieved from https://www.myavista.com/-/media/myavista/content-documents/about-us/our-company/irp-documents/2017-electric-irp-final.pdf?la=en
BNEF. (2017a). 2H 2017 Offshore Wind Market Outlook (presentation by Tom Tom Harries). Retrieved from https://about.bnef.com/blog/global-offshore-wind-market-set-to-grow-sixfold-by-2030/
BNEF. (2017b). H2 2017 U.S. PV Market Outlook. New York, NY: BNEF (Bloomberg New Energy Finance).
BNEF. (2018a). 2H 2018 US PV Market Outlook. Bloomberg New Energy Finance (BNEF).
BNEF. (2018b). BloombergNEF - EPVAL Wind Inputs 2H 2018 - US - Onshore. BNEF.
BNEF. (2018c). U.S. Offshore Wind. Presentation by Tom Harries.
Catapult. (2016). Cost Reduction Monitoring Framework. Quantitative Assessment Report. 19 December 2016. Retrieved from http://crmfreport.com/wp-content/uploads/2017/02/CRMF-2016-Quantitative-Report-Print-Version.pdf
E3. (2017). RESOLVE Documentation: CPUC 2017 IRP: Inputs & Assumptions. Retrieved from http://www.cpuc.ca.gov/uploadedFiles/CPUCWebsite/Content/UtilitiesIndustries/Energy/EnergyPrograms/ElectPowerProcurementGeneration/LTPP/2017/RESOLVE_CPUC_IRP_Inputs_Assumptions_2017-05-15.pdf
EIA. (2017b). Levelized Cost and Levelized Avoided Cost of New Generation Resources in the Annual Energy Outlook 2017. Retrieved from U.S. Energy Information Administration website: https://www.eia.gov/outlooks/archive/aeo17/pdf/electricity_generation.pdf
EIA. (2019a). Annual Energy Outlook 2019 with Projections to 2050. Retrieved from U.S. Energy Information Administration website: https://www.eia.gov/outlooks/aeo/pdf/AEO2019.pdf
GTM Research. (2018). U.S. PV System Pricing H2 2018: System Pricing, Breakdowns and Forecasts. Boston, MA: GTM Research.
IEA. (2018a). Renewables 2018. Retrieved from IEA (International Energy Agency) website: https://www.iea.org/renewables2018/
IEA. (2018b). Renewables 2018: Analysis and Forecasts to 2O23. Retrieved from International Energy Agency website: https://www.iea.org/renewables2018/
IRENA. (2016a). Innovation Outlook: Offshore Wind. Retrieved from International Renewable Energy Agency website: https://www.irena.org/publications/2016/Oct/Innovation-Outlook-Offshore-Wind
IRENA. (2016b). The Power to Change: Solar and Wind Cost Reduction Potential to 2025. Retrieved from International Renewable Energy Agency website: https://www.irena.org/DocumentDownloads/Publications/IRENA_Power_to_Change_2016.pdf
Kost, C., Shammugam, S., Julch, V., Huyen-Tran, N., & Schlegl, T. (2018). Levelized Cost of Electricity Renewable Energy Technologies. Retrieved from Fraunhofer website: https://www.ise.fraunhofer.de/content/dam/ise/en/documents/publications/studies/EN2018_Fraunhofer-ISE_LCOE_Renewable_Energy_Technologies.pdf
Labastida, R. R., & Gauntlett, D. (2016). Next-Generation Solar PV: High Efficiency Solar PV Modules and Module-Level Power Electronics: Global Market Analysis and Forecasts [Market Report]. Chicago, IL: Navigant Research.
Lam, L. T., Branstetter, L., & Azevedo, I. L. (2018). A Sunny Future: Expert Elicitation of China's Solar Photovoltaic Technologies. Environmental Research Letters: IOP Publishing Ltd, 13(3). Retrieved from https://iopscience.iop.org/article/10.1088/1748-9326/aaab70/meta
Lazard. (2017). Lazard's Levelized Cost of Energy Analysis: Version 11.0. Retrieved from Lazard website: https://www.lazard.com/perspective/levelized-cost-of-energy-2017/
Shreve, D. (2018). United States Wind Energy Market Outlook. Wood Mackenzie.
Wiser, R., Jenni, K., Seel, J., Baker, E., Hand, M., Lantz, E., & Smith, A. (2016). Forecasting Wind Energy Costs and Cost Drivers: The Views of the World's Leading Experts (No. LBNL-1005717; p. 87 pp.). Retrieved from Lawrence Berkeley National Laboratory website: https://emp.lbl.gov/publications/forecasting-wind-energy-costs-and