Land-Based Wind
ATB data for land-based wind are shown above. These projections use bottom-up engineering models in combination with defined 2030 turbine and plant technologies. The future technology pathways are based on predicted technology advancements from continued and rapid scaling of modern wind turbine nameplate ratings and increased rotor sizes. These gains in turbine scaling and technology advancements enable economies of scale, balance-of-plant efficiencies, and more-efficient energy extraction for turbines in various resource regimes at greater heights above the ground.
In general, there is substantial focus throughout the global wind industry on driving down costs and increasing performance as a result of fierce competition from within as well as among several power generation technologies, including solar PV and natural gas-fired generation.
The three scenarios for technology innovation are:
- Conservative Technology Innovation Scenario (Conservative Scenario): wind technology scale increasing in the near term but leveling off soon afterward, with limited advancement in turbine controls and science-based modeling to inform the next generation of wind technology
- Moderate Technology Innovation Scenario (Moderate Scenario): scale continuing to increase rapidly with innovations overcoming transportation challenges, advancements occurring in turbine controls, and science-based modeling informing the next generation of wind technology
- Advanced Technology Innovation Scenario (Advanced Scenario): enabling large-scale increases in turbine technology size and scope new transportation solutions, fully integrated wind plant advanced control systems, and high-fidelity science-based modeling to inform multiple aspects of turbine design.
Resource Categorization
In the 2020 ATB, the cost and performance data for wind technologies are specified for different resource categories that are consistent with those used to represent the full wind resource in the NREL Regional Energy Deployment System (ReEDS) model (Brown et al., 2020). In prior editions of the ATB, these classes were referred to as techno-resource groups (TRGs) and were designed based on site-specific levelized cost of energy by considering, in combination, the wind resource quality (e.g., wind speed) and turbine configuration (e.g., specific power). The TRG methodology is described in Appendix H of the Wind Vision study (DOE & NREL, 2015). In the 2020 ATB, the TRG-based classification is replaced with a simpler set of resource "wind speed classes" that are defined based on only annual mean wind speed.
For land-based wind, each of the potential wind sites represented in ReEDS is associated with one of 10 wind speed classes. The range of annual mean wind speeds, averaged for all years between 2007 and 2013 spans 1.72 m/s to 12.89 m/s. To identify the breakpoints that define the 10 wind speed classes within this wind speed range, we specify the percentile of the total wind resource technical potential in capacity terms associated with each class. For example, the top wind speed class (Wind Speed Class 1) is defined based on the mean wind speed range of the top 1% of all potential wind capacity in the contiguous United States. We specify a narrower percentile range for the top classes so that the ReEDS model has higher-resolution representation for the best sites.
The following table shows the percentile ranges assumed for each resource class as well as the resulting mean wind speed ranges that define each class. We apply these percentiles to a representation of the wind resource using only the most basic exclusions referred to as the ‘open access' scenario (Anthony Lopez, email correspondence, June 8th, 2020) and based on analysis from the Renewable Energy Potential (reV) model (Maclaurin et al., 2019). Although the ReEDS model and other analysis can and do rely on different resource representations, with different exclusion assumptions, the same mean wind speed breakpoints are used for the 10 wind speed classes shown in the table.
Wind Speed Class | Min. Wind Speed (m/s) | Max. Wind Speed (m/s) | Wind Speed Range (m/s) | Percentile Range |
1 | 9.01 | 12.89 | 3.88 | <1% |
2 | 8.77 | 9.01 | 0.24 | 1%–2% |
3 | 8.57 | 8.77 | 0.2 | 2%–4% |
4 | 8.35 | 8.57 | 0.22 | 4%–8% |
5 | 8.07 | 8.35 | 0.28 | 8%–16% |
6 | 7.62 | 8.07 | 0.45 | 16%–32% |
7 | 7.1 | 7.62 | 0.52 | 32%–48% |
8 | 6.53 | 7.1 | 0.57 | 48%–64% |
9 | 5.9 | 6.53 | 0.63 | 64%–80% |
10 | 1.72 | 5.9 | 4.18 | 80%–100% |
Scenario Descriptions
Scenario | Rotor, Nacelle Assembly | Tower | Science-Based |
Conservative | Technology Description: Monolithic blades are transported by truck, scaling is limited due to road infrastructure, and blades are similar in size to current blades.
Justification: Current wind turbine blades are fabricated as a single piece and are typically transported from the manufacturer to the project site by truck or rail, which means that without introducing new innovations (e.g., blade segmentation), they are limited by the infrastructure constraints on the transportation route (e.g., overhead bridge heights and tunnel openings). | Technology Description: Steel towers are transportable, road limitations are similar to current ones, and hub heights are not much greater than current hub heights.
Justification: Turbine tower fabricators currently manufacture canned steel tower sections using Schnabel trailers that are constrained by overhead bridge clearances. In the United States, this constrains the base diameter of the steel towers to about 4.3 meters (m) (Cotrell et al., 2014). | Technology Description: The scenario is limited to no integration of high-fidelity modeling or advanced controls, and plant optimization does not change.
Justification: This sustained wind plant technology would be used in wind plant operation today. |
Moderate | Technology Description: Advancements in blade engineering allow large segmented blades to be transported by truck, enabling larger rotors.
Justification: Various engineering firms have developed modular blade systems such as the Nabrajoint (NABRAWIND, n.d.) (see Nabrawind Technologies), which uses a bolted connection between blade modules that can be transported individually and assembled on-site; the first full-scale joint in a real blade segment is already manufactured and has been tested to demonstrate strength under operative loads. | Technology Description: Segmentation of the lower tower enables large-diameter towers, increased hub heights, and larger turbines
Justification: In 2014, wind turbine original equipment manufacturer Vestas launched its large-diameter steel tower (LDST) technology, which enables cost-effective taller towers to over 140 m by allowing the bottom section of the tower to be segmented into three sections and transported on a flatbed truck and reassembled on-site using vertical flanges; the technology is now used worldwide to take advantage of stronger wind conditions at higher hub heights (Whitby, 2014) | Technology Description: Increased integration of high-fidelity modeling and advanced controls enables higher capacity factors.
Justification: Wind turbine original equipment manufacturer GE now provides digital wind farm solutions for onshore wind applications through their cloud-based software (Predix) that collects and analyzes data at the turbine, farm, and fleet levels to optimize operation and maintenance (O&M) planning, which has resulted in a 16% increase annual energy production (Digital solutions for wind farms, 2020) |
Advanced | Technology Description: Larger nameplate turbines with segmented blades or partial pitch rotors are transported by truck or rail, which enables significantly larger blades. There is increased adoption of different rotor configurations, such as two-bladed and downwind rotors integrated with active aerodynamic controls and partial pitch blades.
Justification: Current research such as the Big Adaptive Rotor (BAR) project is investigating various rotor configuration including two-bladed, downwind, and partial pitch technologies in addition to investigating transportation options for large blades. BAR is also investigating the potential of active aerodynamic surfaces and controls for system load reduction (Johnson et al., 2019). Also, Envision has tested a two-bladed partial pitch prototype. GE is offering a mechanical joint-segmented blade. | Technology Description: On-site manufacturing of tower (spiral welding) or hybrid tower systems removes transportation limits to tower size, enabling much taller hub heights and optimized tower base diameters.
Justification: The ability to enable onsite fabrication of continuous spiral-welded towers to be optimized to system requirements without needing to constrain the tower base has been demonstrated by Keystone Tower Systems, which has also designed optimal high hub-height towers up to 180 m (see Keystone Tower Systems). Other hybrid tower systems (e.g., concrete a and steel) have also been demonstrated and may become more widely deployed for larger wind energy systems (see "Highest Performance: Using Wind Energy Efficiently," Max Bögl Wind AG). | Technology Description: All levels of high-fidelity modeling and advanced controls are achieved.
Justification: Wind industry and national laboratory research and development programs are focused on better understanding atmospheric sciences and forecasting, novel sensing technologies and measurement techniques, computer and computational sciences, multiscale and multidisciplinary computational models, digitalization, big data, and information/data science (Dykes et al., 2019). |
Impact | Reductions in turbine and balance-of-system (BOS) capital expenditures (CAPEX) through economies of scale
Reduction in rotor costs from two-bladed, downwind configurations with partial pitch blades
Reduction in drivetrain, tower, and foundation cost from distributed and active aerodynamic controls reducing system loads Increases in energy capture that are due to larger rotor sizes | Reductions in material and labor requirements that are due to advanced manufacturing, such as spiral welding
Reduction in BOS costs through nameplate scaling, innovative foundation designs, and alternative erection methods and technologies Increases in energy capture through access to higher wind speeds | Reduction of CAPEX and increase in energy capture through bespoke site design and optimization |
References | R&D Pathways for Supersized Wind Turbine Blades (Griffin, 2019) Investigation of Innovative Rotor Concepts for the Big Adaptive Rotor Project (Johnson et al., 2019) | Vestas (Whitby, 2014) Increasing Wind Turbine Tower Heights Opportunities and Challenges (Lantz et al., 2019) Onsite tapered spiral-welded towers: Keystone Tower Systems Hybrid tower systems: Max Bögl Wind AG: "Highest Performance: Using Wind Energy Efficiently" | GE: "Digital Solutions for Wind Farms" Enabling the SMART Wind Power Plant of the Future Through Science-Base Innovation (Dykes et al., 2017) Results of IEA Wind TCP Workshop on a Grand Vision for Wind Energy Technology (Dykes et al., 2019) |
In general, differences among the technology cost cases reflect different levels of adoption of innovations. Reductions in technology costs reflect the following cost reduction opportunities:
- Continued turbine scaling to larger-megawatt turbines with larger rotors such that the swept area/megawatt capacity decreases, resulting in higher capacity factors for a given location
- Continued diversification of turbine technology whereby the largest rotor diameter turbines tend to be located in lower wind speed sites, but the number of turbine options for higher wind speed sites increases
- Taller towers that result in higher capacity factors for a given site that are due to the wind speed increase with elevation above ground level
- Improved plant siting and operation to reduce plant-level energy losses, resulting in higher capacity factors
- Wind turbine technology and plants that are increasingly tailored to and optimized for local site-specific conditions
- More efficient O&M procedures combined with more reliable components to reduce annual average FOM costs
- Continued manufacturing and design efficiencies such that the capital cost per kilowatt decreases with larger turbine components
- Adoption of a wide range of innovative control, design, and material concepts that facilitate the above high-level trends.
Representative Technology
Representative technologies for land-based wind for the Base Year (2018) and in 2030 assume a 200-MW facility, which is consistent with current project sizes (Wiser & Bolinger, 2019). Representative technologies in 2030 assume a 5.5-MW turbine with a rotor diameter of 175 m and a hub height of 120 m. Notably, turbines that are nearly of this scale are commercially available today and expected to be installed at select sites in the United States in the 2020s. See below for details on changes to parameters in ATB projections.
Methodology
This section describes methodology to develop assumptions for CAPEX, O&M, and capacity factor. Click on these links for standardized assumptions for labor cost, regional cost variation, materials cost index, scale of industry, policies and regulations, and inflation.
Capital Expenditures (CAPEX)
Definition: Wind plant capital expenditures is defined to include items noted in the table above.
- Base Year: Capital expenditures (CAPEX) associated with wind plants installed in the interior of the country are used to characterize CAPEX for hypothetical wind plants with average annual wind speeds that correspond with the median conditions for recently installed wind facilities (Stehly et al., 2019). The following chart shows historical CAPEX for land-based wind.
Future Years: To reduce the vast number of combinations of future pathways, NREL analysts defined a single future turbine configuration in 2030 to estimate cost and performance for the Conservative, Moderate, and Advanced Scenarios. The specific 2030 turbine configuration for the Moderate Scenario assumes a nameplate capacity of 5.5 MW and a rotor with a diameter of 175 m that is placed on a 120-m tower. The following chart shows the scenarios in comparison to literature projections.
The defined turbine characteristics are used to estimate the total system CAPEX of a theoretical commercial scale (e.g., 200-MW) project. Although the relatively low observed sensitivity to significantly different turbine configurations for a single reference site indicate some uncertainty need for, and value of, wind turbine tailoring for varied site conditions, it is generally expected that over the long-term wind turbine designs will be optimized for a specific plant's site conditions. In the 2020 ATB, this site-specific design optimization process, which is often reflected in different CAPEX values across wind speed classes, is simplified. The CAPEX estimates are broken into 5 bins across the 10 wind speed classes based on the average annual wind speed. In the ATB, CAPEX reflects typical plants and does not include differences in regional costs associated with labor, materials, taxes, or system requirements. The related Standard Scenarios product uses Regional CAPEX Adjustments. The range of CAPEX demonstrates variation with wind resource in the contiguous United States.
Use the following table to view the components of CAPEX.
Operation and Maintenance (O&M) Costs
Definition: Operations and maintenance (O&M) costs depend on capacity and represent the annual fixed expenditures required to operate and maintain a wind plant, including items noted in the table above.
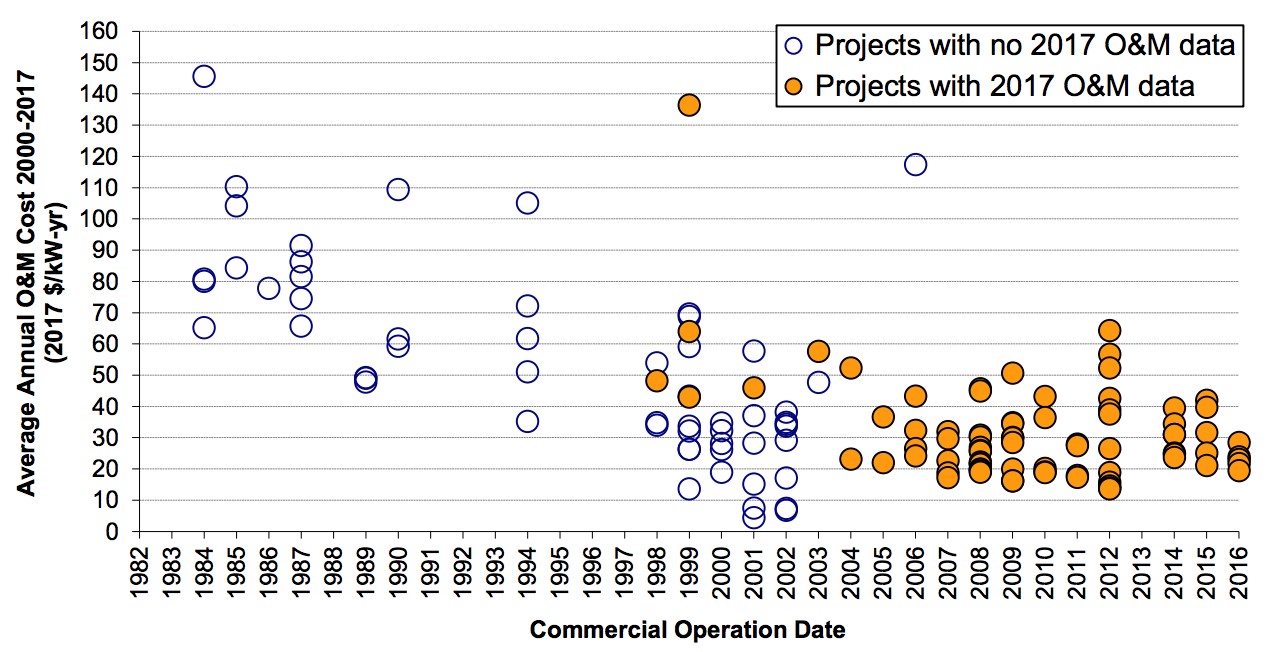
Base Year: The O&M of $44/kW-yr in the Base Year is estimated in the 2018 Cost of Wind Energy Review (Stehly et al., 2019); no variation of FOM with wind speed class (or wind speed) is assumed. The following chart shows sample historical data for reference.
Future Years: Future FOM is assumed to decline by approximately 25% by 2050 in the Moderate case and 45% in the Advanced case. These values are informed by recent benchmarking work for wind power operating costs in the United States (Wiser et al., 2019). ATB does not consider differences in regional FOM costs associated with labor, materials or differences in O&M strategies—for example, operating the wind plant to maximize tax credits by deferring maintenance activities.
Use the following table to view the components of O&M.
Capacity Factor
Definition: The capacity factor is influenced by hourly wind profile, expected downtime, and energy losses within the wind plant. The specific power (i.e., ratio of machine rating to rotor swept area) and hub height are design choices that influence the capacity factor.
Base Year: Most installed U.S. wind plants generally align with ATB estimates for performance in wind speed classes 2–7. High wind resource sites associated with wind speed class 1 as well as very low wind resource sites associated with wind speed classes 8–10 are not as common in the historical data, but the range of observed data encompasses ATB estimates.
The following chart shows a range of capacity factors based on variation in the resource for wind plants in the contiguous United States. Historical data from wind plants operating in the United States in 2015, according to the year in which plants were installed, are shown for comparison to the 2020 ATB Base Year estimates. The range of Base Year estimates illustrate the effect of locating a wind plant in sites with high wind speeds (wind speed class 1) or low wind speeds (wind speed class 10). Future projections are shown for the Conservative, Moderate, and Advanced Scenarios.
To calculate the Base Year capacity factors, the 2018 turbine characteristics (Wiser & Bolinger, 2019) are input into the System Advisor Model (SAM) and run for each of the weighted average wind speeds in each wind speed class.
The capacity factor is referenced to a 100-m, above-ground-level, long-term average hourly wind resource data from the Wind Integration National Dataset (WIND) Toolkit.
Future Years: The technology innovations described above are expected to increase capacity factor for all wind speed classes, with a more rapid rate of increases in capacity factor through 2030 and a slower rate of increase through 2050. This analysis illustrates one of many capacity factor improvement pathways for LCOE reduction. Of course, as is the case for CAPEX, there are many different pathways to a given capacity factor. Turbine rotor diameter, specific power, and hub height can each be traded-off to achieve a given capacity factor, depending on site conditions and relative costs for pursuing one approach or the other; plant layout and operational strategies that impact losses are additional levers that may be used to achieve a given capacity factor.
- Moderate Scenario: The projected capacity factors in 2030 are calculated in SAM using the inputs of the predicted turbine technology in 2030 that are specific to the Moderate Scenario for each of the wind speed classes; additional wind plant performance and availability are also applied through technology innovations assessed in the SMART wind power plant of the future work (Dykes et al., 2017); analysts predict that beyond 2030 generally modest improvements in wind plant performance through 2050 for resource-rich sites (i.e., wind speed classes 1 and 2) and slight increases for less-favorable resource sites (i.e., wind speed classes 8–10).
- Advanced Scenario: The projected capacity factors in 2030 are calculated in SAM using the inputs of the predicted turbine technology in 2030 that are specific to the Advanced Scenario for each of the wind speed classes; additional wind plant performance and availability are also applied through technology innovations assessed in the SMART wind power plant of the future work (Dykes et al., 2017), but they assume greater reduction in losses than in the Moderate case; beyond 2030, analysts predict slightly higher improvements in wind plant performance than in the Moderate case through 2050 for resource-rich sites (i.e., wind speed classes 1 and 2) and slight increases for less-favorable resource sites (i.e., wind speed classes 8–10).
References
The following references are specific to this page; for all references in this ATB, see References.
(2020). Digital solutions for wind farms. GE Renewable Energy. https://www.ge.com/renewableenergy/wind-energy/onshore-wind/digital-wind-farm
(n.d.). NABRAWIND. https://www.nabrawind.com/
Brown, Maxwell, Cole, Wesley, Eurek, Kelly, Becker, Jon, Bielen, David, Chernyakhovskiy, Ilya, Cohen, Stuart, Frazier, Will, Gagnon, Pieter, Gates, Nathaniel, Greer, Daniel, Gudladona, Sai Sameera, Ho, Jonathan, Jadun, Paige, Lamb, Katherine, Mai, Trieu, Mowers, Matthes, Murphy, Caitlin, Rose, Amy, Schleifer, Anna, Steinberg, Daniel, Sun, Yinong, Vincent, Nina, Zhou, Ella, & Zwerling, Matthew. (2020). Regional Energy Deployment System (ReEDS) Model Documentation: Version 2019. (No. NREL/TP-6A20-74111). National Renewable Energy Laboratory. https://www.nrel.gov/docs/fy20osti/74111.pdf
Cotrell, Jason, Stehly, Tyler, Johnson, Jim, Roberts, Owen, Parker, Zack, Scott, George, & Heimiller, Donna. (2014). Analysis of Transportation and Logistics Challenges Affecting the Deployment of Larger Wind Turbines: Summary of Results. (No. NREL/TP-5000-61063). National Renewable Energy Laboratory. https://www.nrel.gov/docs/fy14osti/61063.pdf
DOE, & NREL. (2015). Wind Vision: A New Era for Wind Power in the United States. (No. DOE/GO-102015-4557). U.S. Department of Energy. https://www.nrel.gov/docs/fy15osti/63197-2.pdf
Dykes, Katherine, Hand, Maureen, Stehly, Tyler, Veers, Paul, Robinson, Mike, Lantz, Eric, & Tusing, Richard. (2017). Enabling the SMART Wind Power Plant of the Future Through Science-Based Innovation. (No. NREL/TP-5000-68123). National Renewable Energy Laboratory. https://www.nrel.gov/docs/fy17osti/68123.pdf
Dykes, Katherine, Veers, Paul, Lantz, Eric, Holttinen, Hannele, Carlson, Ola, Tuohy, Aidan, Sempreviva, Anna Maria, Clifton, Andrew, Rodrigo, Javier Sanz, Berry, Derek, Laird, Daniel, Carron, Scott, Moriarty, Patrick, Marquis, Melinda, Meneveau, Charles, Peinke, Joachim, Paquette, Josh, Johnson, Nick, Pao, Lucy, Fleming, Paul, Bottasso, Carlo, Lehtomaki, Ville, Robertson, Amy, Muskulus, Michael, Manwell, Jim, Tande, John Olav, Sethuraman, Latha, Roberts, Owen, & Fields, Jasoon. (2019). Results of IEA Wind TCP Workshop on a Grand Vision for Wind Energy Technology. IEA Wind TCP. https://www.nrel.gov/docs/fy19osti/72437.pdf
Griffin, Dayton (2019). SUPERSIZED WIND TURBINE BLADE STUDY R&D Pathways for Supersized Wind Turbine Blades. DNV GL. https://eta-publications.lbl.gov/sites/default/files/supersized_blade_study_20190307_final.pdf
Johnson, Nick, Bortolotti, Pietro, Dykes, Katherine, Barter, Garrett, Moriarty, Patrick, Carron, Scott, Wendt, Fabian, Veers, Paul, Paquette, Josh, Kelly, Chris, & Ennis, Brandon. (2019). Investigation of Innovative Rotor Concepts for the Big Adaptive Rotor Project. (No. NREL/TP-5000-73605). National Renewable Energy Laboratory. https://www.nrel.gov/docs/fy19osti/73605.pdf
Lantz, Eric, Roberts, Owen, Nunemaker, Jake, DeMeo, Edgar, Dykes, Katherine, & Scott, George. (2019). Increasing Wind Turbine Tower Heights: Opportunities and Challenges. National Renewable Energy Laboratory. https://www.nrel.gov/docs/fy19osti/73629.pdf
Maclaurin, Galen, Grue, Nick, Lopez, Anthony, & Heimiller, Donna. (2019). The Renewable Energy Potential (reV) Model: A Geospatial Platform for Technical Potential and Supply Curve Modeling. (No. NREL/TP-6A20-73067). National Renewable Energy Laboratory. https://www.nrel.gov/docs/fy19osti/73067.pdf
Stehly, Tyler, Beiter, Philipp, Heimiller, Donna, & Scott, George. (2019). 2018 Cost of Wind Energy Review. (No. NREL/TP-5000-74598). National Renewable Energy Laboratory. https://www.nrel.gov/docs/fy20osti/74598.pdf
Whitby, Matt (2014). Vestas Wind Systems A/S: New tower enables increased power production at low wind sites. https://www.vestas.com/en/media/~/media/92670482644d4e5bb751ff6bd6f66a43.ashx
Wiser, Ryan, & Bolinger, Mark. (2019). 2018 Wind Technologies Market Report. (No. DOE/GO-102019-5191). Lawrence Berkeley National Laboratory. https://emp.lbl.gov/sites/default/files/wtmr_final_for_posting_8-9-19.pdf
Wiser, Ryan, Bolinger, Mark, & Lantz, Eric. (2019). Assessing Wind Power Operating Costs in the United States: Results from a Survey of Wind Industry Experts. Renewable Energy Focus.
Developed with funding from the U.S. Department of Energy’s Office of Energy Efficiency and Renewable Energy.