Battery Storage
The ATB represents cost and performance for battery storage in the form of a 4-hour, utility-scale, lithium-ion battery system with a 15-year assumed life.
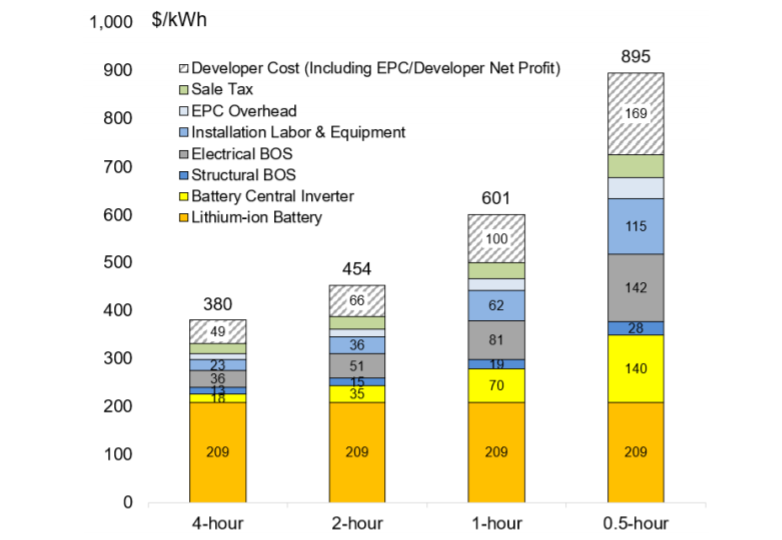
NREL has completed an analysis of the costs related to other battery sizes (4-hour to 0.5-hour) for utility-scale plants (Fu et al., 2018); those costs are represented in the following figure from the report of that analysis.
The ATB does not currently have costs for distributed battery storage, including costs for (1) behind-the-meter residential or commercial applications and (2) micro-grid or off-grid applications. Analysis by NREL of a residential battery-plus-solar PV system has resulted in a range of costs for such systems (Ardani et al., 2017).
Battery cost and performance projections in the 2020 ATB are based on a literature review of 19 sources published in 2018 or 2019, as described by Cole and Frazier (2020). Three projections from 2017 to 2050 are developed for scenario modeling based on this literature:
- Conservative Technology Innovation Scenario (Conservative Scenario): generally based on the maximum of literature projections of future CAPEX and O&M technology pathway analysis
- Moderate Technology Innovation Scenario (Moderate Scenario): generally based on the median of literature projections of future CAPEX and O&M technology pathway analysis
- Advanced Technology Innovation Scenario (Advanced Scenario): generally based on the low bound of literature projections of future CAPEX and O&M technology pathway analysis.
Capital Expenditures (CAPEX)
Definition: The literature review provided by Cole and Frazier (2020) does not enumerate elements of the capital cost of lithium-ion batteries. However, the NREL storage cost report (Fu et al., 2018) does detail a breakdown of capital costs with the actual battery pack being the largest component, but significant other costs are included. This breakdown is different if the battery is part of a hybrid system with solar PV. These relative costs for utility-scale standalone battery and battery + PV are demonstrated in the figure below.
Base Year: The Base Year cost estimate is taken from Feldman et al. (Forthcoming). Comparisons to other reported costs for 2018 and 2019 are included in Cole and Frazier (2020).
Within the ATB Data spreadsheet, costs are separated into energy and power cost estimates, which allow capital costs to be constructed for durations other than four hours according to the following equation:
For more information on the power versus energy cost breakdown, see Cole and Frazier (2020).
Future Projections: Future projections are taken from Cole and Frazier (2020), which generally used the median of published cost estimates to develop a Mid Technology Cost Scenario and the minimum values to develop a Low Technology Cost Scenario. Analysts' judgment is used to select the long-term projections to 2050 from a sparse data set.
Operation and Maintenance (O&M) Costs
Base Year: Cole and Frazier (2020) assumed no variable operation and maintenance (VOM) cost. All operating costs are instead represented using fixed operation and maintenance (FOM) costs. The FOM costs include augmentation costs needed to keep the battery system operating at rated capacity for its lifetime. In the 2020 ATB, FOM is defined as the value needed to compensate for degradation to enable the battery system to have a constant capacity throughout its life. The literature review (Cole & Frazier, 2020)states that FOM costs are estimated at 2.5% of the capital costs in dollars per kilowatt.
Future Years: In the 2020 ATB, the FOM cost remains constant at 2.5% of capital costs in all scenarios.
Capacity Factor
The cost and performance of the battery systems are based on an assumption of approximately one cycle per day. Therefore, a 4-hour device has an expected capacity factor of 16.7% (4/24 = 0.167), and a 2-hour device has an expected capacity factor of 8.3% (2/24 = 0.083). Because FOM includes costs to keep the system at rated capacity, no degradation is assumed.
Round-Trip Efficiency
Round-trip efficiency is the ratio of useful energy output to useful energy input. Cole and Frazier (2020) identified 85% as a representative round-trip efficiency, and the 2020 ATB adopts this value.
References
The following references are specific to this page; for all references in this ATB, see References.
Ardani, Kristen, O'Shaughnessy, Eric, Fu, Ran, McClurg, Chris, Huneycutt, Joshua, & Margolis, Robert. (2017). Installed Cost Benchmarks and Deployment Barriers for Residential Solar Photovoltaics with Energy Storage: Q1 2016. (No. NREL/TP-7A40-67474). National Renewable Energy Laboratory. https://doi.org/10.2172/1338670
Cole, Wesley, & Frazier, Will A. (2020). Cost Projections for Utility-Scale Battery Storage: 2020 Update. (No. NREL/TP-6A20-75385). National Renewable Energy Laboratory. https://www.nrel.gov/docs/fy20osti/75385.pdf
Feldman, David, Vignesh Ramasamy, Ran Fu, Ashwin Ramdas, Jal Desai, and Robert Margolis. (Forthcoming). U.S. Solar Photovoltaic System and Energy Storage Cost Benchmark: Q1 2020. Golden, CO: National Renewable Energy Laboratory.
Fu, Ran, Remo, Timothy W., & Margolis, Robert M. (2018). 2018 U.S. Utility-Scale Photovoltaics-Plus-Energy Storage System Costs Benchmark. (No. NREL/TP-6A20-71714). National Renewable Energy Laboratory. https://www.nrel.gov/docs/fy19osti/71714.pdf
Developed with funding from the U.S. Department of Energy’s Office of Energy Efficiency and Renewable Energy.