Deprecated: Creation of dynamic property atbOutline::$techLookup is deprecated in /var/www/html/web/models/atbOutline.class.php on line 170
Changes from 2016 ATB to 2017 ATB
The ATB provides a transparent set of technology cost and performance data for electric sector analysis. The update from the 2016 version of ATB to this 2017 version includes:
- Two options for project finance assumptions are included in the ATB data spreadsheet and are summarized in the 2017 ATB Cost and Performance Summary so that one can select between Current Market Conditions (based on AEO 2017 macroeconomic indicators for 2017) or Long-Term Historical Market Conditions (consistent with ATB 2016). The details supporting the two project finance assumptions are described here.
- Illustration of the influence of weighted average cost of capital (WACC) and Economic Life on LCOE is in Project Finance Impact on LCOE.
- The LCOE values for each technology (land-based wind, offshore wind, utility-scale PV, commercial PV, residential PV, CSP, geothermal, hydropower, natural gas, coal, nuclear, and biopower) can be viewed in three ways:
- Normalized LCOE: All values are normalized to the lowest-cost Base Year estimate to emphasize differences in High, Mid and Low High technology cost and performance projections over time and across available resources independent of market condition assumptions.
- Current Market Conditions: LCOE values are based on AEO 2017 macroeconomic indicators for 2017.
- Historical Market Conditions: LCOE values are based on assumptions consistent with ATB 2016.
- The ATB Base Year CAPEX assumptions are shown relative to the range of CAPEX that results from inclusion of geographic region cost adjustments that are implemented in the Standard Scenarios (land-based wind, offshore wind, utility-scale PV, commercial PV, residential PV, CSP, natural gas, coal, nuclear, and biopower) or site-specific assessments (hydropower and geothermal).
- General changes to all technologies include:
- The Base Year was updated from 2014 to 2015
- The dollar year was updated from 2014$ to 2015$
- Historical data was updated to include data reported through year end 2015.
- Additional changes to natural gas, coal, nuclear, and biopower technologies include:
- Cost and performance estimates were updated to match AEO 2017
- Natural gas and coal fuel costs were updated to match AEO 2017
- Information around current costs in published literature was updated
- AEO 2017 has cost projections through 2050; therefore the extrapolation method that was applied in ATB 2016 is no longer needed (primarily affected fuel costs post-2040).
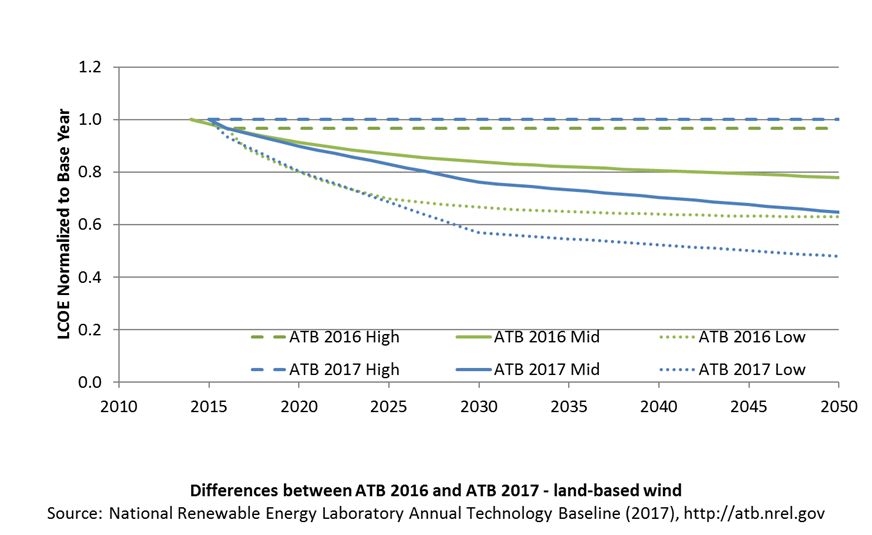
- Additional changes to land-based wind include:
- Base Year: updated to reflect 2015 wind plant cost and performance characteristics (Moné et al. 2017) using the same methodology as ATB 2016
- Projections: Percent reduction in LCOE derived from Expert Study (Wiser et al. 2016) to reflect 50% and 10% probability levels. CAPEX, O&M, and CF were assigned to each TRG based on Expert Study and technology pathway assumptions across wind resource. ATB 2016 implemented literature survey such that ATB Mid = median of literature and ATB Low = low bound of literature.
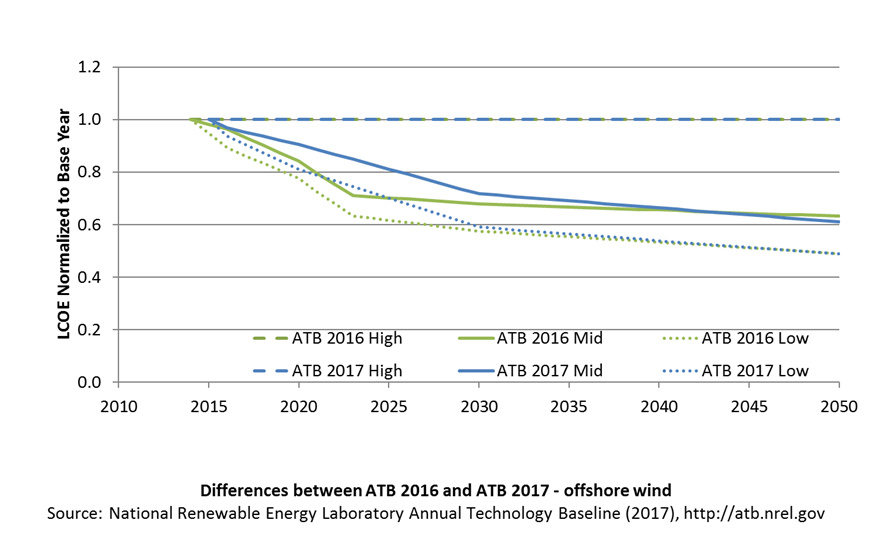
- Offshore wind
- Base Year: New representation based on A Spatial-Economic Cost-Reduction Pathway Analysis for U.S. Offshore Wind Development from 2015 to 2030 (Beiter et al. 2016) estimated CAPEX, CF, and O&M at over 7,000 potential wind plant locations throughout the coastal United States
- Projections: Percent reduction in LCOE derived from Expert Study (Wiser et al. 2016) to reflect 50% and 10% probability levels. CAPEX, O&M, and CF assigned to each TRG based on Expert Study and technology pathway assumptions across wind resource. ATB 2016 implemented literature survey such that ATB Mid = median of literature and ATB Low = low bound of literature.
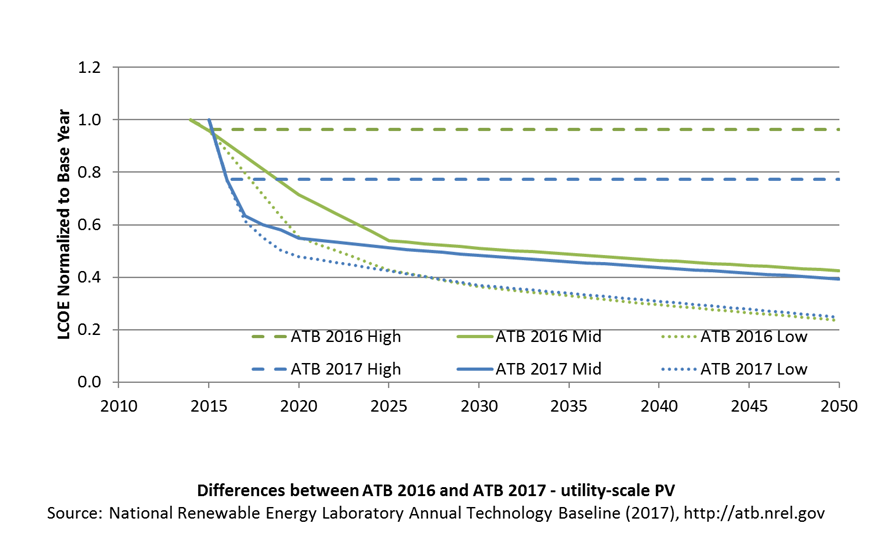
- Utility-scale PV
- Base Year: 2015 costs relative to market data, adjusted to remove regional cost effects; 2016 costs updated based on Fu et al. (2016) using the same methodology as in ATB 2016; capacity factor adjusted to reflect degradation over technical lifetime
- Projections: Literature assessed such that Mid is based on median values and Low is based on low bound of CAPEX projection literature, similar to ATB 2016. New O&M projection based on Woodhouse et al. (2016).
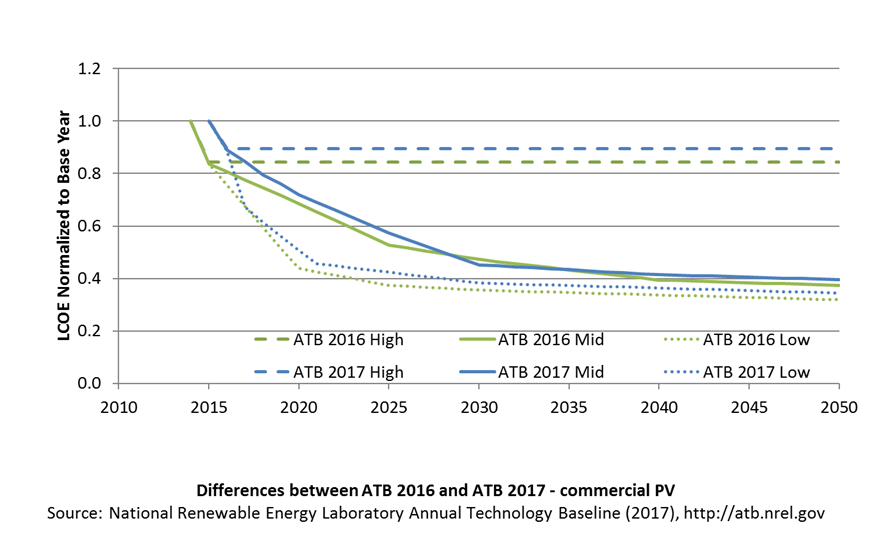
- Commercial-scale PV
- Base Year: 2015 costs relative to market data, adjusted to remove regional cost effects; 2016 costs updated based on Fu et al. (2016) using the same methodology as in ATB 2016; capacity factor adjusted to reflect degradation over technical lifetime
- Projections: Literature assessed such that Mid is based on median values and Low is based on low bound of CAPEX projection literature, similar to ATB 2016. New O&M projection based on Woodhouse et al. (2016).
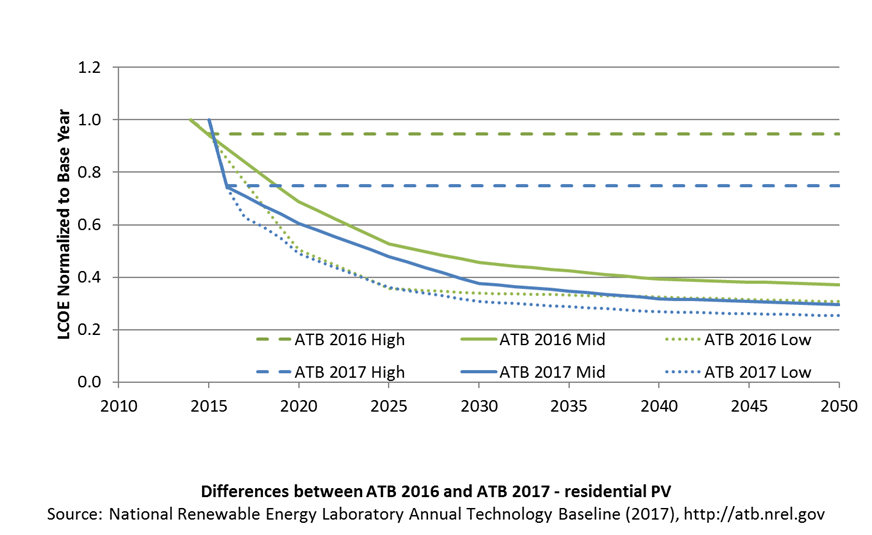
- Residential-scale PV
- Base Year: 2015 costs relative to market data, adjusted to remove regional cost effects; 2016 costs updated based on Fu et al. (2016) using the same methodology as in ATB 2016; capacity factor adjusted to reflect degradation over technical lifetime
- Projections: Literature assessed such that Mid is based on median values and Low is based on low bound of CAPEX projection literature, similar to ATB 2016. New O&M projection based on Woodhouse et al. (2016).
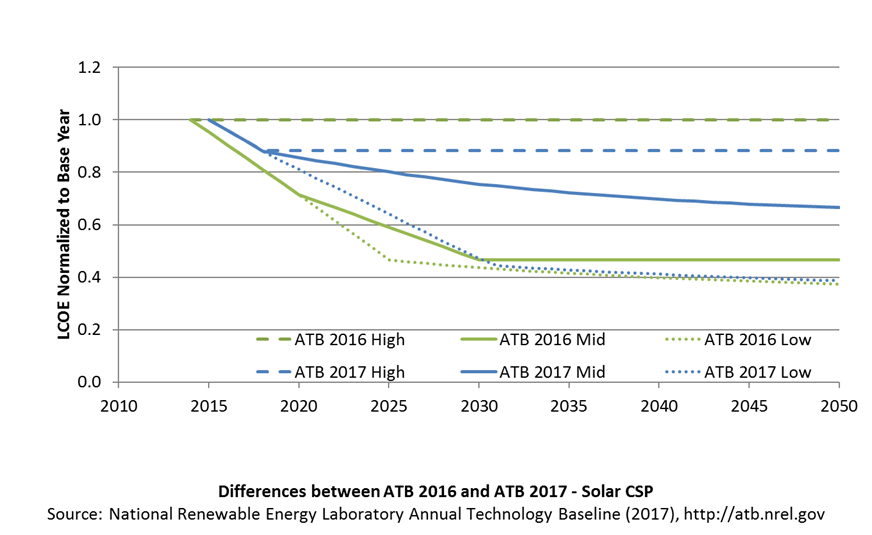
- Concentrating solar power (CSP)
- Base Year: New survey of component cost establishes CAPEX for plants that will become operational in 2018 (becomes basis for High)
- Projections: Mid case based on median of literature projections to 2030 implemented in terms of major component improvements (i.e., solar field, turbine, and storage); low case based on component pathway analysis for On the Path to SunShot and learning rates for post-2025 cost reductions, similar to ATB 2016; O&M projections based on SunShot (Low) and fraction of SunShot (Mid), similar to ATB 2016.
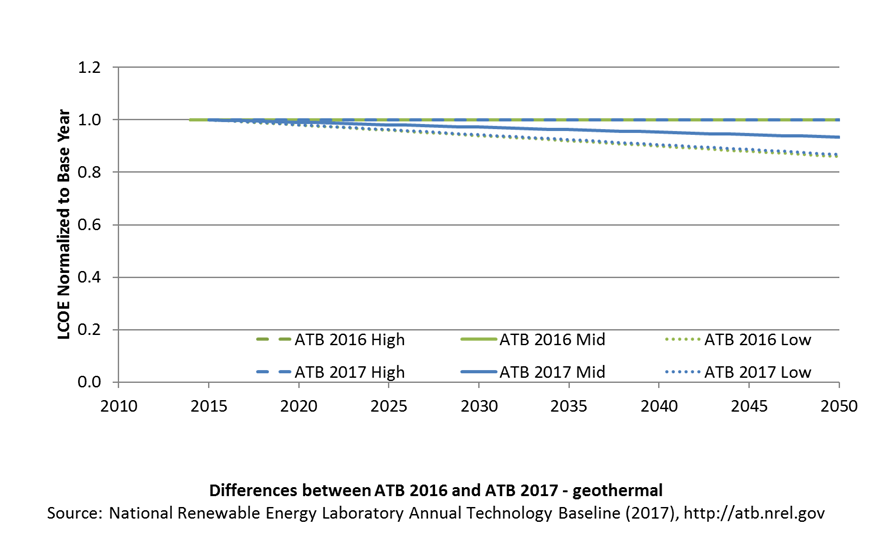
- Geothermal
- Base Year: updated to 2015$ based on Consumer Price Index
- Projections: AEO (NEMS) minimum learning (10% CAPEX reduction by 2035) applied for geothermal technologies to create a low-cost trajectory as in ATB 2016; Mid reflects mid-point between High and Low; in ATB 2016 Mid = High.
- Anticipate inclusion of Geothermal Vision Study results in future editions of ATB.
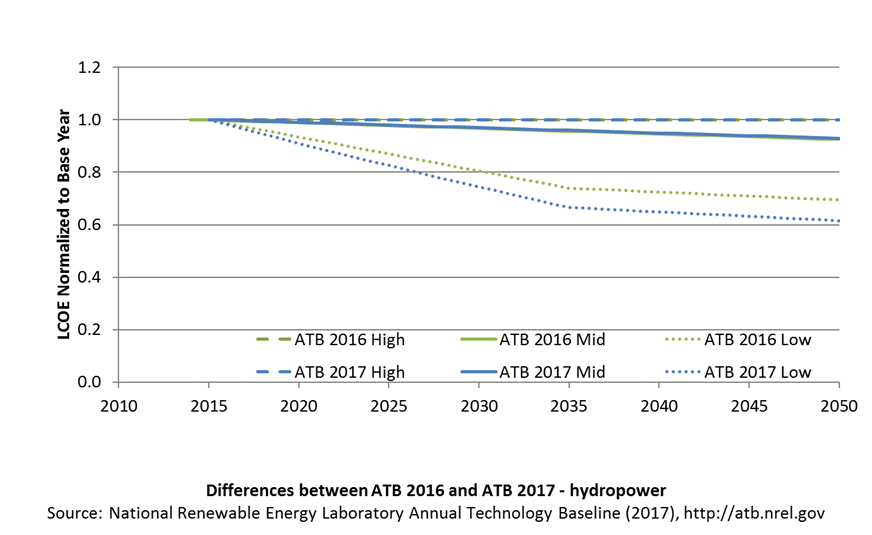
- Hydropower
- Base Year: updated to 2015$ based on Hydropower Construction Index
- Projections: Based on industry input and comparison with published literature with focus on U.S. resources (e.g., non-powered dams and new stream-reach development) from Hydropower Vision report (DOE 2016).
- ATB Mid (Reference) = 5% CAPEX reduction by 2035; 8.6% by 2050
- ATB Low (Advanced Technology) = 25%–30% CAPEX reduction by 2035; 33%–35% by 2050
- CAPEX, CF same as ATB 2016; added O&M projection consistent with Hydropower Vision in 2017 ATB.
References
Beiter, Philipp, Walter Musial, Aaron Smith, Levi Kilcher, Rick Damiani, Michael Maness, Senu Sirnivas, Tyler Stehly, Vahan Gevorgian, Meghan Mooney, and George Scott. 2016. A Spatial-Economic Cost-Reduction Pathway Analysis for U.S. Offshore Wind Energy Development from 2015-2030. Golden, CO: National Renewable Energy Laboratory. NREL/TP-6A20-66579. September 2016. http://www.nrel.gov/docs/fy16osti/66579.pdf.
DOE (U.S. Department of Energy). 2016. Hydropower Vision: A New Chapter for America's Renewable Electricity Source. Washington, D.C.: U.S. Department of Energy. DOE/GO-102016-4869. July 2016. https://energy.gov/sites/prod/files/2016/10/f33/Hydropower-Vision-10262016_0.pdf.
Moné, Christopher, Maureen Hand, Mark Bolinger, Joseph Rand, Donna Heimiller, and Jonathan Ho. 2017. 2015 Cost of Wind Energy Review. Golden, CO: National Renewable Energy Laboratory. NREL/TP-6A20-66861. http://www.nrel.gov/docs/fy17osti/66861.pdf.
Wiser, Ryan, Karen Jenni, Joachim Seel, Erin Baker, Maureen Hand, Eric Lantz, and Aaron Smith. 2016. Forecasting Wind Energy Costs and Cost Drivers: The Views of the World's Leading Experts. Berkeley, CA: Lawrence Berkeley National Laboratory. LBNL-1005717. June 2016. https://emp.lbl.gov/publications/forecasting-wind-energy-costs-and.
Woodhouse, Michael, Rebecca Jones-Albertus, David Feldman, Ran Fu, Kelsey Horowitz, Donald Chung, Dirk Jordan, and Sarah Kurtz. 2016. On the Path to SunShot: The Role of Advancements in Solar Photovoltaic Efficiency, Reliability, and Costs. Golden, CO: National Renewable Energy Laboratory. NREL/TP-6A20-65464. May 2016. http://www.nrel.gov/docs/fy16osti/65872.pdf.