Deprecated: Creation of dynamic property atbOutline::$techLookup is deprecated in /var/www/html/web/models/atbOutline.class.php on line 170
2017 ATB Cost and Performance Summary
The table and figures below summarize current (2015) and projected (2030, 2050) technology cost and performance from the 2017 ATB data spreadsheet by generation technology and year, including CF (capacity factor) range, CAPEX (capital expenditure) range, fuel cost, O&M (operations and maintenance) cost (fixed and variable), and calculated levelized cost of energy (LCOE) range.
LCOE is a simple metric that combines the primary technology cost and performance parameters, CAPEX, O&M, and CF. It is included in the ATB for illustrative purposes. The focus of the ATB is to define the primary cost and performance parameters for use in electric sector modeling or other analysis where more sophisticated comparisons among technologies are made. LCOE captures the energy component of electric system planning and operation, but the electric system also requires capacity and flexibility services to operate reliably. Electricity generation technologies have different capabilities to provide such services. For example, wind and PV are primarily energy service providers while the other electricity generation technologies provide capacity and flexibility services in addition to energy. These capacity and flexibility services are difficult to value and depend strongly on the system in which a new generation plant is introduced. These services are represented in electric sector models such as the ReEDS model and corresponding analysis results such as the Standard Scenarios.
To estimate LCOE, assumptions about the cost of capital to finance electricity generation projects are required. For comparison in the ATB, two project finance structures are represented.
- Current Market Conditions: The values of the production tax credit (PTC) and investment tax credit (ITC) are ramping down by 2020, at which time wind and solar projects may be financed with debt fractions similar to other technologies. This scenario reflects debt interest (4.4% nominal, 1.9% real) and return on equity rates (9.5% nominal, 6.8% real) to represent 2017 market conditions (AEO 2017) and a debt fraction of 60% for all electricity generation technologies. An economic life, or period over which the initial capital investment is recovered, of 20 years is assumed for all technologies. These assumptions are one of the project finance options in the ATB spreadsheet.
- Long-Term Historical Market Conditions: Historically, debt interest and return on equity were represented with higher values. This scenario reflects debt interest (8% nominal, 5.4% real) and return on equity rates (13% nominal, 10.2% real) implemented in the ReEDS model and reflected in prior versions of the ATB and Standard Scenarios model results. A debt fraction of 60% for all electricity generation technologies is assumed. An economic life, or period over which the initial capital investment is recovered, of 20 years is assumed for all technologies. These assumptions are one of the project finance options in the ATB spreadsheet.
These parameters are held constant for estimates representing the Base Year through 2050. No incentives such as the PTC or ITC are included. The equations and variables used to estimate LCOE are defined on the equations and variables page. For illustration of the impact of changing financial structures such as WACC and economic life, see Project Finance Impact on LCOE.
For the renewable electricity generation technologies, High, Mid, and Low designations appearing in the table and figures refer to a range of perspectives based on publicly available literature. These three technology advance scenarios are generally described as follows:
- High: Base Year (or near-term estimates of projects under construction) equivalent through 2050 maintains current relative technology cost differences.
- Mid: technology advances through continued industry growth, public and private R&D investments, and market conditions relative to current levels that may be characterized as “likely,” or “not surprising”
- Low: Technology advances that may occur with breakthroughs, increased public and private R&D investments, and/or other market conditions that lead to cost and performance levels that may be characterized as the “limit of surprise”, but not necessarily the absolute low bound.
For conventional technologies, High, Mid, and Low designations appearing in the tables and figures refer to a range of fuel price projections derived from AEO 2017.
The following technology abbreviations are shown:
- CC: combined cycle
- CCS: carbon capture and storage
- CSP: concentrating solar power
- CT: combustion turbine
- IGCC: integrated gasification combined cycle
- PC: pulverized coal
- TES: thermal energy storage.
Cost and Performance Summary Tables for the Mid Scenario
| CF Range | CAPEX Range | OPEX | LCOE Range | |||||||
|---|---|---|---|---|---|---|---|---|---|---|
| Technology | Min. (%) | Max. (%) | Min. ($/kW) | Max. ($/kW) | Fuel Costs ($/MWh) | Fixed O&M ($/kW-yr) | Variable O&M ($/MWh) |
Min. ($/MWh) | Max. ($/MWh) |
|
| Dispatchable | ||||||||||
| Coal | PC | 55% | 85% | $ 3,859 | $ 3859 | $ 20 | $ 32 | $ 5 | $ 71 | $ 97 |
| IGCC | 55% | 85% | $ 4,141 | $ 4,141 | $ 20 | $ 53 | $ 7 | $ 80 | $ 109 | |
| CCS-30% | 55% | 85% | $ 5,341 | $ 5,341 | $ 22 | $ 68 | $ 7 | $ 97 | $ 135 | |
| CCS-90% | 55% | 85% | $ 5,906 | $ 5,906 | $ 26 | $ 79 | $ 9 | $ 112 | $ 154 | |
| Natural Gas | CT | 7% | 30% | $ 864 | $ 864 | $ 32 | $ 12 | $ 7 | $ 70 | $ 173 |
| CC | 56% | 87% | $ 1,032 | $ 1,032 | $ 21 | $ 10 | $ 3 | $ 36 | $ 42 | |
| CC-CCS | 56% | 87% | $ 2,154 | $ 2,154 | $ 24 | $ 33 | $ 7 | $ 58 | $ 73 | |
| Nuclear | 92% | 92% | $ 5,979 | $ 5,979 | $ 6 | $ 102 | $ 2 | $ 80 | $ 80 | |
| Biopower | 52% | 52% | $ 3,889 | $ 3,889 | $ 3 | $ 108 | $ 5 | $ 130 | $ 130 | |
| Geothermal | 80% | 90% | $ 5,055 | $ 13,480 | $ 0 | $ 155 | $ 0 | $ 64 | $ 183 | |
| CSP with 10-hr TES | 42% | 59% | $ 8,133 | $ 8,133 | $ 0 | $ 66 | $ 4 | $ 130 | $ 181 | |
| Non-Dispatchable | ||||||||||
| Wind | Land-based | 11% | 47% | $ 1,573 | $ 1,713 | $ 0 | $ 51 | $ 0 | $ 40 | $ 179 |
| Offshore | 31% | 50% | $ 3,891 | $ 8,331 | $ 0 | $ 131 | $ 0 | $ 105 | $ 271 | |
| Photovoltaic | Utility | 13% | 27% | $ 2,014 | $ 2,014 | $ 0 | $ 13 | $ 0 | $ 67 | $ 134 |
| Commercial | 11% | 18% | $ 2,465 | $ 2,465 | $ 0 | $ 18 | $ 0 | $ 124 | $ 204 | |
| Residential | 12% | 20% | $ 4,025 | $ 4,025 | $ 0 | $ 24 | $ 0 | $ 180 | $ 298 | |
| Hydropower | 60% | 66% | $ 3,895 | $ 7,261 | $ 0 | $ 77 | $ 0 | $ 69 | $ 126 | |
| CF Range | CAPEX Range | OPEX | LCOE Range | |||||||
|---|---|---|---|---|---|---|---|---|---|---|
| Technology | Min. (%) | Max. (%) | Min. ($/kW) | Max. ($/kW) | Fuel Costs ($/MWh) | Fixed O&M ($/kW-yr) | Variable O&M ($/MWh) |
Min. ($/MWh) | Max. ($/MWh) |
|
| Non-Dispatchable | ||||||||||
| Wind | Land-based | 11% | 47% | $ 1,573 | $ 1,713 | $ 0 | $ 51 | $ 0 | $ 40 | $ 179 |
| Offshore | 31% | 50% | $ 3,891 | $ 8,331 | $ 0 | $ 131 | $ 0 | $ 105 | $ 271 | |
| Photovoltaic | Utility | 13% | 27% | $ 2,014 | $ 2,014 | $ 0 | $ 13 | $ 0 | $ 67 | $ 134 |
| Commercial | 11% | 18% | $ 2,465 | $ 2,465 | $ 0 | $ 18 | $ 0 | $ 124 | $ 204 | |
| Residential | 12% | 20% | $ 4,025 | $ 4,025 | $ 0 | $ 24 | $ 0 | $ 180 | $ 298 | |
| Hydropower | 60% | 66% | $ 3,895 | $ 7,261 | $ 0 | $ 77 | $ 0 | $ 69 | $ 126 | |
Here, 2017 ATB cost and performance are summarized by technology for the year specified. CAPEX and LCOE are calculated based on current market conditions. Monetary values are in 2015$. Hydropower is classified as non-dispatchable because most new hydropower generation would be operated as run-of-river plants. Note that while the levelized cost of energy (LCOE) is provided as a summary metric, it is not the focus of this work.
| CF Range | CAPEX Range | OPEX | LCOE Range | |||||||
|---|---|---|---|---|---|---|---|---|---|---|
| Technology | Min. (%) | Max. (%) | Min. ($/kW) | Max. ($/kW) | Fuel Costs ($/MWh) | Fixed O&M ($/kW-yr) | Variable O&M ($/MWh) |
Min. ($/MWh) | Max. ($/MWh) |
|
| Dispatchable | ||||||||||
| Coal | PC | 55% | 85% | $ 3,728 | $ 3,728 | $ 15 | $ 32 | $ 5 | $ 65 | $ 101 |
| IGCC | 55% | 85% | $ 3,876 | $ 3,876 | $ 13 | $ 53 | $ 7 | $ 70 | $ 107 | |
| CCS-30% | 55% | 85% | $ 5,072 | $ 5,072 | $ 16 | $ 68 | $ 7 | $ 88 | $ 135 | |
| CCS-90% | 55% | 85% | $ 5,609 | $ 5,609 | $ 16 | $ 79 | $ 9 | $ 98 | $ 150 | |
| Natural Gas | CT | 7% | 30% | $ 815 | $ 815 | $ 47 | $ 12 | $ 7 | $ 84 | $ 182 |
| CC | 56% | 87% | $ 983 | $ 983 | $ 33 | $ 10 | $ 3 | $ 47 | $ 53 | |
| CC-CCS | 56% | 87% | $ 1,955 | $ 1,955 | $ 39 | $ 33 | $ 7 | $ 71 | $ 84 | |
| Nuclear | 92% | 92% | $ 5,494 | $ 5,494 | $ 8 | $ 102 | $ 2 | $ 78 | $ 78 | |
| Biopower | 52% | 52% | $ 3,692 | $ 3,692 | $ 3 | $ 108 | $ 5 | $ 127 | $ 127 | |
| Geothermal | 80% | 90% | $ 4,865 | $ 12,974 | $ 0 | $ 155 | $ 0 | $ 63 | $ 178 | |
| CSP with 10-hr TES | 42% | 59% | $ 6,096 | $ 6,096 | $ 0 | $ 50 | $ 4 | $ 98 | $ 136 | |
| Non-Dispatchable | ||||||||||
| Wind | Land-based | 16% | 51% | $ 1,252 | $ 1,983 | $ 0 | $ 46 | $ 0 | $ 30 | $ 137 |
| Offshore | 33% | 52% | $ 2,494 | $ 5,862 | $ 0 | $ 127 | $ 0 | $ 75 | $ 192 | |
| Photovoltaic | Utility | 13% | 27% | $ 921 | $ 921 | $ 0 | $ 10 | $ 0 | $ 32 | $ 65 |
| Commercial | 11% | 18% | $ 1,126 | $ 1,126 | $ 0 | $ 8 | $ 0 | $ 56 | $ 92 | |
| Residential | 12% | 20% | $ 1,500 | $ 1,500 | $ 0 | $ 10 | $ 0 | $ 68 | $ 112 | |
| Hydropower | 60% | 66% | $ 3,895 | $ 6,996 | $ 0 | $ 77 | $ 0 | $ 69 | $ 123 | |
| CF Range | CAPEX Range | OPEX | LCOE Range | |||||||
|---|---|---|---|---|---|---|---|---|---|---|
| Technology | Min. (%) | Max. (%) | Min. ($/kW) | Max. ($/kW) | Fuel Costs ($/MWh) | Fixed O&M ($/kW-yr) | Variable O&M ($/MWh) |
Min. ($/MWh) | Max. ($/MWh) |
|
| Non-Dispatchable | ||||||||||
| Wind | Land-based | 16% | 51% | $ 1,252 | $ 1,983 | $ 0 | $ 46 | $ 0 | $ 30 | $ 137 |
| Offshore | 33% | 52% | $ 2,494 | $ 5,862 | $ 0 | $ 127 | $ 0 | $ 75 | $ 192 | |
| Photovoltaic | Utility | 13% | 27% | $ 921 | $ 921 | $ 0 | $ 10 | $ 0 | $ 32 | $ 65 |
| Commercial | 11% | 18% | $ 1,126 | $ 1,126 | $ 0 | $ 8 | $ 0 | $ 56 | $ 92 | |
| Residential | 12% | 20% | $ 1,500 | $ 1,500 | $ 0 | $ 10 | $ 0 | $ 68 | $ 112 | |
| Hydropower | 60% | 66% | $ 3,895 | $ 6,996 | $ 0 | $ 77 | $ 0 | $ 69 | $ 123 | |
Here, 2017 ATB cost and performance are summarized by technology for the year specified. CAPEX and LCOE are calculated based on current market conditions. Monetary values are in 2015$. Hydropower is classified as non-dispatchable because most new hydropower generation would be operated as run-of-river plants. Note that while the levelized cost of energy (LCOE) is provided as a summary metric, it is not the focus of this work.
| CF Range | CAPEX Range | OPEX | LCOE Range | |||||||
|---|---|---|---|---|---|---|---|---|---|---|
| Technology | Min. (%) | Max. (%) | Min. ($/kW) | Max. ($/kW) | Fuel Costs ($/MWh) | Fixed O&M ($/kW-yr) | Variable O&M ($/MWh) |
Min. ($/MWh) | Max. ($/MWh) |
|
| Dispatchable | ||||||||||
| Coal | PC | 55% | 85% | $ 3,859 | $ 3,859 | $ 10 | $ 32 | $ 5 | $ 58 | $ 109 |
| IGCC | 55% | 85% | $ 4,141 | $ 4,141 | $ 8 | $ 53 | $ 7 | $ 62 | $ 111 | |
| CCS-30% | 55% | 85% | $ 5,341 | $ 5,341 | $ 10 | $ 68 | $ 7 | $ 77 | $ 139 | |
| CCS-90% | 55% | 85% | $ 5,906 | $ 5,906 | $ 10 | $ 79 | $ 9 | $ 87 | $ 152 | |
| Natural Gas | CT | 7% | 30% | $ 773 | $ 773 | $ 54 | $ 12 | $ 7 | $ 89 | $ 182 |
| CC | 56% | 87% | $ 911 | $ 911 | $ 38 | $ 10 | $ 3 | $ 51 | $ 57 | |
| CC-CCS | 56% | 87% | $ 1,665 | $ 1,665 | $ 45 | $ 33 | $ 7 | $ 74 | $ 86 | |
| Nuclear | 92% | 92% | $ 4,851 | $ 4,851 | $ 15 | $ 102 | $ 2 | $ 78 | $ 78 | |
| Biopower | 52% | 52% | $ 3,375 | $ 3,375 | $ 3 | $ 108 | $ 5 | $ 122 | $ 122 | |
| Geothermal | 80% | 90% | $ 4,613 | $ 12,300 | $ 0 | $ 228 | $ 0 | $ 60 | $ 171 | |
| CSP with 10-hr TES | 42% | 59% | $ 5,285 | $ 5,285 | $ 0 | $ 50 | $ 4 | $ 87 | $ 120 | |
| Non-Dispatchable | ||||||||||
| Wind | Land-based | 20% | 55% | $ 1,174 | $ 2,235 | $ 0 | $ 42 | $ 0 | $ 26 | $ 116 |
| Offshore | 34% | 54% | $ 2,045 | $ 5,050 | $ 0 | $ 123 | $ 0 | $ 64 | $ 163 | |
| Photovoltaic | Utility | 13% | 27% | $ 726 | $ 726 | $ 0 | $ 0 | $ 0 | $ 26 | $ 53 |
| Commercial | 11% | 18% | $ 972 | $ 972 | $ 0 | $ 0 | $ 0 | $ 49 | $ 81 | |
| Residential | 12% | 20% | $ 1,150 | $ 1,150 | $ 0 | $ 0 | $ 0 | $ 53 | $ 88 | |
| Hydropower | 60% | 66% | $ 3,895 | $ 6,646 | $ 0 | $ 69 | $ 0 | $ 69 | $ 117 | |
| CF Range | CAPEX Range | OPEX | LCOE Range | |||||||
|---|---|---|---|---|---|---|---|---|---|---|
| Technology | Min. (%) | Max. (%) | Min. ($/kW) | Max. ($/kW) | Fuel Costs ($/MWh) | Fixed O&M ($/kW-yr) | Variable O&M ($/MWh) |
Min. ($/MWh) | Max. ($/MWh) |
|
| Non-Dispatchable | ||||||||||
| Wind | Land-based | 20% | 55% | $ 1,174 | $ 2,235 | $ 0 | $ 42 | $ 0 | $ 26 | $ 116 |
| Offshore | 34% | 54% | $ 2,045 | $ 5,050 | $ 0 | $ 123 | $ 0 | $ 64 | $ 163 | |
| Photovoltaic | Utility | 13% | 27% | $ 726 | $ 726 | $ 0 | $ 0 | $ 0 | $ 26 | $ 53 |
| Commercial | 11% | 18% | $ 972 | $ 972 | $ 0 | $ 0 | $ 0 | $ 49 | $ 81 | |
| Residential | 12% | 20% | $ 1,150 | $ 1,150 | $ 0 | $ 0 | $ 0 | $ 53 | $ 88 | |
| Hydropower | 60% | 66% | $ 3,895 | $ 6,646 | $ 0 | $ 69 | $ 0 | $ 69 | $ 117 | |
Here, 2017 ATB cost and performance are summarized by technology for the year specified. CAPEX and LCOE are calculated based on current market conditions. Monetary values are in 2015$. Hydropower is classified as non-dispatchable because most new hydropower generation would be operated as run-of-river plants. Note that while the levelized cost of energy (LCOE) is provided as a summary metric, it is not the focus of this work.
| CF Range | CAPEX Range | OPEX | LCOE Range | |||||||
|---|---|---|---|---|---|---|---|---|---|---|
| Technology | Min. (%) | Max. (%) | Min. ($/kW) | Max. ($/kW) | Fuel Costs ($/MWh) | Fixed O&M ($/kW-yr) | Variable O&M ($/MWh) |
Min. ($/MWh) | Max. ($/MWh) |
|
| Dispatchable | ||||||||||
| Coal | PC | 55% | 85% | $ 4,132 | $ 4,132 | $ 20 | $ 32 | $ 5 | $ 90 | $ 126 |
| IGCC | 55% | 85% | $ 4,434 | $ 4,434 | $ 20 | $ 53 | $ 7 | $ 100 | $ 140 | |
| CCS-30% | 55% | 85% | $ 5,719 | $ 5,719 | $ 22 | $ 68 | $ 7 | $ 123 | $ 174 | |
| CCS-90% | 55% | 85% | $ 6,324 | $ 6,324 | $ 26 | $ 79 | $ 9 | $ 140 | $ 198 | |
| Natural Gas | CT | 7% | 30% | $ 864 | $ 864 | $ 32 | $ 12 | $ 7 | $ 80 | $ 214 |
| CC | 56% | 87% | $ 1,050 | $ 1,050 | $ 21 | $ 10 | $ 3 | $ 40 | $ 48 | |
| CC-CCS | 56% | 87% | $ 2,191 | $ 2,191 | $ 24 | $ 33 | $ 7 | $ 66 | $ 85 | |
| Nuclear | 92% | 92% | $ 6,402 | $ 6,402 | $ 6 | $ 102 | $ 2 | $ 106 | $ 106 | |
| Biopower | 52% | 52% | $ 4,019 | $ 4,019 | $ 3 | $ 108 | $ 5 | $ 151 | $ 151 | |
| Geothermal | 80% | 90% | $ 5,177 | $ 13,805 | $ 0 | $ 155 | $ 0 | $ 80 | $ 230 | |
| CSP with 10-hr TES | 42% | 59% | $ 8,273 | $ 8,273 | $ 0 | $ 66 | $ 4 | $ 167 | $ 233 | |
| Non-Dispatchable | ||||||||||
| Wind | Land-based | 11% | 47% | $ 1,600 | $ 1,743 | $ 0 | $ 51 | $ 0 | $ 48 | $ 221 |
| Offshore | 31% | 50% | $ 4,001 | $ 8,568 | $ 0 | $ 131 | $ 0 | $ 129 | $ 346 | |
| Photovoltaic | Utility | 13% | 27% | $ 2,035 | $ 2,035 | $ 0 | $ 13 | $ 0 | $ 86 | $ 173 |
| Commercial | 11% | 18% | $ 2,490 | $ 2,490 | $ 0 | $ 18 | $ 0 | $ 160 | $ 262 | |
| Residential | 12% | 20% | $ 4,025 | $ 4,025 | $ 0 | $ 24 | $ 0 | $ 230 | $ 382 | |
| Hydropower | 60% | 66% | $ 3,962 | $ 7,386 | $ 0 | $ 77 | $ 0 | $ 92 | $ 164 | |
| CF Range | CAPEX Range | OPEX | LCOE Range | |||||||
|---|---|---|---|---|---|---|---|---|---|---|
| Technology | Min. (%) | Max. (%) | Min. ($/kW) | Max. ($/kW) | Fuel Costs ($/MWh) | Fixed O&M ($/kW-yr) | Variable O&M ($/MWh) |
Min. ($/MWh) | Max. ($/MWh) |
|
| Wind | Land-based | 11% | 47% | $ 1,600 | $ 1,743 | $ 0 | $ 51 | $ 0 | $ 48 | $ 221 |
| Offshore | 31% | 50% | $ 4,001 | $ 8,568 | $ 0 | $ 131 | $ 0 | $ 129 | $ 346 | |
| Photovoltaic | Utility | 13% | 27% | $ 2,035 | $ 2,035 | $ 0 | $ 13 | $ 0 | $ 86 | $ 173 |
| Commercial | 11% | 18% | $ 2,490 | $ 2,490 | $ 0 | $ 18 | $ 0 | $ 160 | $ 262 | |
| Residential | 12% | 20% | $ 4,025 | $ 4,025 | $ 0 | $ 24 | $ 0 | $ 230 | $ 382 | |
| Hydropower | 60% | 66% | $ 3,962 | $ 7,386 | $ 0 | $ 77 | $ 0 | $ 92 | $ 164 | |
Here, 2017 ATB cost and performance are summarized by technology for the year specified. CAPEX and LCOE are calculated based on current market conditions. Monetary values are in 2015$. Hydropower is classified as non-dispatchable because most new hydropower generation would be operated as run-of-river plants. Note that while the levelized cost of energy (LCOE) is provided as a summary metric, it is not the focus of this work.
| CF Range | CAPEX Range | OPEX | LCOE Range | |||||||
|---|---|---|---|---|---|---|---|---|---|---|
| Technology | Min. (%) | Max. (%) | Min. ($/kW) | Max. ($/kW) | Fuel Costs ($/MWh) | Fixed O&M ($/kW-yr) | Variable O&M ($/MWh) |
Min. ($/MWh) | Max. ($/MWh) |
|
| Dispatchable | ||||||||||
| Coal | PC | 55% | 85% | $ 3,992 | $ 3,992 | $ 15 | $ 32 | $ 5 | $ 83 | $ 129 |
| IGCC | 55% | 85% | $ 4,150 | $ 4,150 | $ 13 | $ 53 | $ 7 | $ 89 | $ 136 | |
| CCS-30% | 55% | 85% | $ 5,431 | $ 5,431 | $ 16 | $ 68 | $ 7 | $ 113 | $ 173 | |
| CCS-90% | 55% | 85% | $ 6,005 | $ 6,005 | $ 16 | $ 79 | $ 9 | $ 125 | $ 191 | |
| Natural Gas | CT | 7% | 30% | $ 815 | $ 815 | $ 47 | $ 12 | $ 7 | $ 93 | $ 221 |
| CC | 56% | 87% | $ 1,000 | $ 1,000 | $ 33 | $ 10 | $ 3 | $ 51 | $ 59 | |
| CC-CCS | 56% | 87% | $ 1,989 | $ 1,989 | $ 39 | $ 33 | $ 7 | $ 78 | $ 96 | |
| Nuclear | 92% | 92% | $ 5,883 | $ 5,883 | $ 8 | $ 102 | $ 2 | $ 101 | $ 101 | |
| Biopower | 52% | 52% | $ 3,815 | $ 3,815 | $ 3 | $ 108 | $ 5 | $ 147 | $ 147 | |
| Geothermal | 80% | 90% | $ 4,983 | $ 13,287 | $ 0 | $ 155 | $ 0 | $ 77 | $ 223 | |
| CSP with 10-hr TES | 42% | 59% | $ 6,201 | $ 6,201 | $ 0 | $ 50 | $ 4 | $ 126 | $ 175 | |
| Non-Dispatchable | ||||||||||
| Wind | Land-based | 16% | 51% | $ 1,273 | $ 2,017 | $ 0 | $ 46 | $ 0 | $ 37 | $ 171 |
| Offshore | 33% | 52% | $ 2,565 | $ 6,028 | $ 0 | $ 127 | $ 0 | $ 90 | $ 242 | |
| Photovoltaic | Utility | 13% | 27% | $ 931 | $ 931 | $ 0 | $ 10 | $ 0 | $ 41 | $ 83 |
| Commercial | 11% | 18% | $ 1,138 | $ 1,138 | $ 0 | $ 8 | $ 0 | $ 73 | $ 119 | |
| Residential | 12% | 20% | $ 1,500 | $ 1,500 | $ 0 | $ 10 | $ 0 | $ 86 | $ 143 | |
| Hydropower | 60% | 66% | $ 3,962 | $ 7,116 | $ 0 | $ 77 | $ 0 | $ 92 | $ 159 | |
| CF Range | CAPEX Range | OPEX | LCOE Range | |||||||
|---|---|---|---|---|---|---|---|---|---|---|
| Technology | Min. (%) | Max. (%) | Min. ($/kW) | Max. ($/kW) | Fuel Costs ($/MWh) | Fixed O&M ($/kW-yr) | Variable O&M ($/MWh) |
Min. ($/MWh) | Max. ($/MWh) |
|
| Non-Dispatchable | ||||||||||
| Wind | Land-based | 16% | 51% | $ 1,273 | $ 2,017 | $ 0 | $ 46 | $ 0 | $ 37 | $ 171 |
| Offshore | 33% | 52% | $ 2,565 | $ 6,028 | $ 0 | $ 127 | $ 0 | $ 90 | $ 242 | |
| Photovoltaic | Utility | 13% | 27% | $ 931 | $ 931 | $ 0 | $ 10 | $ 0 | $ 41 | $ 83 |
| Commercial | 11% | 18% | $ 1,138 | $ 1,138 | $ 0 | $ 8 | $ 0 | $ 73 | $ 119 | |
| Residential | 12% | 20% | $ 1,500 | $ 1,500 | $ 0 | $ 10 | $ 0 | $ 86 | $ 143 | |
| Hydropower | 60% | 66% | $ 3,962 | $ 7,116 | $ 0 | $ 77 | $ 0 | $ 92 | $ 159 | |
Here, 2017 ATB cost and performance are summarized by technology for the year specified. CAPEX and LCOE are calculated based on current market conditions. Monetary values are in 2015$. Hydropower is classified as non-dispatchable because most new hydropower generation would be operated as run-of-river plants. Note that while the levelized cost of energy (LCOE) is provided as a summary metric, it is not the focus of this work.
| CF Range | CAPEX Range | OPEX | LCOE Range | |||||||
|---|---|---|---|---|---|---|---|---|---|---|
| Technology | Min. (%) | Max. (%) | Min. ($/kW) | Max. ($/kW) | Fuel Costs ($/MWh) | Fixed O&M ($/kW-yr) | Variable O&M ($/MWh) |
Min. ($/MWh) | Max. ($/MWh) |
|
| Dispatchable | ||||||||||
| Coal | PC | 55% | 85% | $ 4,132 | $ 4,132 | $ 10 | $ 32 | $ 5 | $ 75 | $ 135 |
| IGCC | 55% | 85% | $ 4,434 | $ 4,434 | $ 8 | $ 53 | $ 7 | $ 79 | $ 137 | |
| CCS-30% | 55% | 85% | $ 5,719 | $ 5,719 | $ 10 | $ 68 | $ 7 | $ 99 | $ 173 | |
| CCS-90% | 55% | 85% | $ 6,324 | $ 6,324 | $ 10 | $ 79 | $ 9 | $ 111 | $ 190 | |
| Natural Gas | CT | 7% | 30% | $ 786 | $ 786 | $ 54 | $ 12 | $ 7 | $ 98 | $ 218 |
| CC | 56% | 87% | $ 927 | $ 927 | $ 38 | $ 10 | $ 3 | $ 55 | $ 63 | |
| CC-CCS | 56% | 87% | $ 1,694 | $ 1,694 | $ 45 | $ 33 | $ 7 | $ 80 | $ 95 | |
| Nuclear | 92% | 92% | $ 5,194 | $ 5,194 | $ 15 | $ 102 | $ 2 | $ 99 | $ 99 | |
| Biopower | 52% | 52% | $ 3,488 | $ 3,488 | $ 3 | $ 108 | $ 5 | $ 140 | $ 140 | |
| Geothermal | 80% | 90% | $ 4,724 | $ 12,597 | $ 0 | $ 228 | $ 0 | $ 74 | $ 213 | |
| CSP with 10-hr TES | 42% | 59% | $ 5,376 | $ 5,376 | $ 0 | $ 50 | $ 4 | $ 111 | $ 154 | |
| Non-Dispatchable | ||||||||||
| Wind | Land-based | 20% | 55% | $ 1,194 | $ 2,274 | $ 0 | $ 42 | $ 0 | $ 31 | $ 147 |
| Offshore | 34% | 54% | $ 2,103 | $ 5,194 | $ 0 | $ 123 | $ 0 | $ 76 | $ 204 | |
| Photovoltaic | Utility | 13% | 27% | $ 733 | $ 733 | $ 0 | $ 0 | $ 0 | $ 33 | $ 67 |
| Commercial | 11% | 18% | $ 982 | $ 982 | $ 0 | $ 0 | $ 0 | $ 63 | $ 104 | |
| Residential | 12% | 20% | $ 1,150 | $ 1,150 | $ 0 | $ 0 | $ 0 | $ 68 | $ 112 | |
| Hydropower | 60% | 66% | $ 3,962 | $ 6,761 | $ 0 | $ 69 | $ 0 | $ 92 | $ 152 | |
| CF Range | CAPEX Range | OPEX | LCOE Range | |||||||
|---|---|---|---|---|---|---|---|---|---|---|
| Technology | Min. (%) | Max. (%) | Min. ($/kW) | Max. ($/kW) | Fuel Costs ($/MWh) | Fixed O&M ($/kW-yr) | Variable O&M ($/MWh) |
Min. ($/MWh) | Max. ($/MWh) |
|
| Non-Dispatchable | ||||||||||
| Wind | Land-based | 20% | 55% | $ 1,194 | $ 2,274 | $ 0 | $ 42 | $ 0 | $ 31 | $ 147 |
| Offshore | 34% | 54% | $ 2,103 | $ 5,194 | $ 0 | $ 123 | $ 0 | $ 76 | $ 204 | |
| Photovoltaic | Utility | 13% | 27% | $ 733 | $ 733 | $ 0 | $ 0 | $ 0 | $ 33 | $ 67 |
| Commercial | 11% | 18% | $ 982 | $ 982 | $ 0 | $ 0 | $ 0 | $ 63 | $ 104 | |
| Residential | 12% | 20% | $ 1,150 | $ 1,150 | $ 0 | $ 0 | $ 0 | $ 68 | $ 112 | |
| Hydropower | 60% | 66% | $ 3,962 | $ 6,761 | $ 0 | $ 69 | $ 0 | $ 92 | $ 152 | |
Here, 2017 ATB cost and performance are summarized by technology for the year specified. CAPEX and LCOE are calculated based on current market conditions. Monetary values are in 2015$. Hydropower is classified as non-dispatchable because most new hydropower generation would be operated as run-of-river plants. Note that while the levelized cost of energy (LCOE) is provided as a summary metric, it is not the focus of this work.
Cost and Performance Summary Tables for the Mid Scenario
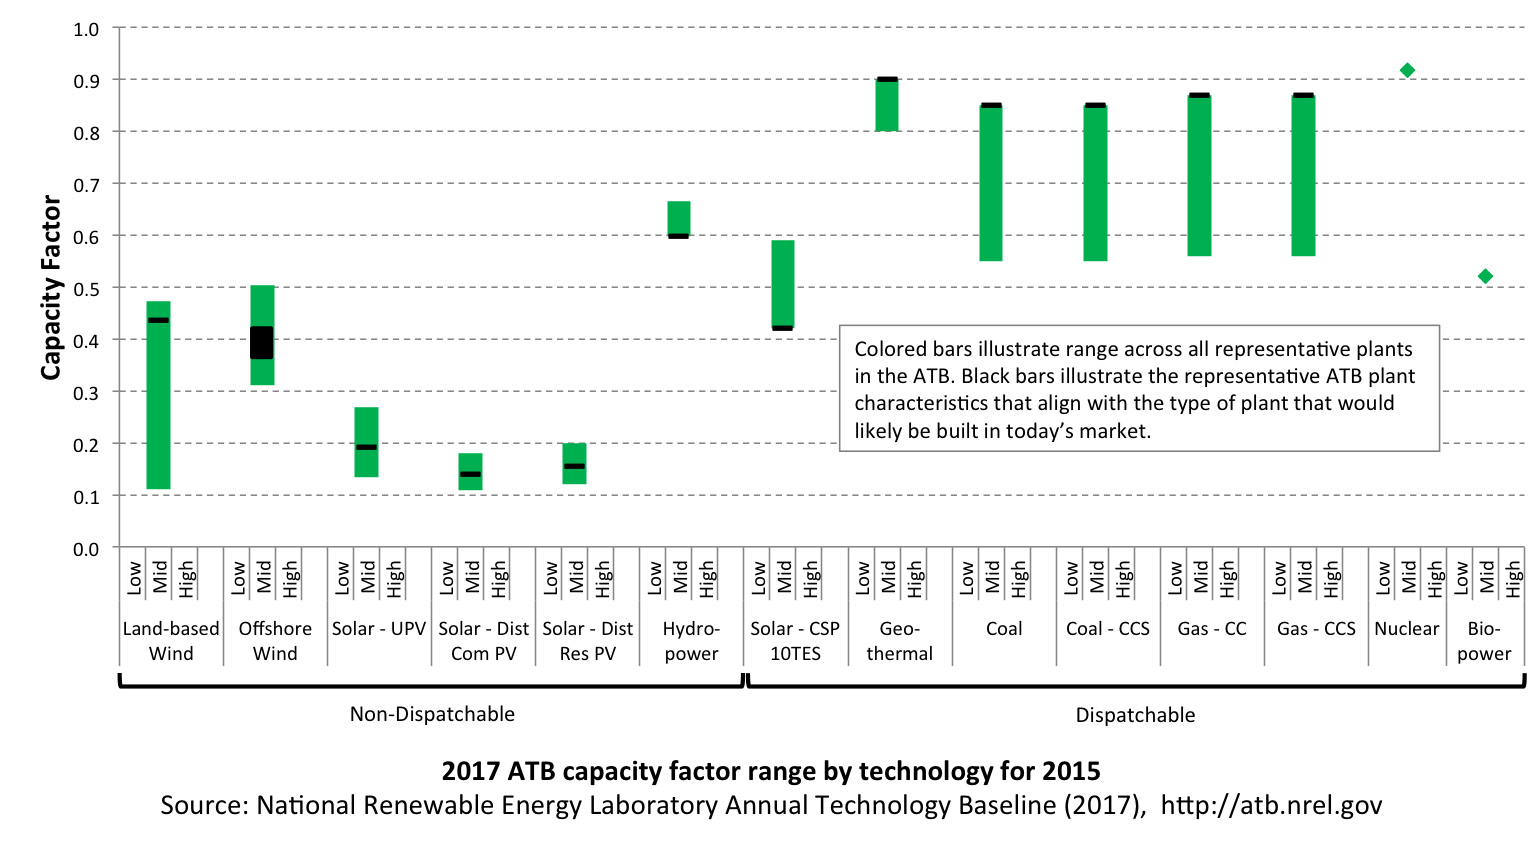
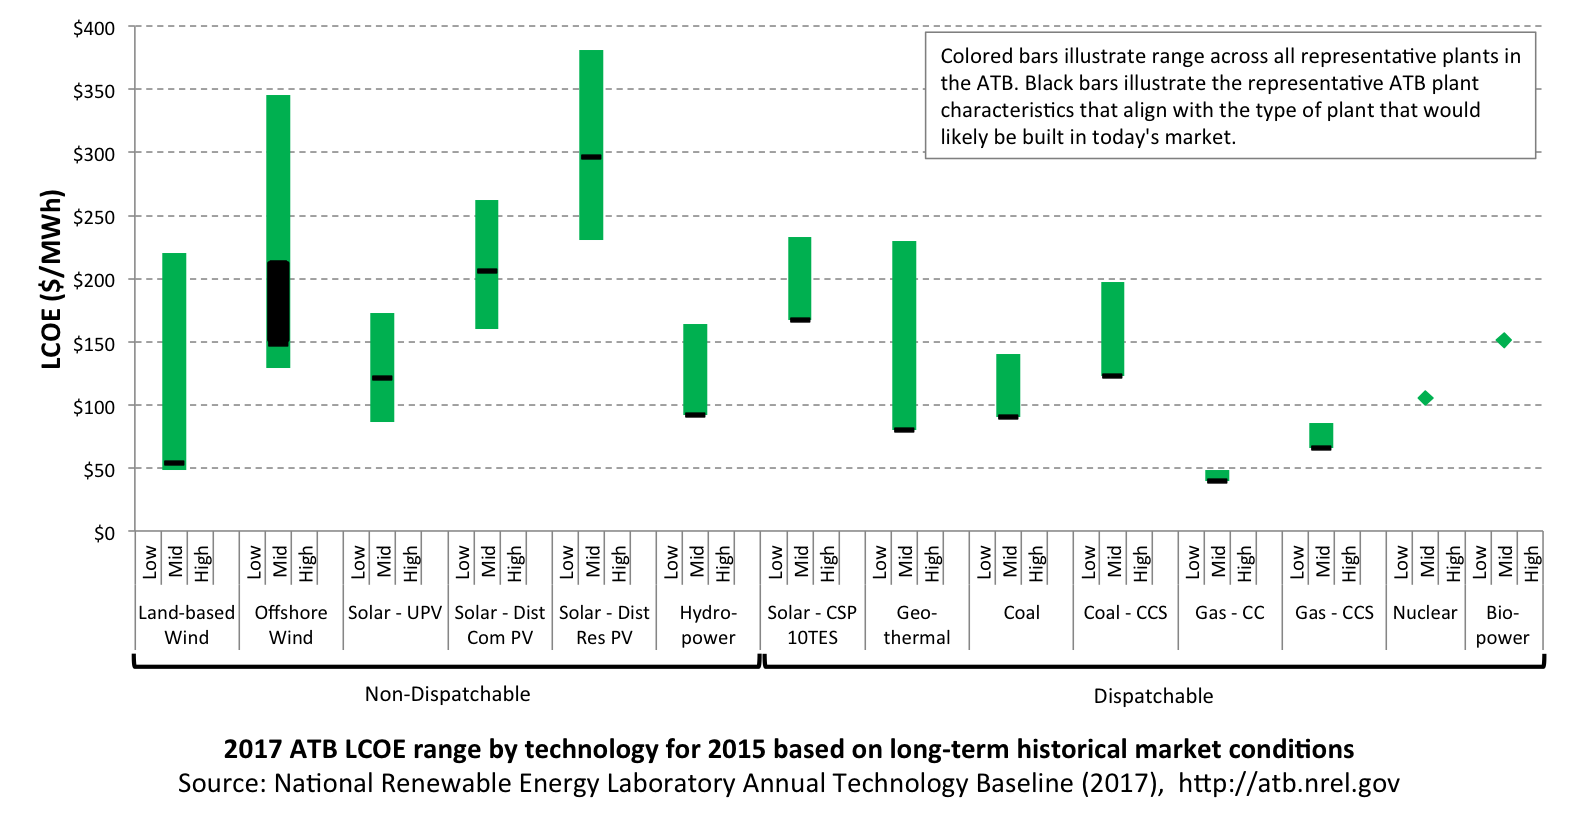
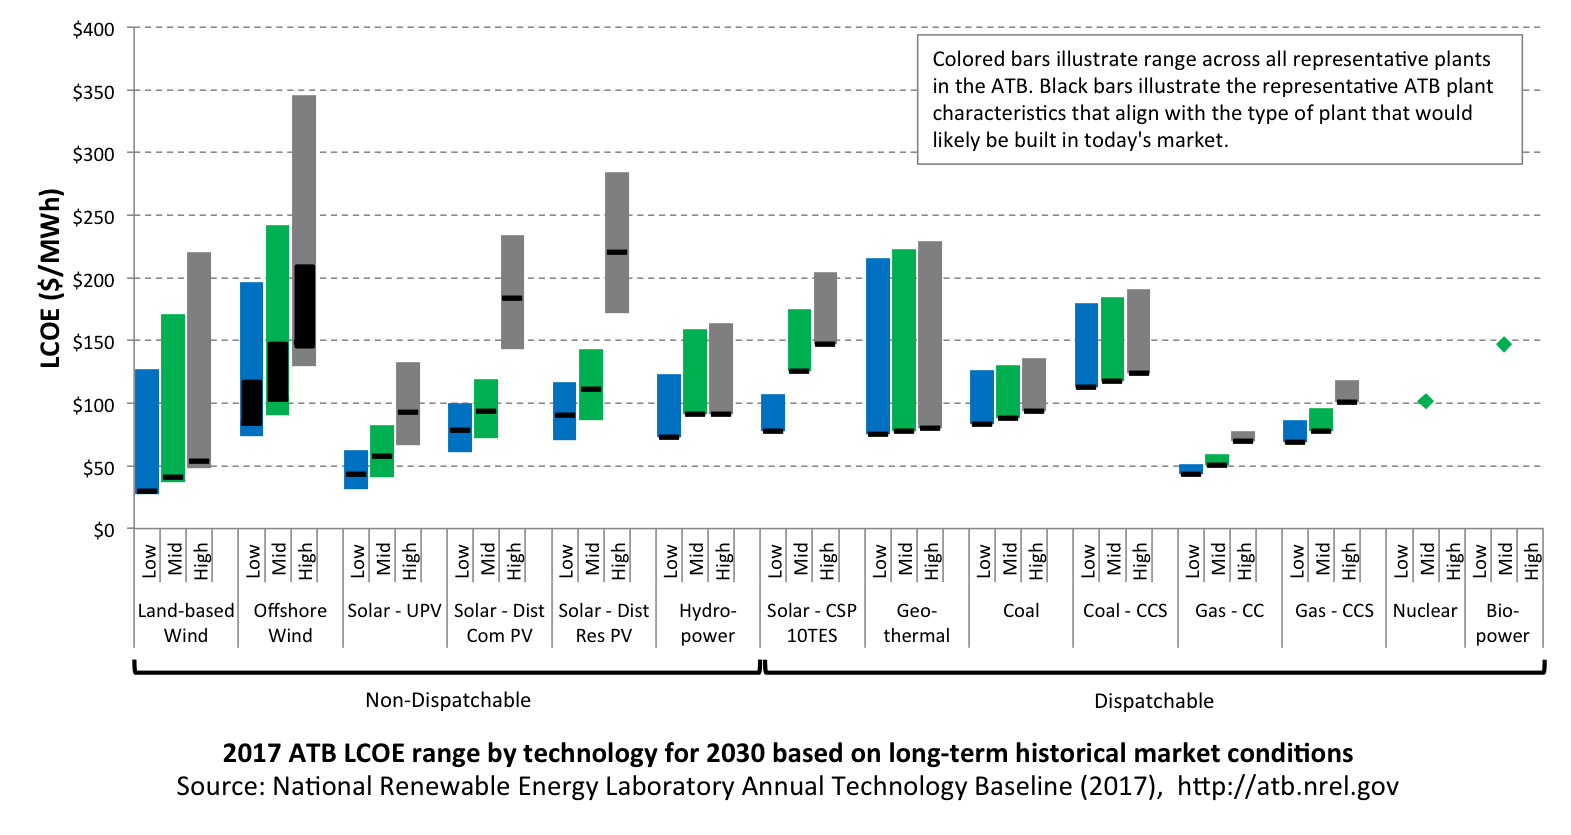
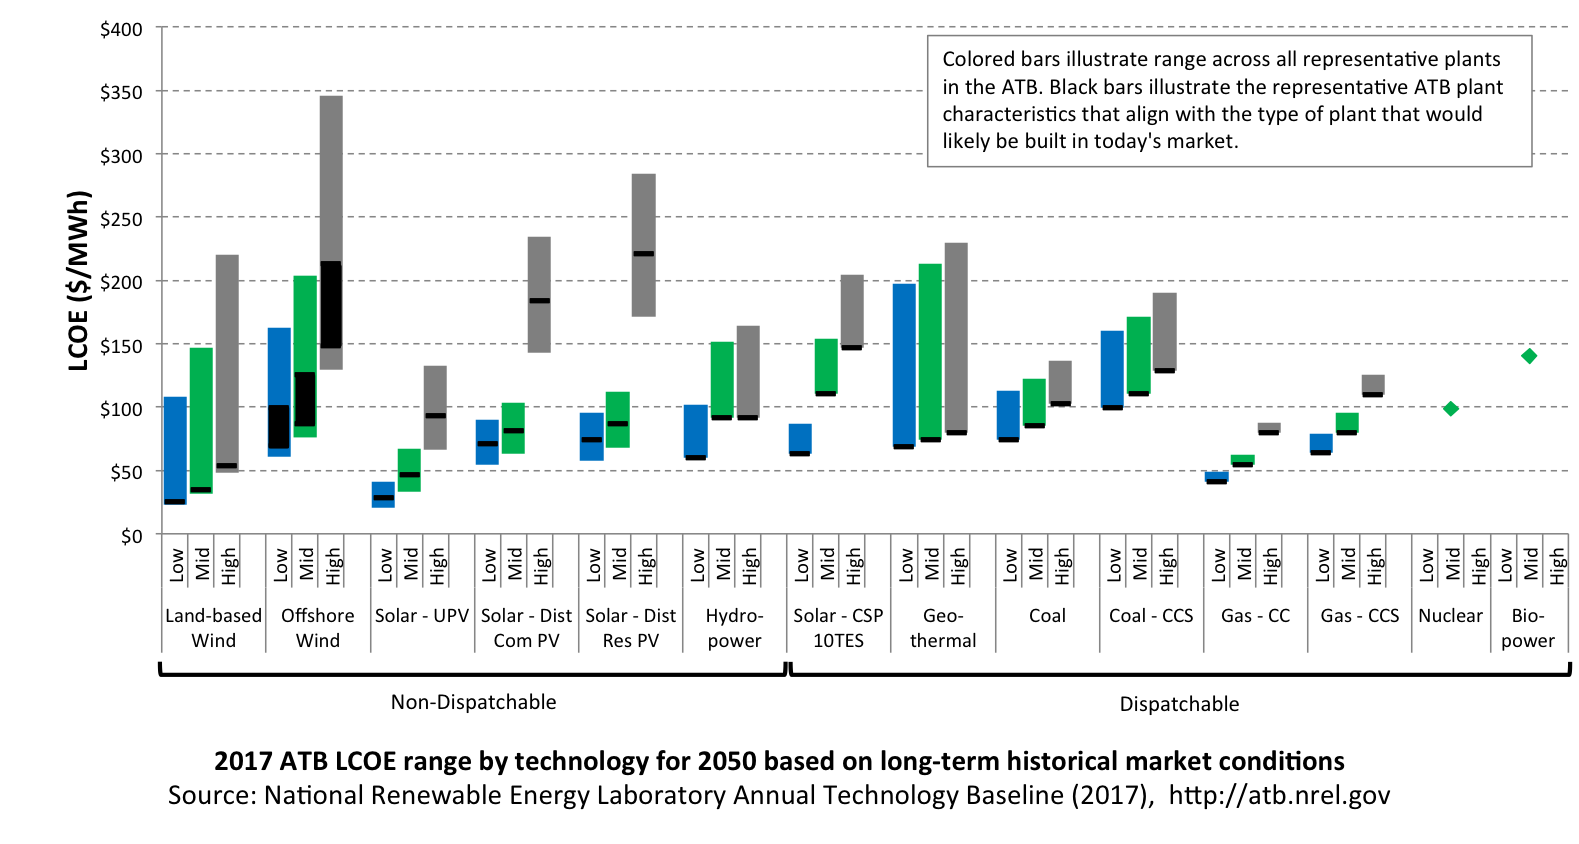
The following figures illustrate CAPEX, capacity factor, and LCOE for the Base Year (2015), 2030, and 2050. The colored bars represent the range of characteristics for all representative plants included in the ATB. The black bars reflect representative ATB plant characteristics that align most closely with recently installed or anticipated near-term installations of electricity generation plants. For the renewable technologies, the ATB representative plants span the range of resource characteristics available within the contiguous United States. For fossil fuel technologies, the colored bars illustrate the effect of capacity factor assumptions.
The ATB plant characteristics that most closely align with recently installed or anticipated near-term installations of electricity generation plants are as follows (see individual technology sections for description of ATB representative plant characteristics):
- Land-based wind — TRG 4
- Offshore wind — TRGs 3–5
- Utility-scale PV — CF 20%
- Commercial PV — CF 14.5%
- Residential PV — CF 16.1%
- CSP — Excellent
- Geothermal — Hydrothermal Flash
- Hydropower — NPD 4
- Natural gas — Gas CC – High CF and Gas-CC-CCF-High CF
- Coal — Coal-New – High CF and Coal-CCS-30%-High CF
- Nuclear — no range represented in the ATB
- Biopower — Dedicated.
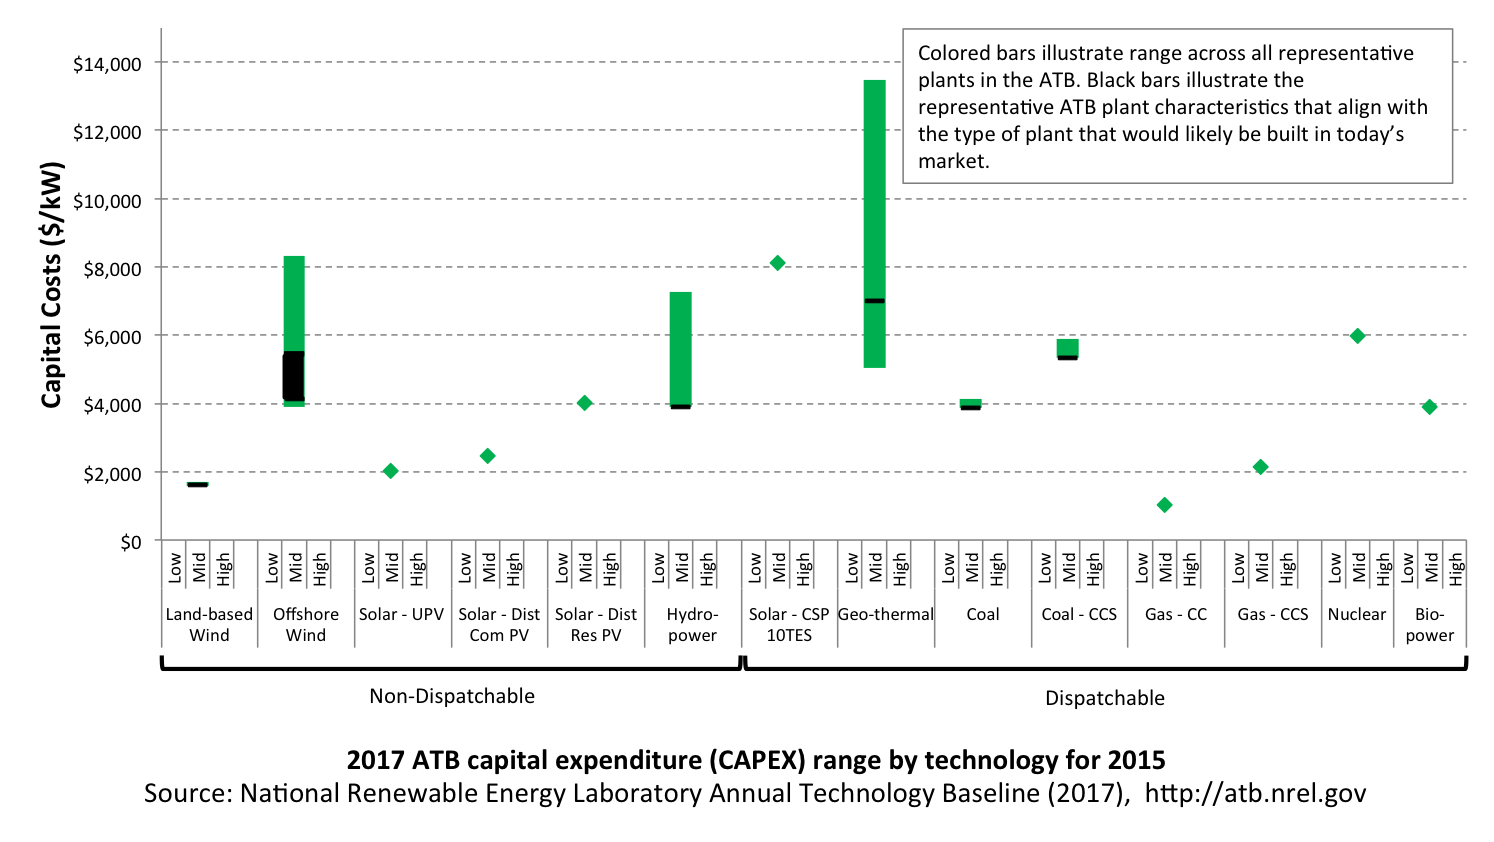
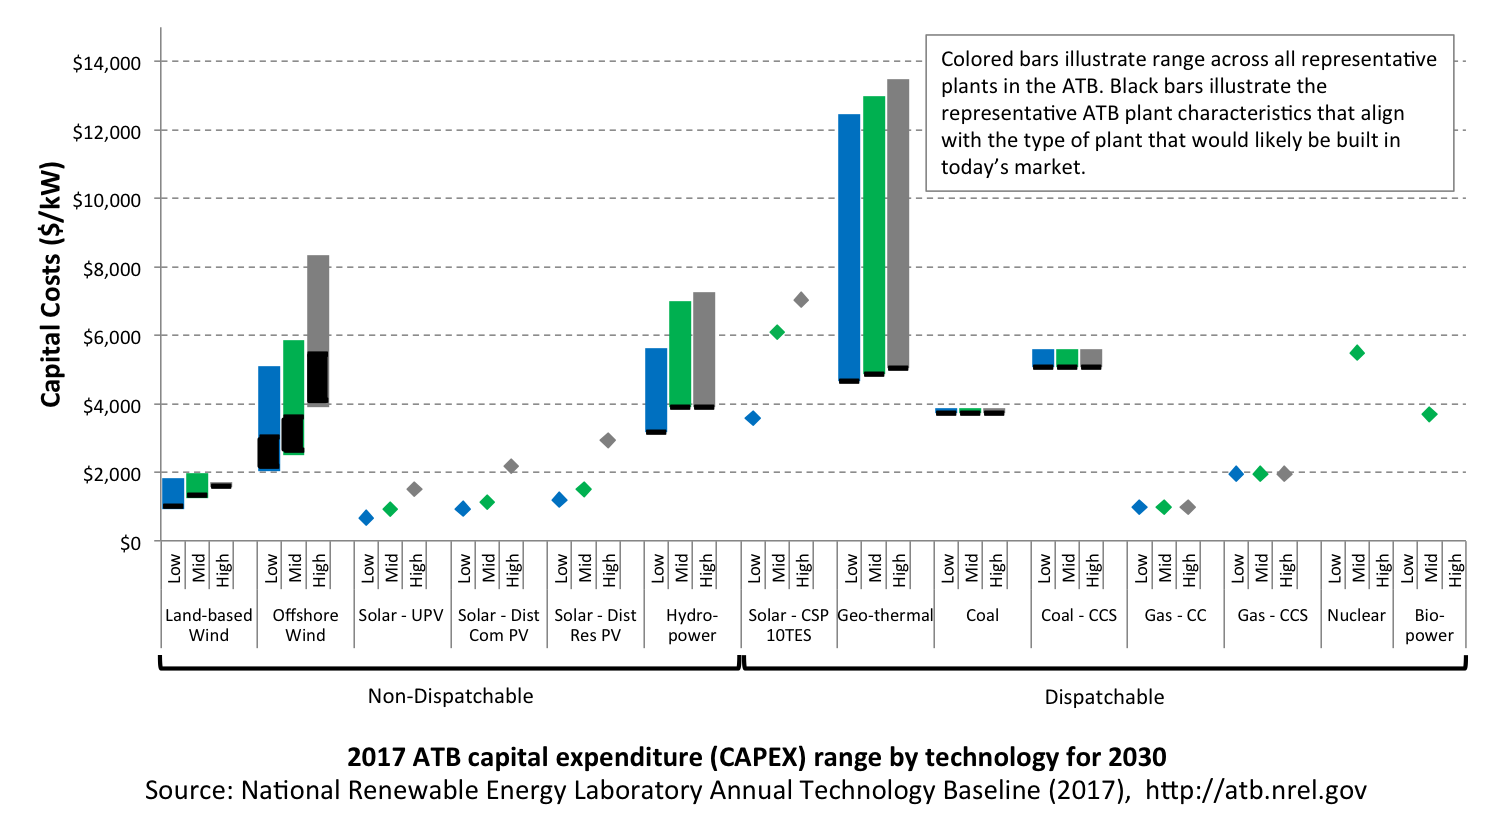
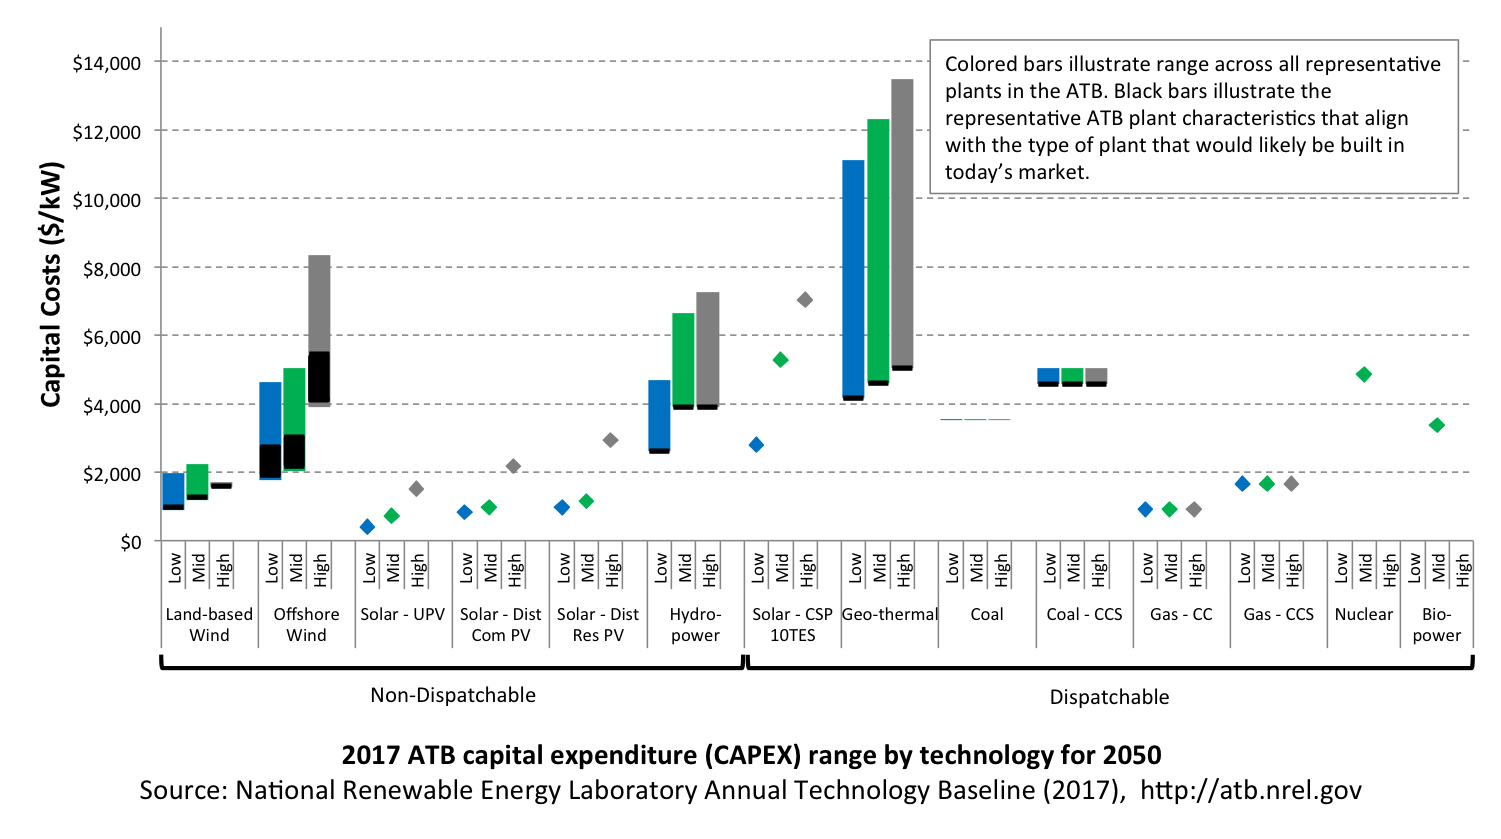
Values are in 2015$. Hydropower is classified as non-dispatchable because most new hydropower generation would be operated as run-of-river plants.
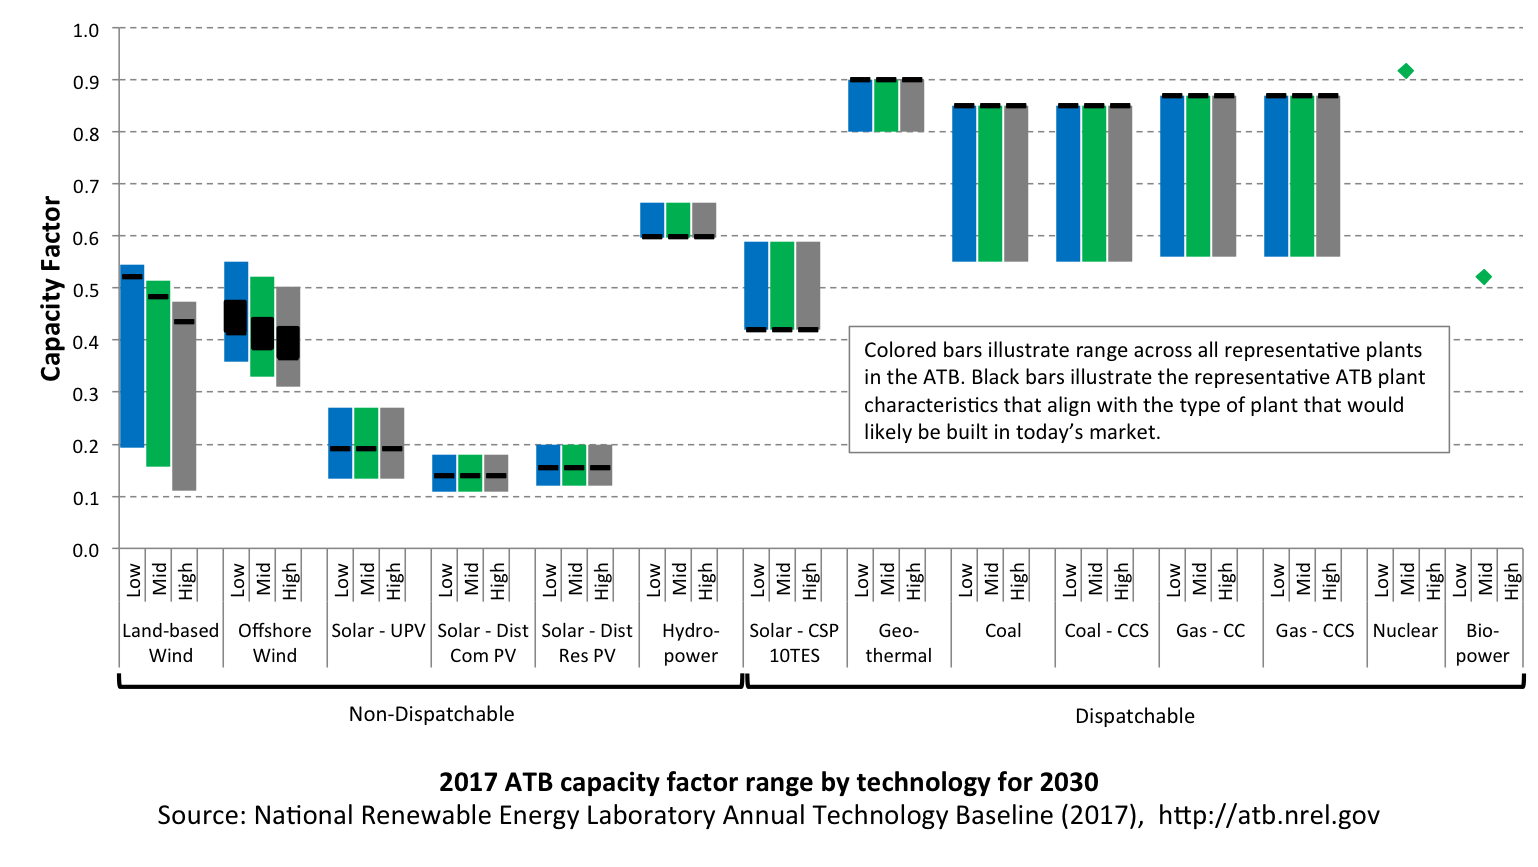
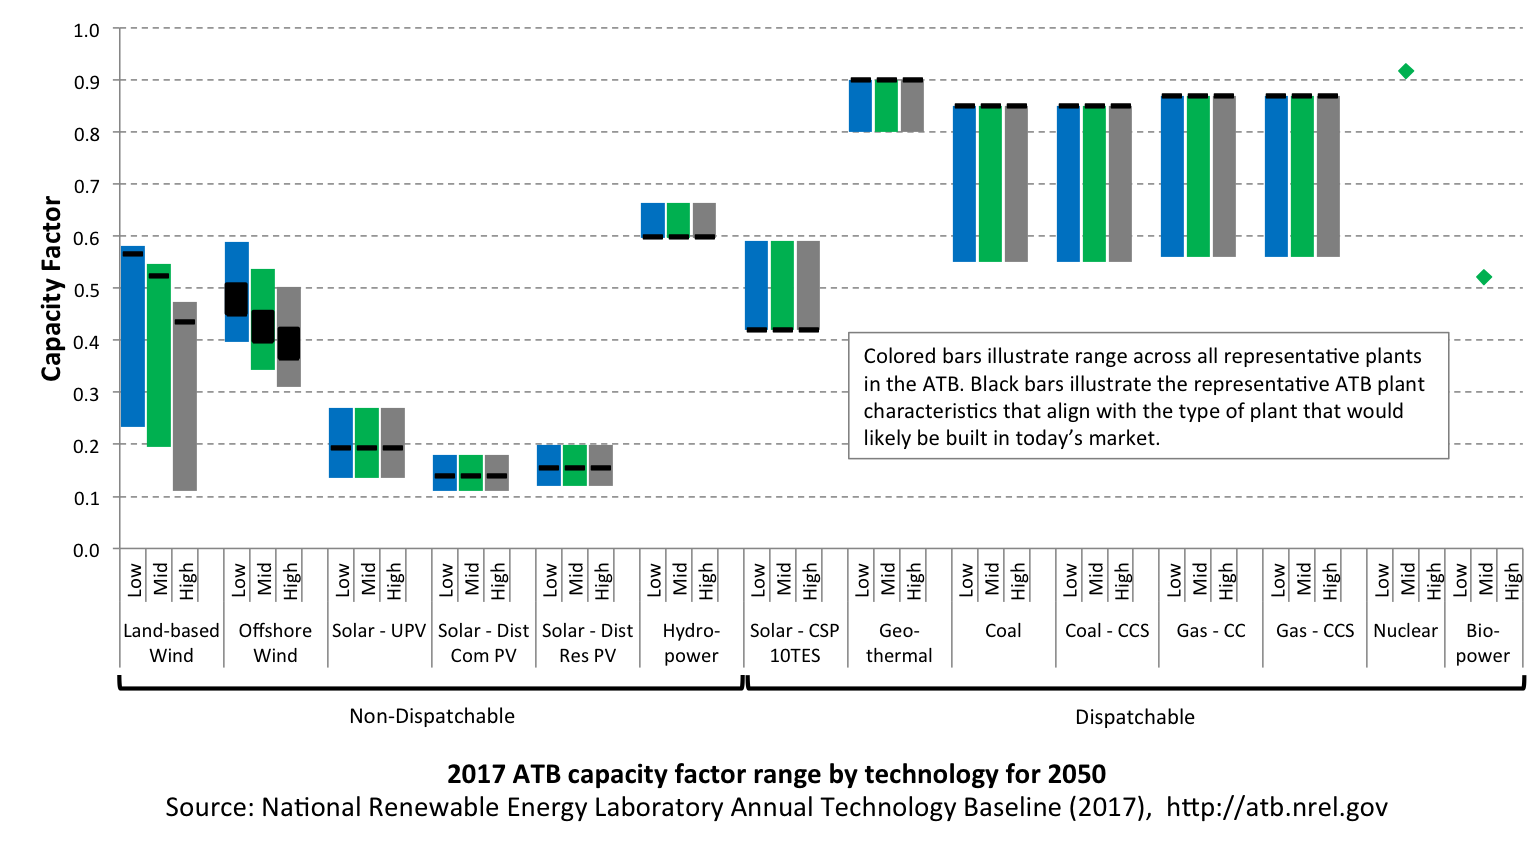
Hydropower is classified as non-dispatchable because most new hydropower generation would be operated as run-of-river plants.
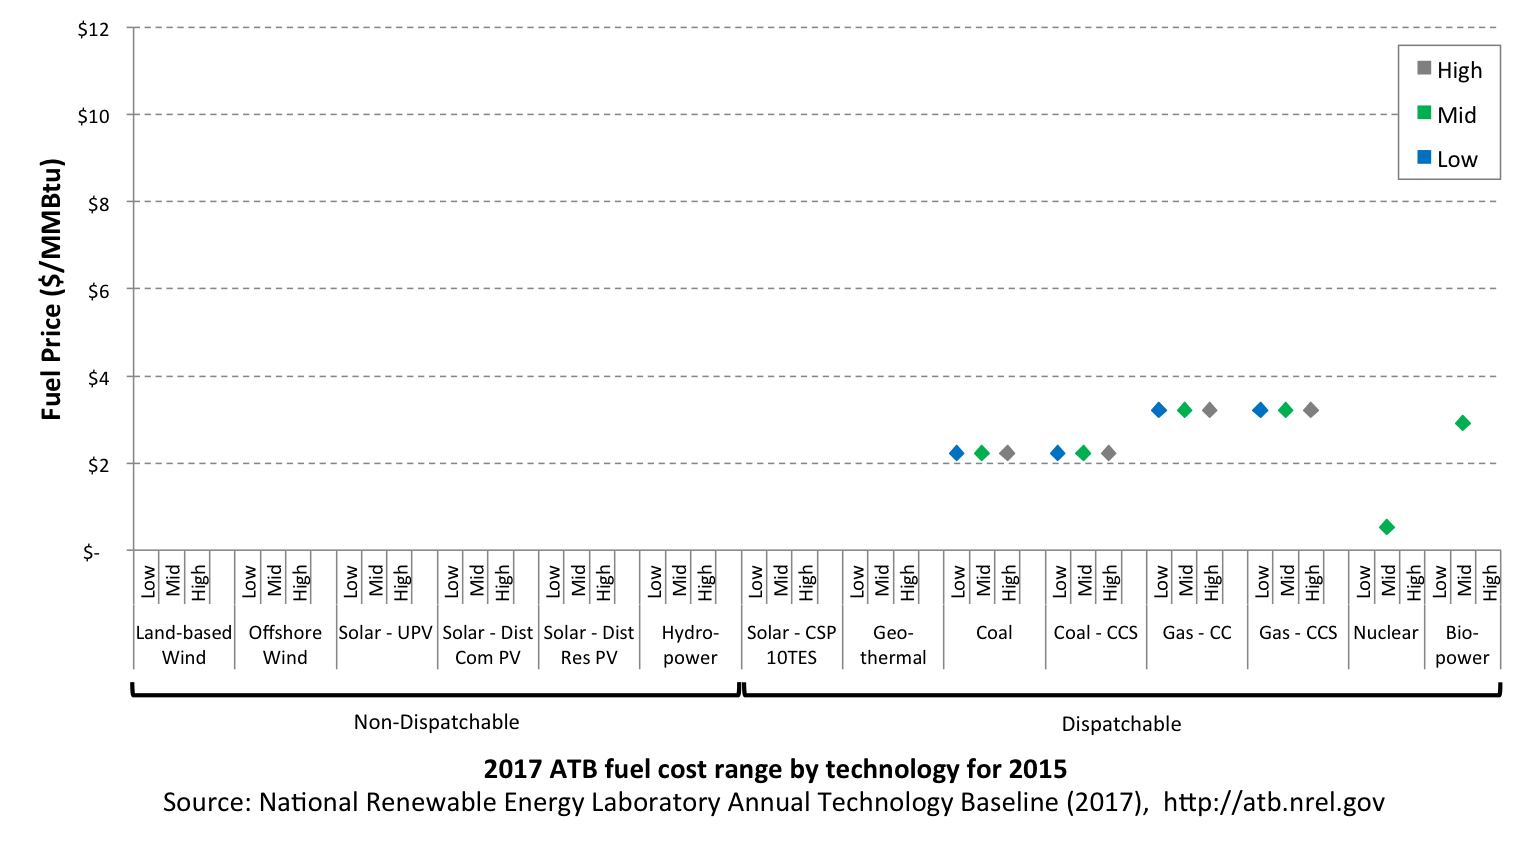
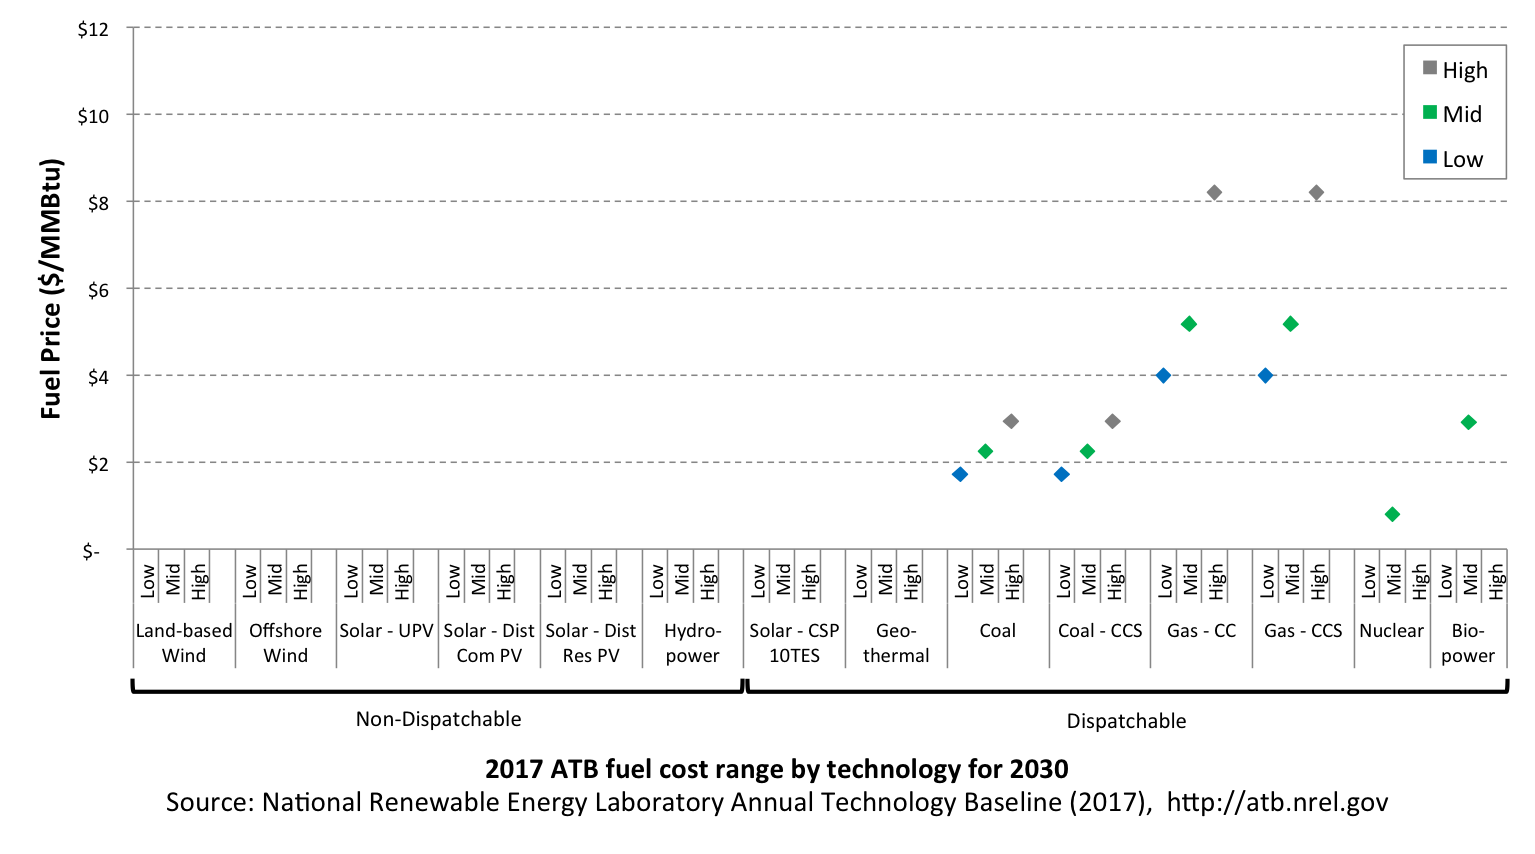
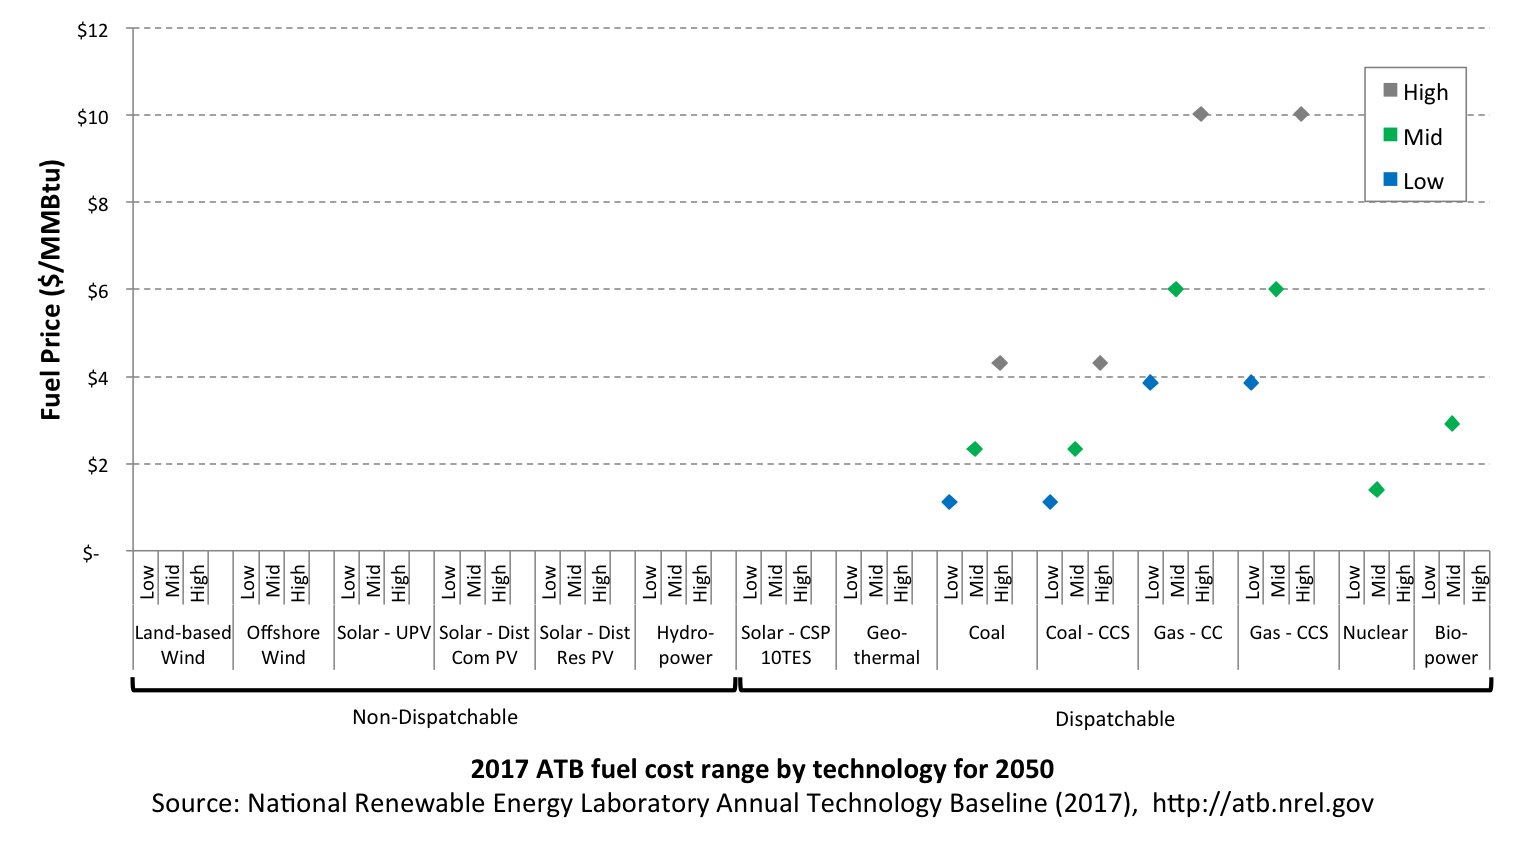
High, Mid, and Low refer to fuel prices from specific projections in EIA's Annual Energy Outlook (AEO) 2017.
Applies only to generation technologies that rely on a fuel source.
Values are in 2015$. Hydropower is classified as non-dispatchable because most new hydropower generation would be operated as run-of-river plants.
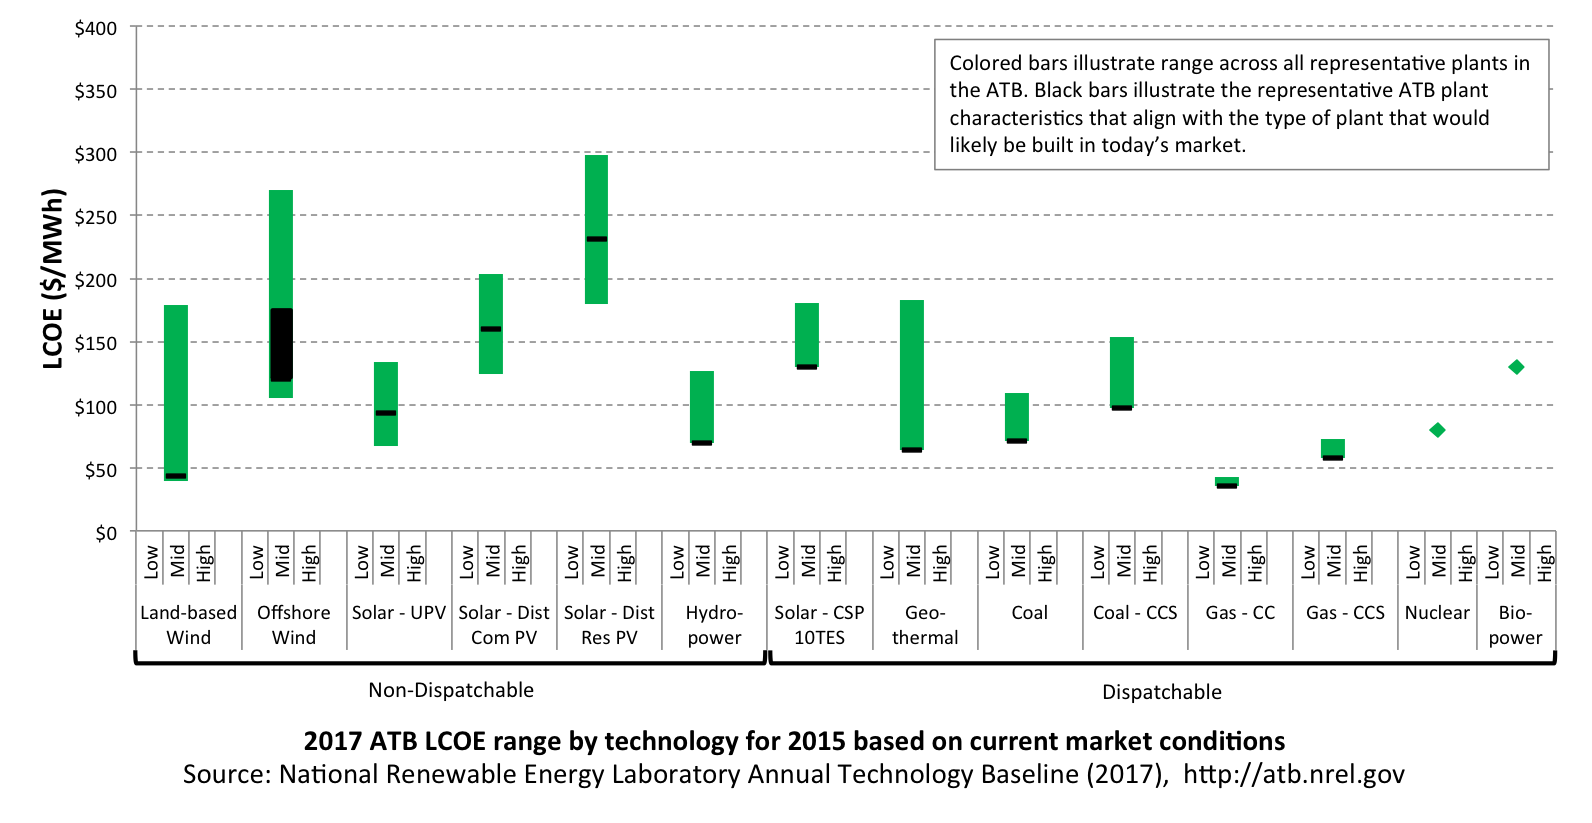
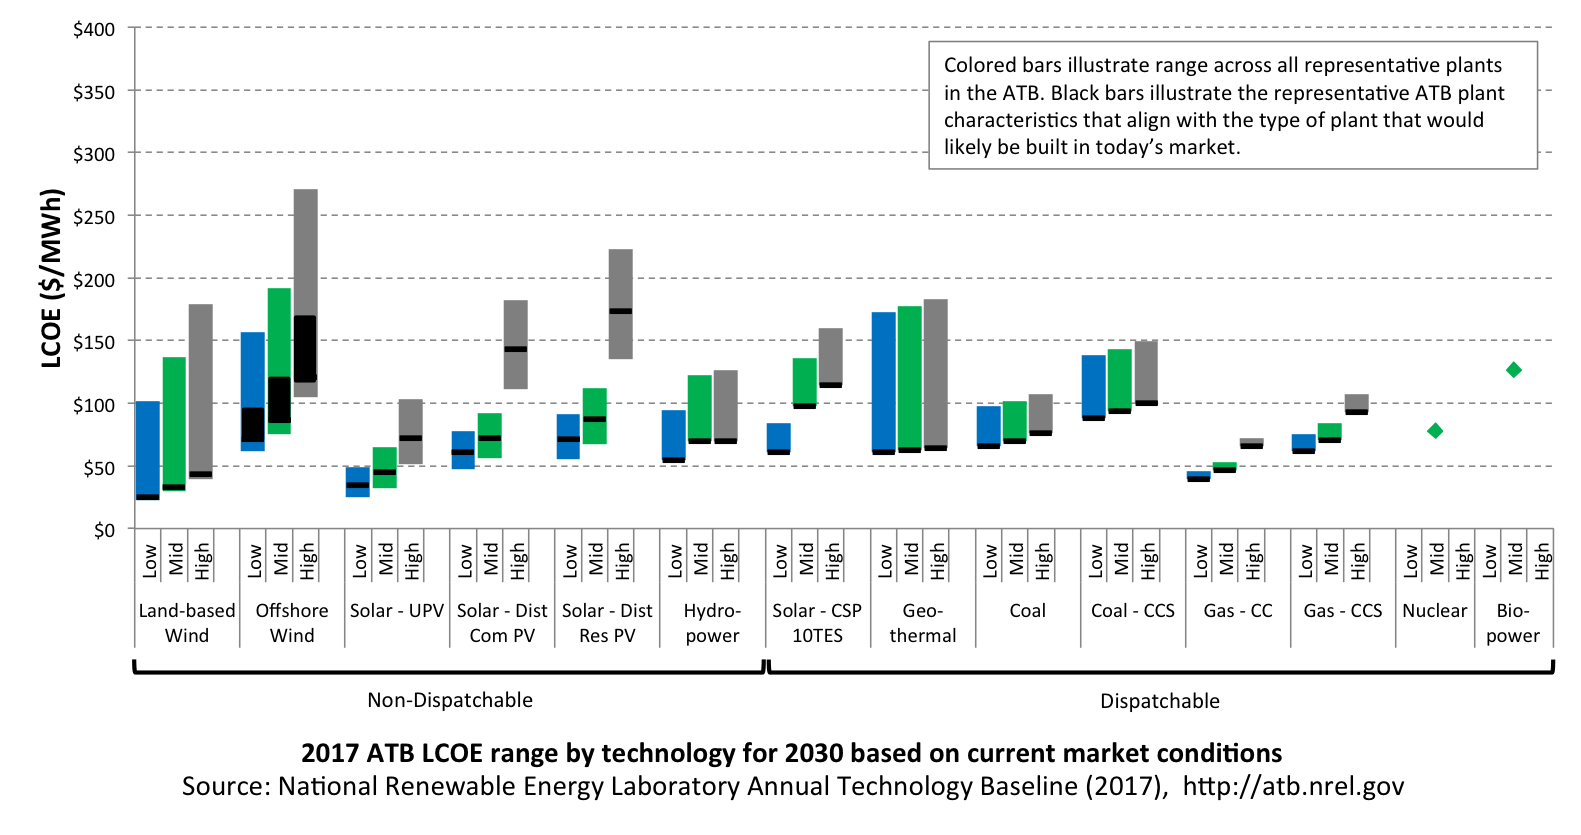
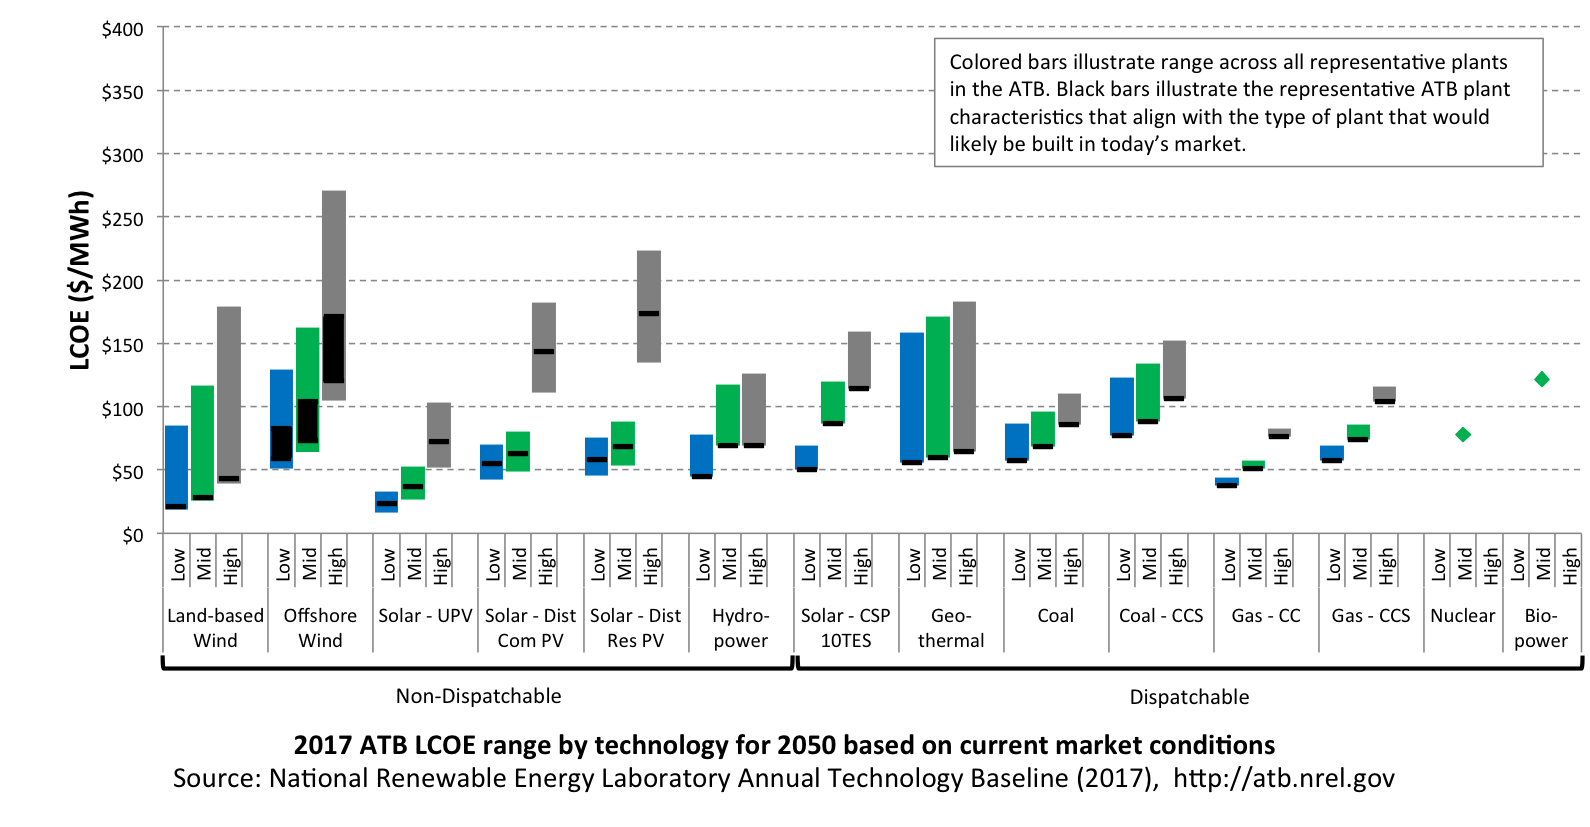
While the levelized cost of energy (LCOE) is provided as a simple or representative summary metric, it is not the focus of this work.
Hydropower is classified as non-dispatchable because most new hydropower generation would be operated as run-of-river plants.
References
EIA (U.S. Energy Information Administration). 2017. Annual Energy Outlook 2017 with Projections to 2050. Washington, D.C.: U.S. Department of Energy. January 5, 2017. http://www.eia.gov/outlooks/aeo/pdf/0383(2017).pdf.