Annual Technology Baseline 2017
National Renewable Energy Laboratory
Recommended Citation:
NREL (National Renewable Energy Laboratory). 2017. 2017 Annual Technology Baseline. Golden, CO: National Renewable Energy Laboratory. http://atb.nrel.gov/.
Please consult Guidelines for Using ATB Data:
https://atb.nrel.gov/electricity/user-guidance.html
Natural Gas Plants
CAPEX Definition
Capital expenditures (CAPEX) are expenditures required to achieve commercial operation in a given year.
Overnight capital costs are modified from EIA (2017). Capital costs include overnight capital cost plus defined transmission cost, and it removes a material price index.
Fuel costs are taken from EIA (2017). EIA reports two types of gas-CT and gas-CC technologies in the Annual Energy Outlook: advanced (H-class for gas-CC, F-class for gas-CT) and conventional (F-class for gas-CC, LM-6000 for gas-CT). Because we represent a single gas-CT and gas-CC technology in the ATB, the characteristics for the ATB plants are taken to be the average of the advanced and conventional systems as reported by EIA. For example, the OCC for the gas-CC technology in the ATB is the average of the capital cost of the advanced and conventional combined cycle technologies from the EIA's Annual Energy Outlook. Future work aims to improve the representation of the various natural gas technologies in the ATB. The CCS plant configuration includes only the cost of capturing and compressing the CO2. It does not include CO2 delivery and storage.
| Overnight Capital Cost ($/kW) | Construction Financing Factor (ConFinFactor) | CAPEX ($/kW) | |
|---|---|---|---|
| Gas-CT: Conventional combustion turbine | $864 | 1.021 | $882 |
| Gas-CC: Conventional combined cycle | $1,010 | 1.021 | $1,032 |
| Gas-CC-CCS: Combined cycle with carbon capture sequestration | $2,109 | 1.021 | $2,154 |
CAPEX can be determined for a plant in a specific geographic location as follows:
CAPEX = ConFinFactor × (OCC×CapRegMult+GCC).
(See the Financial Definitions tab in the ATB data spreadsheet.)
Regional cost variations and geographically specific grid connection costs are not included in the ATB (CapRegMult=1; GCC=0). In the ATB, the input value is overnight capital cost (OCC) and details to calculate interest during construction (ConFinFactor).
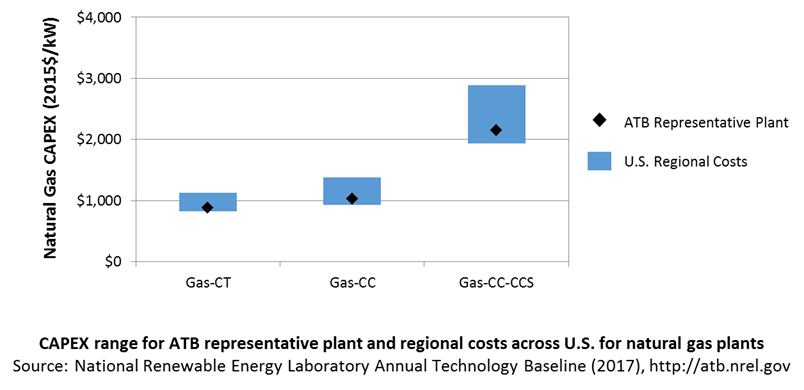
In the ATB, CAPEX represents each type of gas plant with a unique value. Regional cost effects associated with labor rates, material costs, and other regional effects as defined by EIA (2016a) expand the range of CAPEX. Unique land-based spur line costs based on distance and transmission line costs are not estimated. The following figure illustrates the ATB representative plant relative to the range of CAPEX including regional costs across the contiguous United States. The ATB representative plants are associated with a regional multiplier of 1.0.

References
EIA (U.S. Energy Information Administration). 2017. Annual Energy Outlook 2017 with Projections to 2050. Washington, D.C.: U.S. Department of Energy. January 5, 2017. http://www.eia.gov/outlooks/aeo/pdf/0383(2017).pdf.
