Annual Technology Baseline 2018
National Renewable Energy Laboratory
Recommended Citation:
NREL (National Renewable Energy Laboratory). 2018. 2018 Annual Technology Baseline. Golden, CO: National Renewable Energy Laboratory. http://atb.nrel.gov/.
Please consult Guidelines for Using ATB Data:
https://atb.nrel.gov/electricity/user-guidance.html
Coal
CAPEX Definition
Capital expenditures (CAPEX) are expenditures required to achieve commercial operation in a given year.
For coal power plants, CAPEX equals interest during construction (ConFinFactor) times the overnight capital cost (OCC).
Overnight capital costs are modified from EIA (2017). Capital costs include overnight capital cost plus defined transmission cost, and it removes a material price index.
Fuel costs, which are just passed through to end user, are taken from EIA (2017).
For the ATB, coal-CCS technology is ultra-supercritical pulverized coal technology fitted with CCS. Both 30% capture and 90% capture options are included for the coal-CCS technology. The CCS plant configuration includes only the cost of capturing and compressing the CO2. It does not include CO2 delivery and storage.
| Overnight Capital Cost ($/kW) | Construction Financing Factor (ConFinFactor) | CAPEX ($/kW) | |
|---|---|---|---|
| Coal-new:Ultra-supercritical pulverized coal with SO2 and NOx controls | $3.559 | 1.084 | $3,859 |
| Coal-IGCC:Integrated gasification combined cycle (IGCC) | $3,819 | 1.084 | $4,141 |
| Coal-CCS:Ultra-supercritical pulverized coal with carbon capture and sequestration (CCS) options (30% / 90% capture) | $4,927 / $5,448 | 1.084 | $5,341 / $5,906 |
CAPEX can be determined for a plant in a specific geographic location as follows:
Regional cost variations and geographically specific grid connection costs are not included in the ATB (CapRegMult = 1; GCC = 0). In the ATB, the input value is overnight capital cost (OCC) and details to calculate interest during construction (ConFinFactor).
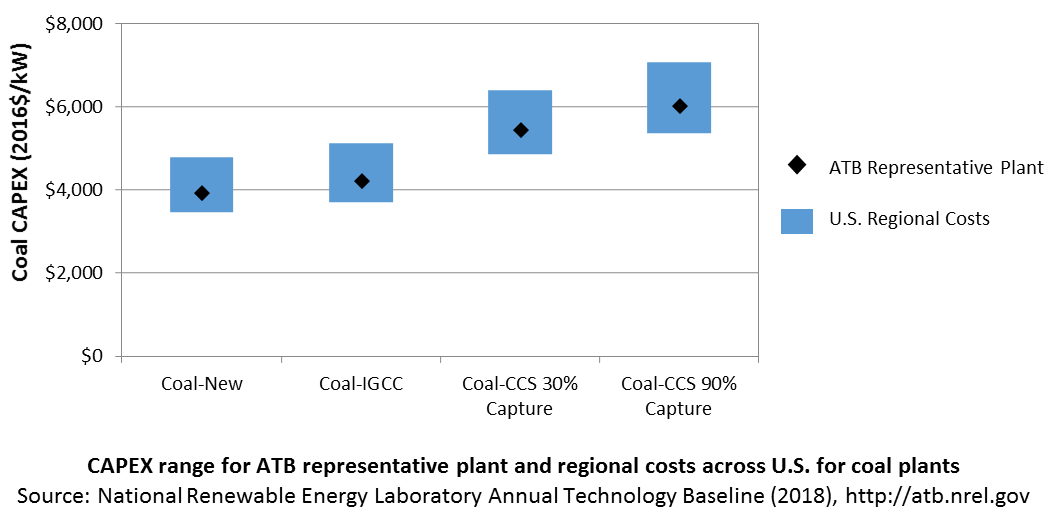
In the ATB, CAPEX represents each type of a coal plant with a unique value. Regional cost effects associated with labor rates, material costs, and other regional effects as defined by EIA 2016a expand the range of CAPEX. Unique land-based spur line costs based on distance and transmission line costs are not estimated. The following figure illustrates the ATB representative plant relative to the range of CAPEX including regional costs across the contiguous United States. The ATB representative plants are associated with a regional multiplier of 1.0.

References
Annual Energy Outlook 2017 with Projections to 2050. Washington, D.C.: U.S. Department of Energy. January 5, 2017. http://www.eia.gov/outlooks/aeo/pdf/0383(2017).pdf.
EIA (U.S. Energy Information Administration). 2016a. Capital Cost Estimates for Utility Scale Electricity Generating Plants. Washington, D.C.: U.S. Department of Energy. November 2016. https://www.eia.gov/analysis/studies/powerplants/capitalcost/pdf/capcost_assumption.pdf.
