2019 ATB
For each electricity generation technology in the ATB, this website provides:
- Capital expenditures (CAPEX): the definition of CAPEX used in the ATB and the historical trends, current estimates, and future projections of CAPEX used in the ATB
- Operations and maintenance (O&M) costs: the definition of O&M and the current estimates and future projections of O&M used in the ATB
- Capacity factor (CF): the definition of CF and the historical trends, current estimates, and future projections of CF used in the ATB
- Future cost and performance methods: an outline of the methodology used to make the projections of future cost and performance in the ATB for Constant, Mid, and Low technology cost cases
- Levelized cost of energy (LCOE): metric that combines CAPEX, O&M, CF, and projections for Constant, Mid, and Low technology cost cases for illustration of the combined effect of the primary cost and performance components and discussion of technology advances that yield future projections
- Financing assumptions: development of technology-specific interest rate on debt, return on equity, and debt-to-equity ratios and their impact on LCOE are documented in each technology section, where applicable, and summarized here.
Electricity generation technologies are selected on the left side of the screen, and the topics highlighted above can be selected using the drop-down menu at the top right of the screen.
Guidelines for using and interpreting ATB content and comparisons to other literature are provided. LCOE accounts for many variables important to determining the competitiveness of building and operating a specific technology (e.g., upfront capital costs, capacity factor, and cost of financing); however, it does not necessarily demonstrate which technology in a given place and time would provide the lowest cost option for the electricity grid. Such analysis is performed using electric sector models such as the Regional Energy Deployment Systems (ReEDS) model and corresponding analysis results such as the NREL Standard Scenarios.
The NREL Standard Scenarios, a companion product to the ATB, provides a suite of electric sector scenarios and associated assumptions, including technology cost and performance assumptions from the ATB.
ATB data sources and references are also provided for each technology. All dollar values are presented in 2017 U.S. dollars, unless noted otherwise.
Additional information is available here: About the 2019 ATB.
Commercial PV
Representative Technology
For the ATB, commercial PV systems are modeled for a 300-kWDC fixed-tilt (5°), roof-mounted system. Flat-plate PV can take advantage of direct and indirect insolation, so PV modules need not directly face and track incident radiation. This gives PV systems a broad geographical application, especially for commercial PV systems.
Resource Potential
Solar resources across the United States are mostly good to excellent at about 1,000-2,500 kWh)/m2/year. The Southwest is at the top of this range, while only Alaska and part of Washington are at the low end. The range for the contiguous United States is about 1,350-2,500 kWh/m2/year. Nationwide, solar resource levels vary by about a factor of two.
Distributed-scale PV is assumed to be configured as a fixed-tilt, roof-mounted system. Compared to utility-scale PV, this reduces both the potential capacity factor and amount of land (roof space) that is available for development. A recent study of rooftop PV technical potential (Gagnon et al. 2016) estimated that as much as 731 GW (926 TWh/yr) of potential exists for small buildings (< 5,000 m2 footprint) and 386 GW (506 TWh/yr) for medium (5,000-25,000 m2) and large buildings (> 25,000 m2).
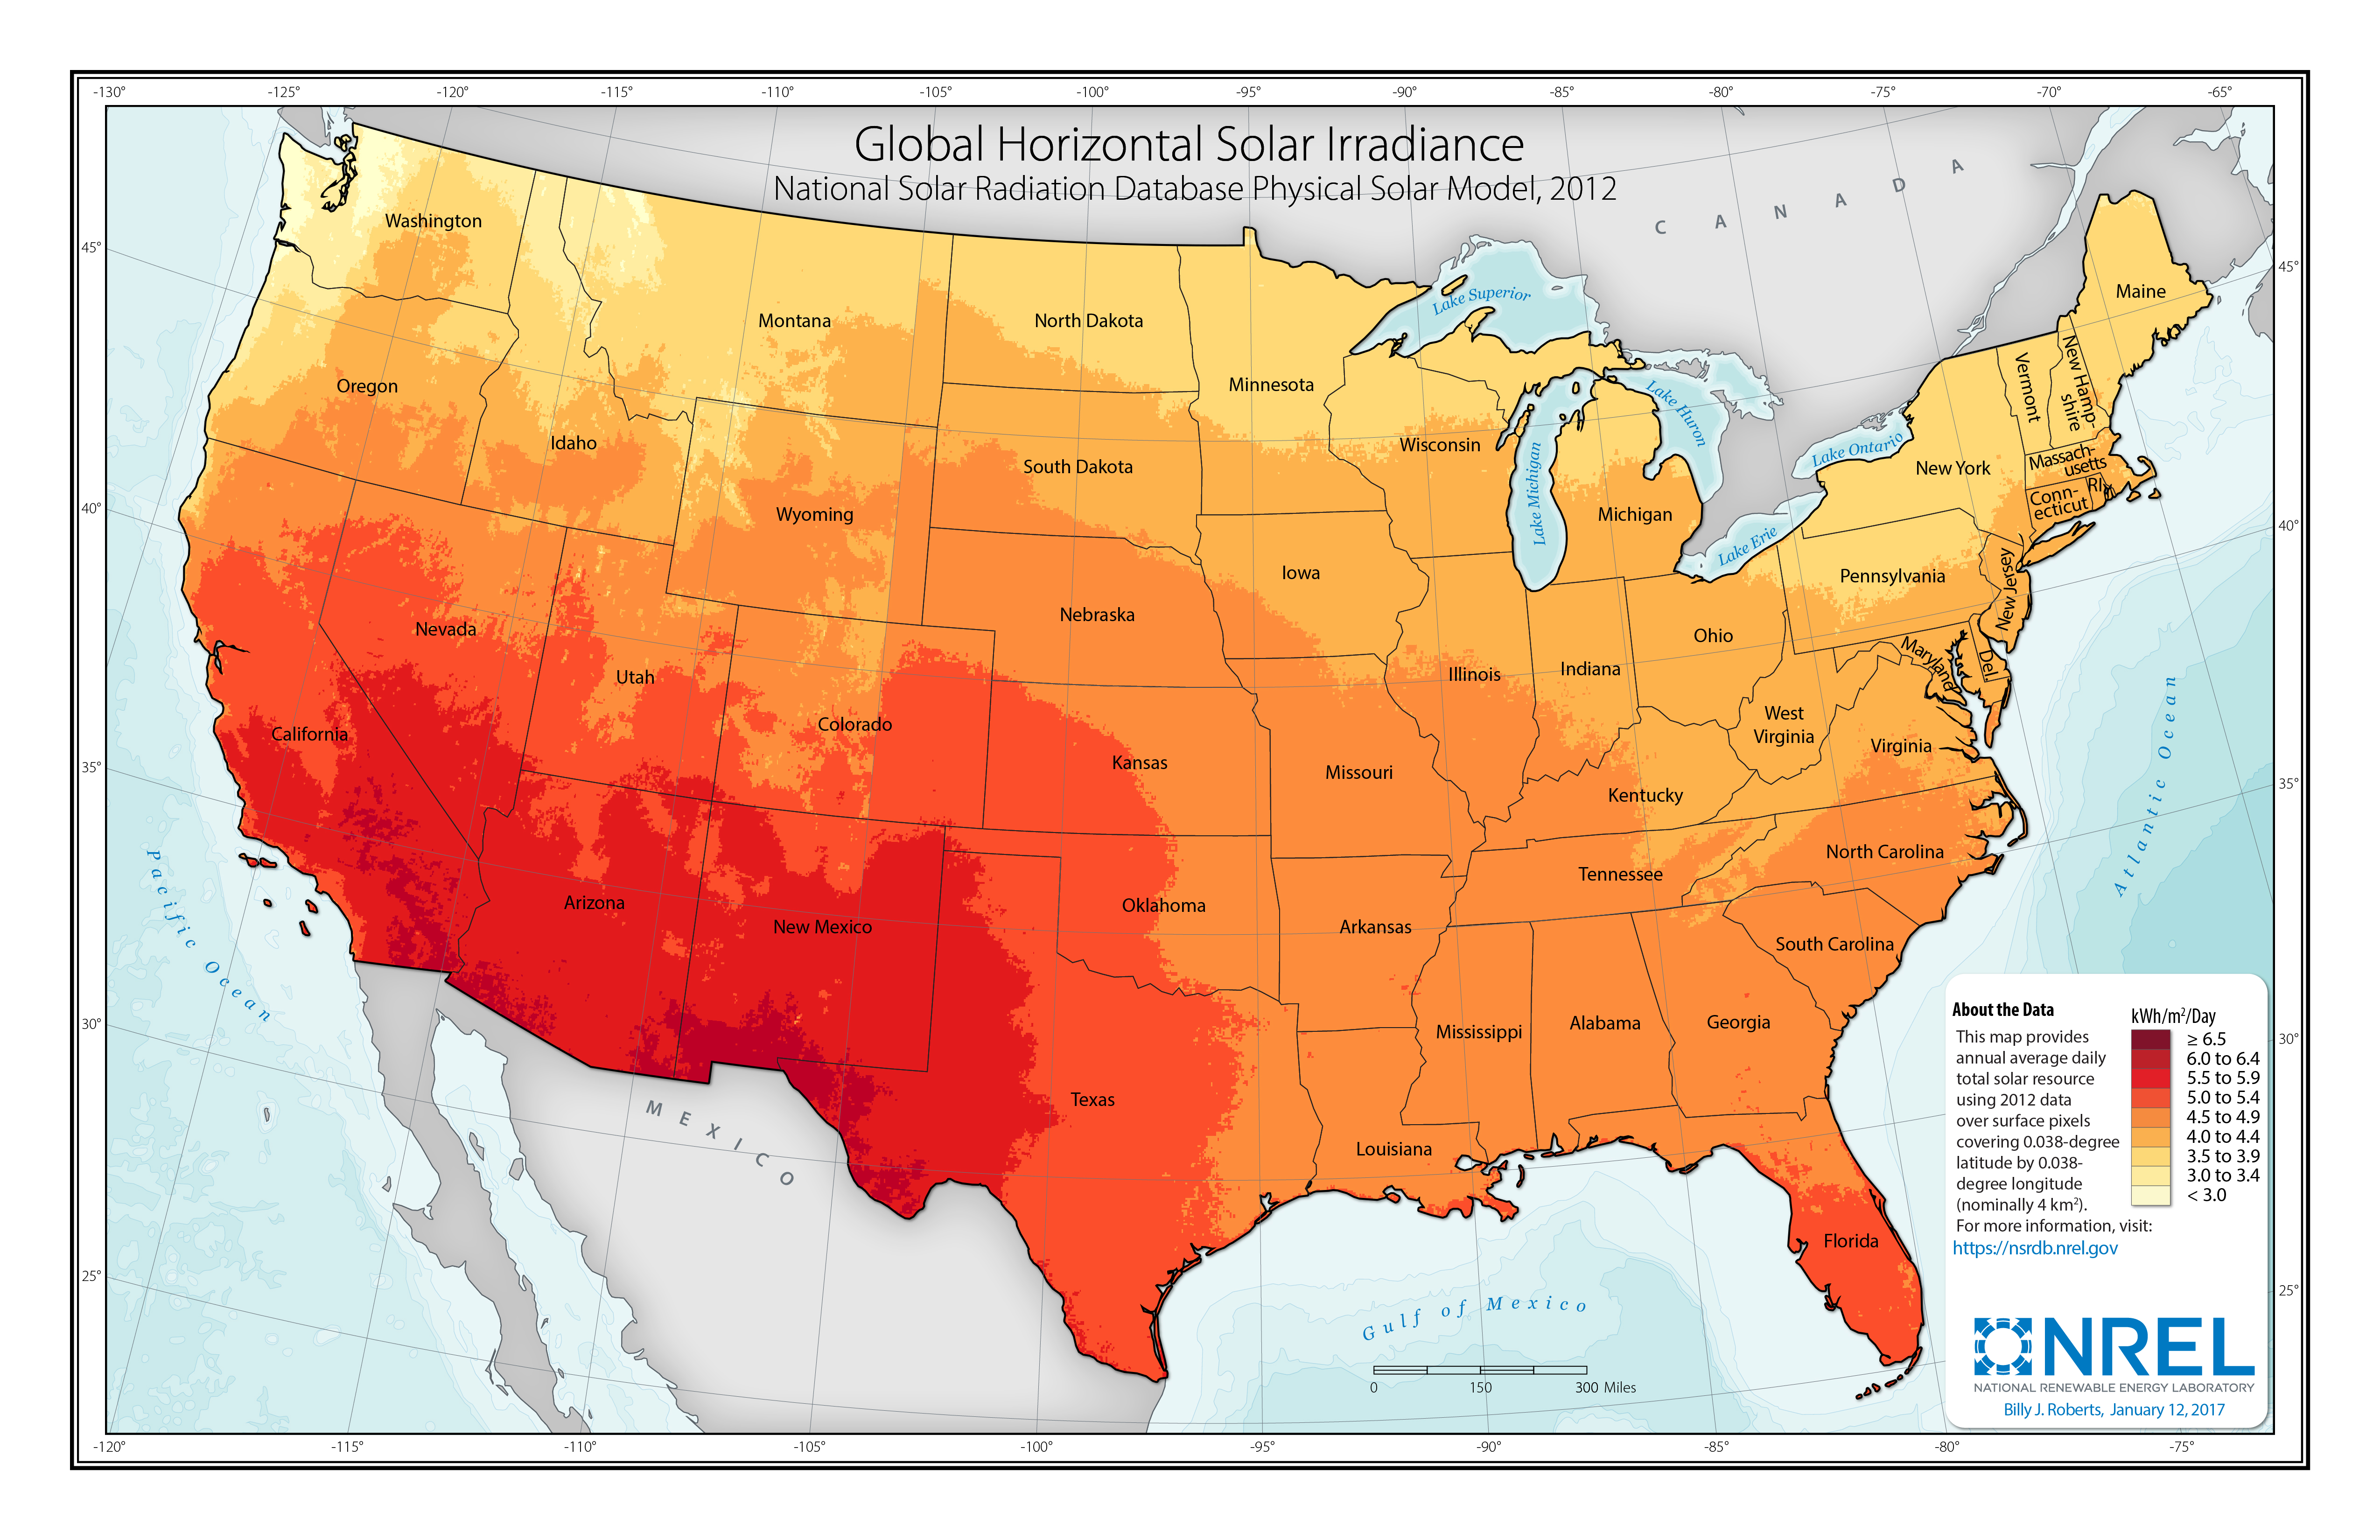
Renewable energy technical potential, as defined by Lopez et al. (2012), represents the achievable energy generation of a particular technology given system performance, topographic limitations, and environmental and land-use constraints. The primary benefit of assessing technical potential is that it establishes an upper-boundary estimate of development potential. It is important to understand that there are multiple types of potential – resource, technical, economic, and market (see NREL: "Renewable Energy Technical Potential").
Base Year and Future Year Projections Overview
The Base Year estimates rely on modeled CAPEX and O&M estimates benchmarked with industry and historical data. Capacity factor is estimated based on hours of sunlight at latitude for five representative geographic locations in the United States.
Future year projections are derived from analysis of published projections of PV CAPEX and bottom-up engineering analysis of O&M costs. Three different projections were developed for scenario modeling as bounding levels:
- Constant Technology Cost Scenario: no change in CAPEX, O&M, or capacity factor from 2017 to 2050; consistent across all renewable energy technologies in the ATB
- Mid Technology Cost Scenario: based on the median of literature projections of future CAPEX and O&M technology pathway analysis
- Low Technology Cost Scenario: based on the low bound of literature projections of future CAPEX and O&M technology pathway analysis.
Capital Expenditures (CAPEX): Historical Trends, Current Estimates, and Future Projections
Capital expenditures (CAPEX) are expenditures required to achieve commercial operation in a given year. These expenditures include the hardware, the balance of system (e.g., site preparation, installation, and electrical infrastructure), and financial costs (e.g., development costs, onsite electrical equipment, and interest during construction) and are detailed in CAPEX Definition. In the ATB, CAPEX reflects typical plants and does not include differences in regional costs associated with labor, materials, taxes, or system requirements. The related Standard Scenarios product uses Regional CAPEX Adjustments. The range of CAPEX demonstrates variation with resource in the contiguous United States.
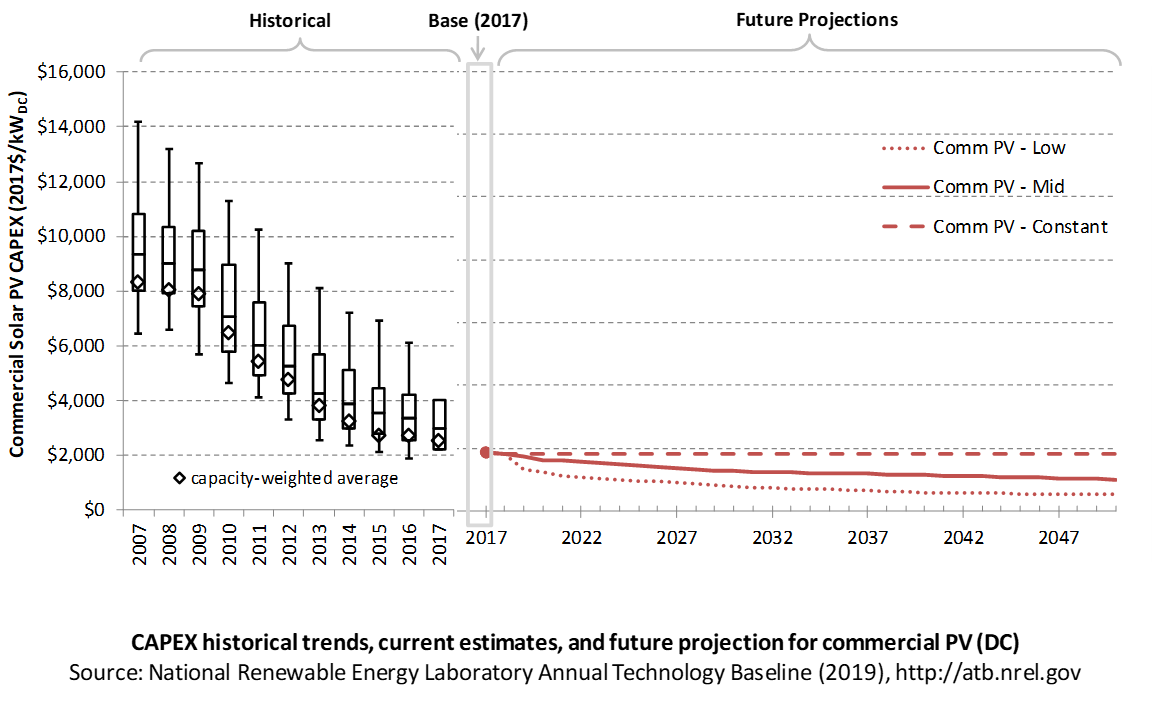
The following figure shows the Base Year estimate and future year projections for CAPEX costs. Three technology cost scenarios are represented: Constant, Mid, and Low. Historical data from commercial PV installed in the United States are shown for comparison to the ATB Base Year estimates. The estimate for a given year represents CAPEX of a new plant that reaches commercial operation in that year.
Recent Trends
Reported historical commercial-scale PV installation CAPEX (Barbose and Dargouth 2018) is shown in box-and-whiskers format for comparison to historical commercial-scale PV benchmark overnight capital cost and ATB future CAPEX projections. The data in Barbose and Dargouth (2018) represent 81% of all U.S. residential and commercial PV capacity installed through 2017 and 75% of capacity installed in 2017.
The difference in each year's price between the market and benchmark data reflects differences in methodologies. There are a variety of reasons reported and benchmark prices can differ, as enumerated by Barbose and Dargouth (2018) and Bolinger and Seel (2018), including:
- Timing-related issues: For instance, the time between contract completion date and project placed in service may vary.
- Variations over time in the size, technology, installer margin, and design of systems installed in a given year
- Which cost categories are included in CAPEX (e.g., financing costs and initial O&M expenses).
Due to the investment tax credit, projects are encouraged to include as many costs incurred in the upfront CAPEX to receive a higher tax credit, which may have otherwise been reported as operating costs. The bottom-up benchmarks are more reflective of an overnight capital cost, which is in line with the ATB methodology of inputting overnight capital cost and calculating construction financing to derive CAPEX.
PV pricing and capacities are quoted in kWDC (i.e., module rated capacity) unlike other generation technologies, which are quoted in kWAC. For PV, this would correspond to the combined rated capacity of all inverters. This is done because kWDC is the unit that the majority of the PV industry uses. Although costs are reported in kWDC, the total CAPEX includes the cost of the inverter, which has a capacity measured in kWAC.
CAPEX estimates for 2018 reflect continued rapid decline in pricing supported by analysis of recent system pricing for projects that became operational in 2018 (Feldman and Margolis 2018).
The range in CAPEX estimates reflects the heterogeneous composition of the commercial PV market in the United States.
Base Year Estimates
For illustration in the ATB, a representative commercial-scale PV installation is shown. Although the PV technologies vary, typical installation costs are represented with a single estimate because the CAPEX does not vary with solar resource.
Although the technology market share may shift over time with new developments, the typical installation cost is represented with the projections above.
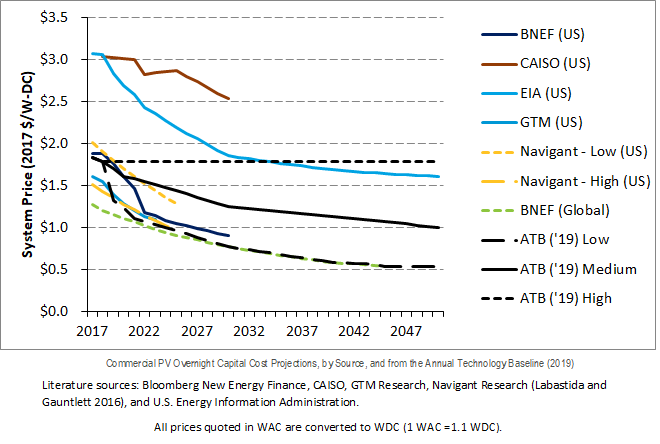
A system price of $1.83/WDC in 2017 and $1.79/WDC in 2018 are based on bottom-up benchmark analysis reported in U.S. Solar Photovoltaic System Cost Benchmark Q1 2018 (Fu, Feldman, and Margolis 2018), adjusted for inflation. The 2017 and 2018 bottom-up benchmarks are reflective of an overnight capital cost, which is in line with the ATB methodology of inputting overnight capital cost and calculating construction financing to derive CAPEX. These figures are in line with other estimated system prices reported by Feldman and Margolis (2018).
The Base Year CAPEX estimates should tend toward the low end of observed cost because no regional impacts are included. These effects are represented in the historical market data.
Future Year Projections
Projections of future commercial PV installation CAPEX are based on seven system price projections from five separate institutions. We adjusted the "min," "median," and "max" projections in a few different ways. All 2017 pricing is based on the capacity-weighted average historically reported commercial PV prices reported in Tracking the Sun XI (Barbose and Dargouth 2018). All 2018 pricing is based on the bottom-up benchmark analysis reported in U.S. Solar Photovoltaic System Cost Benchmark Q1 2018 (Fu, Feldman, and Margolis 2018). These figures are in line with other estimated system prices reported in Q2/Q3 2018 Solar Industry Update (Feldman and Margolis 2018).
We adjusted the Mid and Low projections for 2019-2050 to remove distortions caused by the combination of forecasts with different time horizons and based on internal judgment of price trends. For the Constant technology cost scenario, the 2018 CAPEX value is held constant, assuming no improvements beyond 2018.
A detailed description of the methodology for developing future year projections is found in Projections Methodology.
Technology innovations that could impact future CAPEX costs are summarized in LCOE Projections.
CAPEX Definition
Capital expenditures (CAPEX) are expenditures required to achieve commercial operation in a given year. For commercial PV, this is modeled for a host-owned business model only with access to debt.
For the ATB, and based on EIA (2016b) and the NREL Solar-PV Cost Model (Fu, Feldman, and Margolis 2018), the distributed solar PV plant envelope is defined to include:
- Hardware
- Module supply
- Power electronics
- Racking
- Foundation
- AC and DC materials and installation
- Balance of system (BOS)
- Site and/or roof preparation
- Permitting, inspection, and interconnection costs
- Project indirect costs, including costs related to engineering, distributable labor and materials, construction management start up and commissioning, and contractor overhead costs, fees, and profit
- Financial costs
- Owners costs, such as development costs, legal fees, and insurance costs
- Depreciation and interest on debt (ConFinFactor).
CAPEX can be determined for a plant in a specific geographic location as follows:
Regional cost variations are not included in the ATB (CapRegMult = 1). Because distributed PV plants are located directly at the end use, there are no grid connection costs (GCC = 0). In the ATB, the input value is overnight capital cost (OCC) and details to calculate interest during construction (ConFinFactor).
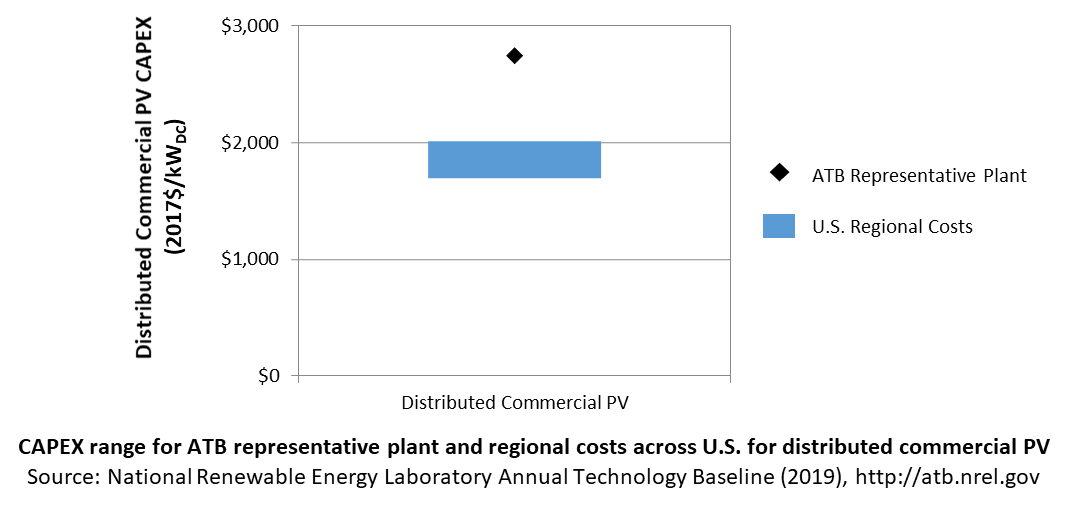
In the ATB, CAPEX represents a typical distributed residential/commercial PV plant and does not vary with resource. Regional cost effects associated with labor rates, material costs, and other regional effects as defined by EIA (2016b) expand the range of CAPEX. Unique land-based spur line costs based on distance and transmission line costs are not estimated. The following figure illustrates the ATB representative plant relative to the range of CAPEX including regional costs across the contiguous United States. The ATB representative plants are associated with a regional multiplier of 1.0.
Standard Scenarios Model Results
ATB CAPEX, O&M, and capacity factor assumptions for the Base Year and future projections through 2050 for Constant, Mid, and Low technology cost scenarios are used to develop the NREL Standard Scenarios using the ReEDS model. See ATB and Standard Scenarios.
CAPEX in the ATB does not represent regional variants (CapRegMult) associated with labor rates, material costs, etc., but dSolar does include state-level cost multipliers (EIA 2016b).
Operation and Maintenance (O&M) Costs
Operations and maintenance (O&M) costs represent the annual expenditures required to operate and maintain a solar PV plant over its lifetime:
- Insurance, property taxes, site security, legal and administrative fees, and other fixed costs
- Present value and annualized large component replacement costs over technical life (e.g., inverters at 15 years)
- Scheduled and unscheduled maintenance of solar PV plants, transformers, etc. over the technical lifetime of the plant (e.g., general maintenance, including cleaning and vegetation removal).
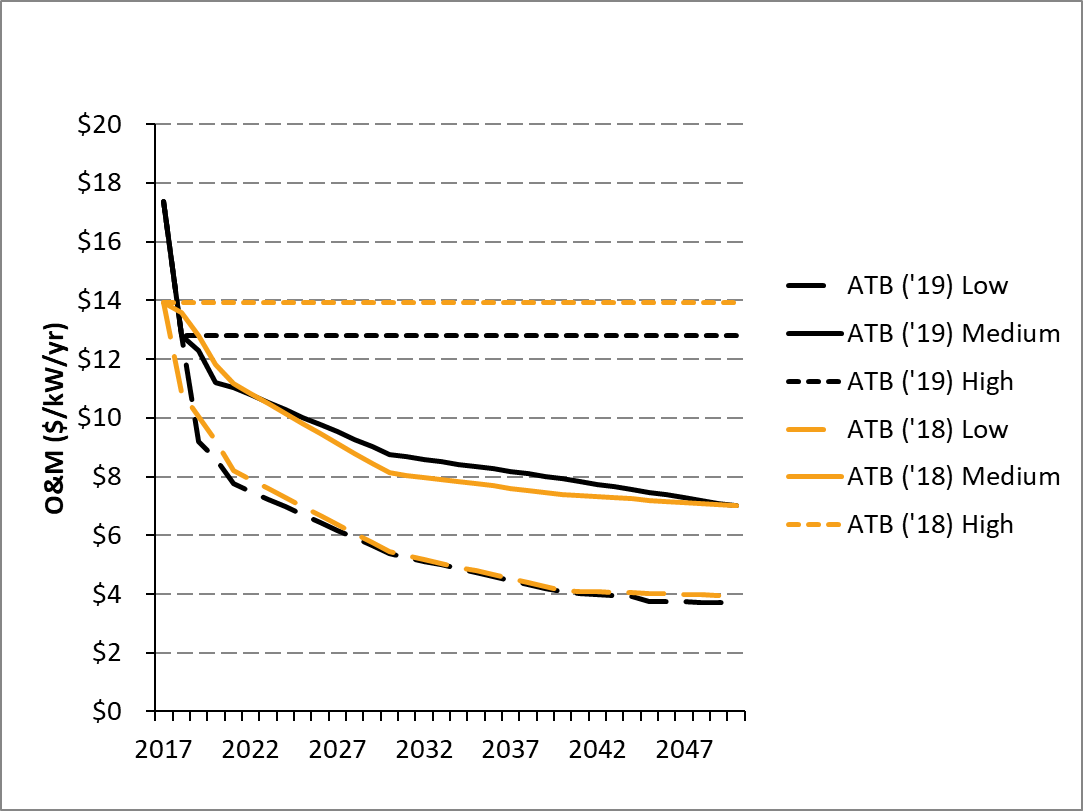
The following figure shows the Base Year estimate and future year projections for fixed O&M (FOM) costs. Three cost scenarios are represented. The estimate for a given year represents annual average FOM costs expected over the technical lifetime of a new plant that reaches commercial operation in that year.
Base Year Estimates
FOM of $18/kWDC - yr is based on modeled pricing for a commercial PV system quoted in Q1 2017 as reported by Fu, Feldman, and Margolis (2018), adjusted for inflation. The values in this report (ATB 2019) are higher than those from ATB 2018 to better align with the benchmarks reported in Fu, Feldman, and Margolis (2018); the previous edition relied solely on an O&M-to-CAPEX ratio, derived from multiple reports (IEA 2016). A wide range in reported prices exists in the market, in part depending on what maintenance practices exist for a particular system. These cost categories include asset management (including compliance and reporting for incentive payments), different insurance products, site security, cleaning, vegetation removal, and failure of components. Not all these practices are performed for each system; additionally, some factors depend on the quality of the parts and construction. NREL analysts estimate O&M costs can range from $0 to $40/kWDC - yr.
Future Year Projections
FOM for 2018 is also based on pricing reported in Fu, Feldman, and Margolis (2018), adjusted for inflation. From 2019-2050, FOM is based on the historical average ratio of O&M costs ($/kW-yr) to CAPEX costs ($/kW), 1.0:100, as reported by Fu, Feldman, and Margolis (2018). Historically reported data suggest O&M and CAPEX cost reductions are correlated; from 2010 to 2018 benchmark commercial PV O&M and CAPEX costs fell 47% and 66% respectively, as reported by Fu, Feldman, and Margolis (2018).
A detailed description of the methodology for developing future year projections is found in Projections Methodology.
Technology innovations that could impact future O&M costs are summarized in LCOE Projections.
Capacity Factor: Expected Annual Average Energy Production Over Lifetime
The capacity factor represents the expected annual average energy production divided by the annual energy production, assuming the plant operates at rated capacity for every hour of the year. It is intended to represent a long-term average over the lifetime of the plant. It does not represent interannual variation in energy production. Future year estimates represent the estimated annual average capacity factor over the technical lifetime of a new plant installed in a given year.
PV system capacity is not directly comparable to other technologies' capacity factors. Other technologies' capacity factors are represented in exclusively AC units (see Solar PV AC-DC Translation). However, because PV pricing in this ATB documentation is represented in $/WDC, PV system capacity is a DC rating. Because each technology uses consistent capacity ratings, the LCOEs are comparable.
The capacity factor is influenced by the hourly solar profile, technology (e.g., thin-film versus crystalline silicon), axis type (e.g., none, one, or two), expected downtime, and inverter losses to transform from DC to AC power. The DC-to-AC ratio is a design choice that influences the capacity factor. For the ATB, commercial PV systems are modeled for a 300-kWDC fixed-tilt (5°), roof-mounted system.
PV plant capacity factor incorporates an assumed degradation rate of 0.75%/year (Fu, Feldman, and Margolis 2018) in the annual average calculation. R&D could lower degradation rates of PV plant capacity factor; future projections for Mid and Low cost scenarios reduce degradation rates by 2050, using a straight-line basis, to 0.5%/year and 0.2%/year respectively.
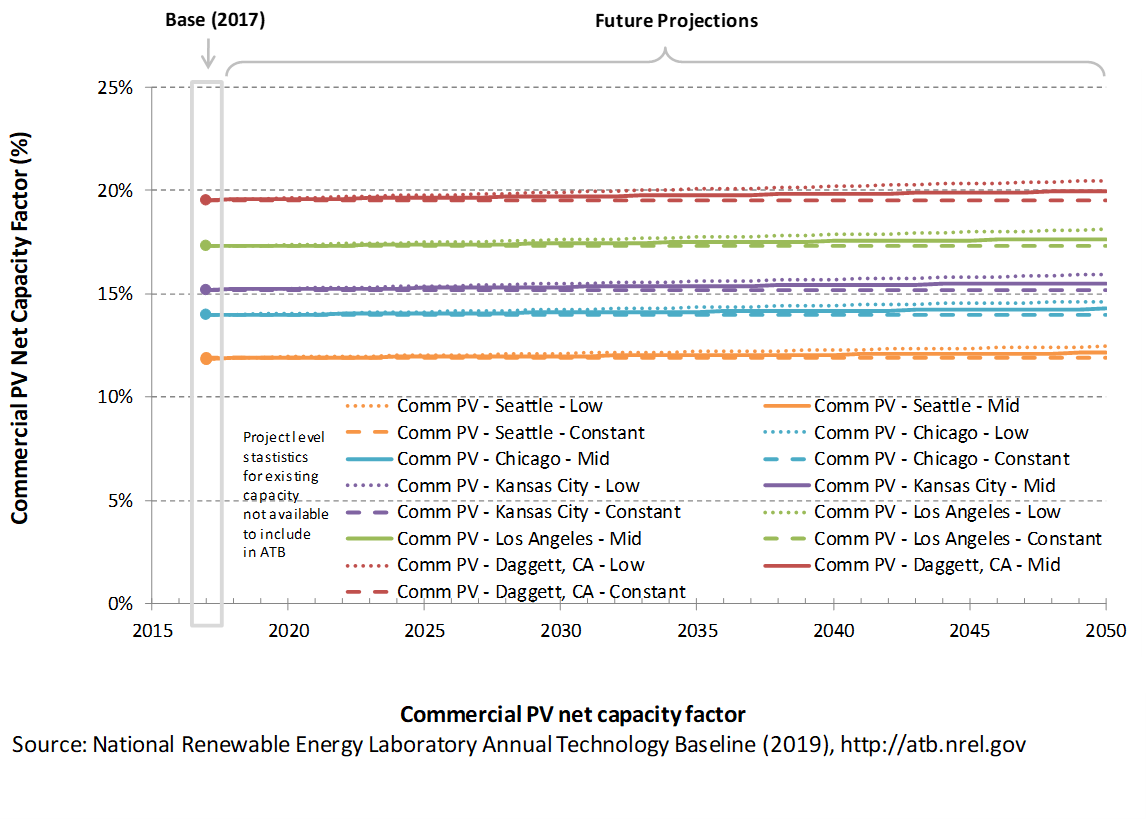
The following figure shows a range of capacity factors based on variation in solar resource in the contiguous United States. The range of the Base Year estimates illustrate the effect of locating a utility-scale PV plant in places with lower or higher solar irradiance. These five values use specific locations as examples of high (Daggett, California), high-mid (Los Angeles, California), mid (Kansas City, Missouri), low-mid (Chicago, Illinois), and low (Seattle, Washington) resource areas in the United States as implemented in the System Advisor Model using PV system characteristics from Fu, Feldman, and Margolis (2018).
Base Year Estimates
For illustration in the ATB, a range of capacity factors is associated with solar irradiance diversity and the range of latitude for five resource locations in the contiguous United States:
- Low: Seattle, Washington
- Low-mid: Chicago, Illinois
- Mid: Kansas City, Missouri
- High-mid: Los Angeles, California
- High: Daggett, California
First-year operation capacity factors as modeled range from 12.7% to 20.8%, though these depend significantly on geography and system configuration (e.g., fixed-tilt versus single-axis tracking).
Over time, PV installation output is reduced due to degradation in module quality. This degradation is accounted in ATB estimates of capacity factor over the 30-year lifetime of the plant. The adjusted average capacity factor values in the ATB Base Year are 11.9%, 14.0%, 15.2%, 17.3%, and 19.6%.
Future Year Projections
Projections of capacity factors for plants installed in future years are unchanged from the Base Year for the Constant technology cost scenario. Capacity factors for Mid and Low cost scenarios are projected to increase over time, caused by a straight-line reduction in PV plant capacity degradation rates, reaching 0.5%/year and 0.2%/year by 2050 for the Mid and Low cost scenarios respectively. The following table summarizes the difference in average capacity factor in 2050 caused by different degradation rates in the Constant, Mid, and Low cost scenarios.
| Seattle, WA | Chicago, IL | Kansas City, MO | Los Angeles, CA | Daggett, CA | |
| Low Cost (0.30% degradation rate) | 12.3% | 14.5% | 15.8% | 18.0% | 20.3%< |
| Mid Cost (0.50% degradation rate) | 12.1% | 14.3% | 15.5% | 17.7% | 20.0% |
| Constant Cost (0.75% degradation rate) | 11.9% | 14.0% | 15.2% | 17.3% | 19.6% |
Solar PV plants have very little downtime, inverter efficiency is already optimized, and tracking is already assumed. That said, there is potential for future increases in capacity factors through technological improvements beyond lower degradation rates, such as less panel reflectivity and improved performance in low-light conditions.
Standard Scenarios Model Results
ATB CAPEX, O&M, and capacity factor assumptions for the Base Year and future projections through 2050 for Constant, Mid, and Low technology cost scenarios are used to develop the NREL Standard Scenarios using the ReEDS model. See ATB and Standard Scenarios.
dSolar does not endogenously consider curtailment from surplus renewable energy generation, though this is a feature of the linked ReEDS-dSolar model (Cole et al. 2016), where balancing area-level marginal curtailments can be applied to distributed PV generation as determined by scenario constraints.
Plant Cost and Performance Projections Methodology
Currently, CAPEX – not LCOE – is the most common metric for PV cost. Due to differing assumptions in long-term incentives, system location and production characteristics, and cost of capital, LCOE can be confusing and often incomparable between differing estimates. While CAPEX also has many assumptions and interpretations, it involves fewer variables to manage. Therefore, PV projections in the ATB are driven entirely by plant and operational cost improvements.
We created Constant, Mid and Low CAPEX cases to explore the range of possible outcomes of future PV cost improvements. The Constant technology cost scenario represents no CAPEX improvements made beyond today, the Mid cost case represents current expectations of price reductions in a "business-as-usual" scenario, and the Low cost case represents current expectations of potential cost reductions given improved R&D funding and more aggressive global deployment targets.
While CAPEX is one of the drivers to lower costs, R&D efforts continue to focus on other areas to lower the cost of energy from residential PV. While these are not incorporated in the ATB, they include longer system lifetime, improved performance and reliability, and lower cost of capital.
Projections of future commercial PV installation CAPEX are based on seven system price projections from five separate institutions. Projections included short-term U.S. price forecasts made in the past six months and long-term global and U.S. price forecasts made in the past primarily provided by market analysis firms with expertise in the PV industry, through a subscription service with NREL. The long-term forecasts primarily represent the collection of publicly available, unique forecasts with either a long-term perspective of solar trends or through capacity expansion models with assumed learning by doing.
- Short-Term Forecast Institutions: Bloomberg New Energy Finance, GTM Research, Navigant Research (Labastida and Gauntlett 2016), U.S. Energy Information Administration
- Long-Term Forecast Institutions: Bloomberg New Energy Finance, CAISO, and U.S. Energy Information Administration.
In instances in which literature projections did not include all years, a straight-line change in price was assumed between any two projected values. To generate Mid and Low technology cost scenarios, we took the "median" and "min" of the data sets; however, we only included short-term U.S. forecasts until 2030 as they focus on near-term pricing trends within the industry. Starting in 2030, we include long-term global and U.S. forecasts in the data set, as they focus more on long-term trends within the industry. It is also assumed after 2025 U.S. prices will be on par with global averages; the federal tax credit for solar assets reverts down to 10% for all projects placed in service after 2023, which has the potential to lower upfront financing costs and remove any distortions in reported pricing, compared to other global markets. Additionally, a larger portion of the United States will have a more mature PV market, which should result in a narrower price range. Changes in price for the Mid and Low technology cost scenarios between 2020 and 2030 are interpolated on a straight-line basis.
We adjusted the "median" and "min" projections in a few different ways. All 2017 and 2018 pricing is based on the bottom-up benchmark analysis reported in U.S. Solar Photovoltaic System Cost Benchmark Q1 2018 (Fu, Feldman, and Margolis 2018).
We adjusted the Mid and Low cost projections for 2019-2050 to remove distortions caused by the combination of forecasts with different time horizons and based on internal judgment of price trends. The Constant cost projection case is kept constant at the 2018 CAPEX value, assuming no improvements beyond 2018.
From 2019-2050, FOM is based on the historical average ratio of O&M costs ($/kW-yr) to CAPEX costs ($/kW), 1.0:100, as reported by Fu, Feldman, and Margolis (2018). Historically reported data suggest O&M and CAPEX cost reductions are correlated; from 2010 to 2018 benchmark commercial PV O&M and CAPEX costs fell 47% and 66% respectively, as reported by Fu, Feldman, and Margolis (2018).
Projections of capacity factors for plants installed in future years are unchanged from 2018 for the Constant technology cost scenario. Capacity factors for Mid and Low cost scenarios are projected to increase over time, caused by a straight-line reduction in PV plant capacity degradation rates from 0.75%, reaching 0.5%/year and 0.2%/year by 2050 for the Mid and Low cost scenarios respectively.
Levelized Cost of Energy (LCOE) Projections
Levelized cost of energy (LCOE) is a summary metric that combines the primary technology cost and performance parameters: CAPEX, O&M, and capacity factor. It is included in the ATB for illustrative purposes. The ATB focuses on defining the primary cost and performance parameters for use in electric sector modeling or other analysis where more sophisticated comparisons among technologies are made. The LCOE accounts for the energy component of electric system planning and operation. The LCOE uses an annual average capacity factor when spreading costs over the anticipated energy generation. This annual capacity factor ignores specific operating behavior such as ramping, start-up, and shutdown that could be relevant for more detailed evaluations of generator cost and value. Electricity generation technologies have different capabilities to provide such services. For example, wind and PV are primarily energy service providers, while the other electricity generation technologies provide capacity and flexibility services in addition to energy. These capacity and flexibility services are difficult to value and depend strongly on the system in which a new generation plant is introduced. These services are represented in electric sector models such as the ReEDS model and corresponding analysis results such as the Standard Scenarios.
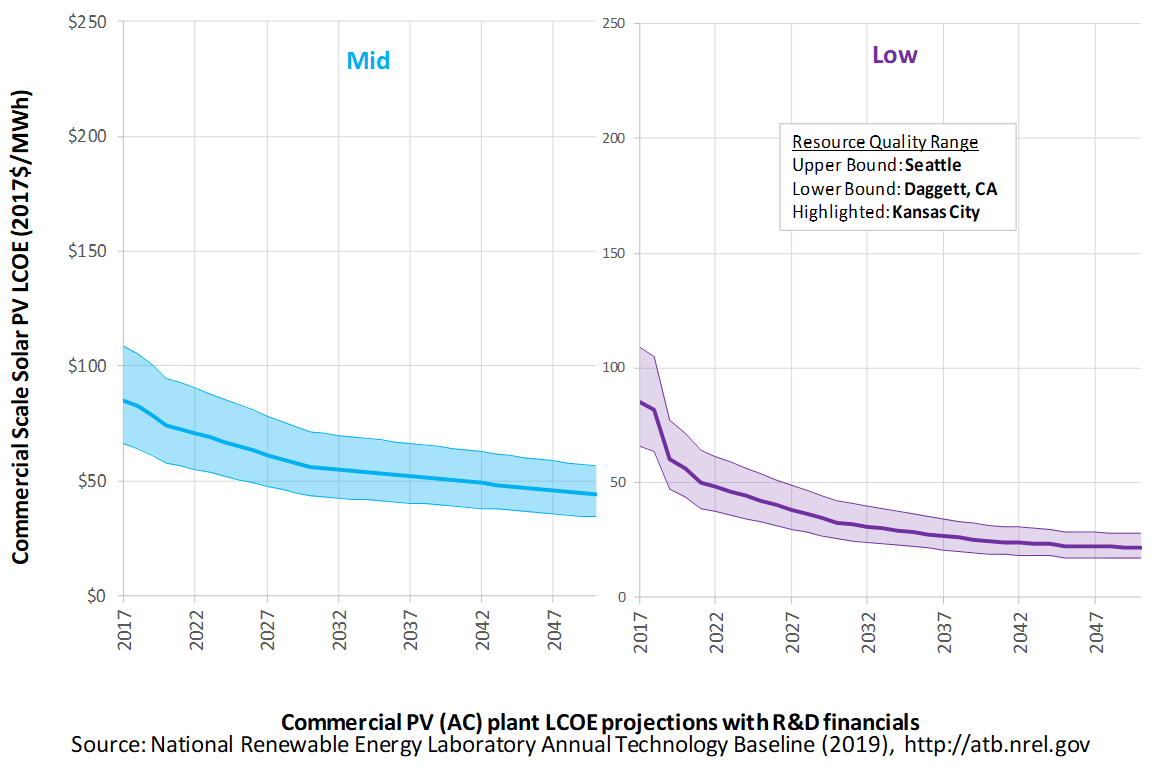
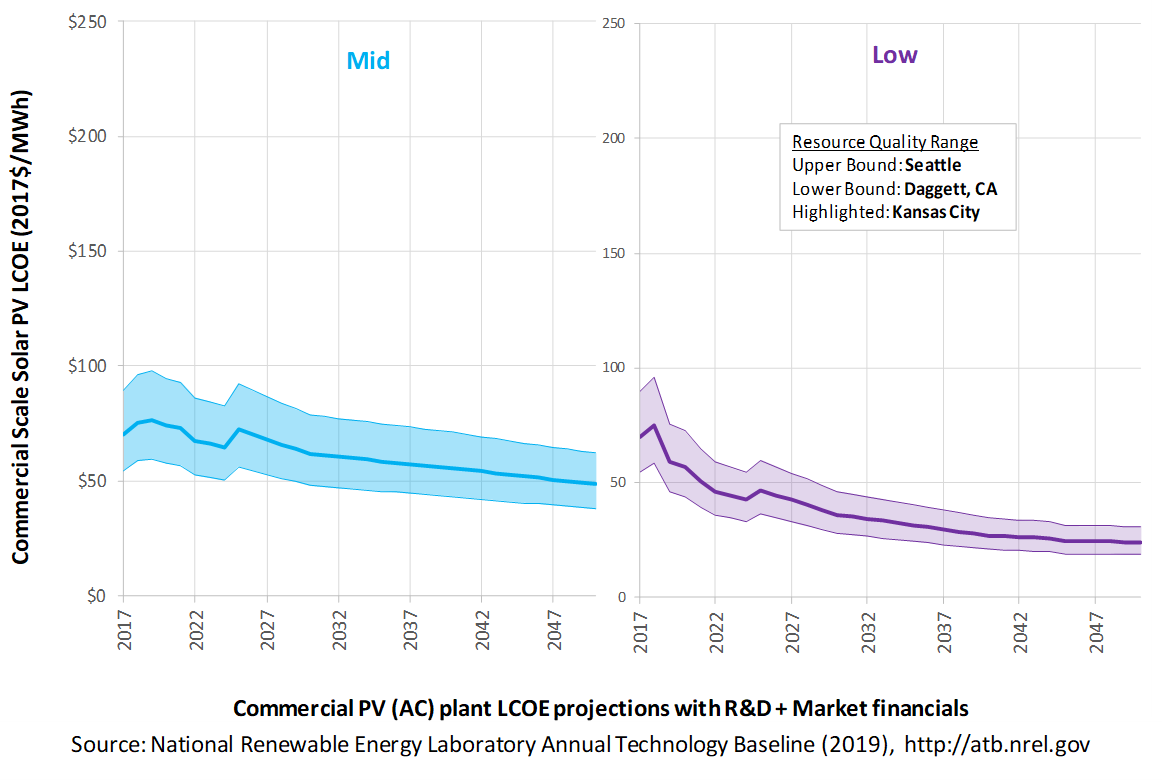
The following three figures illustrate LCOE, which includes the combined impact of CAPEX, O&M, and capacity factor projections for commercial PV across the range of resources present in the contiguous United States. For the purposes of the ATB, the costs associated with technology and project risk in the U.S. market are represented in the financing costs but not in the upfront capital costs (e.g., developer fees and contingencies). An individual technology may receive more favorable financing terms outside of the United States, due to less technology and project risk, caused by more project development experience (e.g., offshore wind in Europe) or more government or market guarantees. The R&D Only LCOE sensitivity cases present the range of LCOE based on financial conditions that are held constant over time unless R&D affects them, and they reflect different levels of technology risk. This case excludes effects of tax reform, tax credits, and changing interest rates over time. The R&D + Market LCOE case adds to these financial assumptions: (1) the changes over time consistent with projections in the Annual Energy Outlook and (2) the effects of tax reform and tax credits. The ATB representative plant characteristics that best align with those of recently installed or anticipated near-term commercial PV plants are associated with Comm (commercial) PV: Kansas City. Data for all the resource categories can be found in the ATB Data spreadsheet; for simplicity, not all resource categories are shown in the figures. In the R&D + Market LCOE case, there is an increase in LCOE from 2018-2020, caused by an increase WACC, and an increase from 2023-2024, caused by the reduction in tax credits.
R&D Only | R&D + Market
The methodology for representing the CAPEX, O&M, and capacity factor assumptions behind each pathway is discussed in Projections Methodology. In general, the degree of adoption of technology innovation distinguishes the Constant, Mid, and Low technology cost scenarios. These projections represent trends that reduce CAPEX and improve performance. Development of these scenarios involves technology-specific application of the following general definitions:
- Constant Technology Cost Scenario: Base Year (or near-term estimates of projects under construction) equivalent through 2050 maintains current relative technology cost differences
- Mid Technology Cost Scenario: Technology advances through continued industry growth, public and private R&D investments, and market conditions relative to current levels that may be characterized as "likely" or "not surprising"
- Low Technology Cost Scenario: Technology advances that may occur with breakthroughs, increased public and private R&D investments, and/or other market conditions that lead to cost and performance levels that may be characterized as the "limit of surprise" but not necessarily the absolute low bound.
To estimate LCOE, assumptions about the cost of capital to finance electricity generation projects are required, and the LCOE calculations are sensitive to these financial assumptions. Two project finance structures are used within the ATB:
- R&D Only Financial Assumptions: This sensitivity case allows technology-specific changes to debt interest rates, return on equity rates, and debt fraction to reflect effects of R&D on technological risk perception, but it holds background rates constant at 2017 values from AEO2019 (EIA 2019b)and excludes effects of tax reform and tax credits.
- R&D Only + Market Financial Assumptions: This sensitivity case retains the technology-specific changes to debt interest, return on equity rates, and debt fraction from the R&D Only case and adds in the variation over time consistent with AEO2019 as well as effects of tax reform and tax credits. For a detailed discussion of these assumptions, see Project Finance Impact on LCOE.
A constant cost recovery period – over which the initial capital investment is recovered-of 30 years is assumed for all technologies throughout this website, and can be varied in the ATB data spreadsheet.
The equations and variables used to estimate LCOE are defined on the Equations and Variables page. For illustration of the impact of changing financial structures such as WACC, see Project Finance Impact on LCOE. For LCOE estimates for the Constant, Mid, and Low technology cost scenarios for all technologies, see 2019 ATB Cost and Performance Summary.
In general, differences among the technology cost cases reflect different levels of adoption of innovations. Reductions in technology costs reflect the cost reduction opportunities that are listed below.
- Modules
- Increased module efficiencies and increased production-line throughput to decrease CAPEX; overhead costs on a per-kilowatt basis will go down if efficiency and throughput improvement are realized
- Reduced wafer thickness or the thickness of thin-film semiconductor layers
- Development of new semiconductor materials
- Development of larger manufacturing facilities in low-cost regions
- Balance of system (BOS)
- Increased module efficiency, reducing the size of the installation
- Development of racking systems that enhance energy production or require less robust engineering
- Integration of racking or mounting components in modules
- Reduction of supply chain complexity and cost
- Creation of standard packaged system design
- Improvement of supply chains for BOS components in modules
- Improved power electronics
- Improvement of inverter prices and performance, possibly by integrating microinverters
- Decreased installation costs and margins
- Reduction of supply chain margins (e.g., profit and overhead charged by suppliers, manufacturer, distributors, and retailers); this will likely occur naturally as the U.S. PV industry grows and matures.
- Streamlining of installation practices through improved workforce development and training and developing standardized PV hardware
- Expansion of access to a range of innovative financing approaches and business models
- Development of best practices for permitting interconnection and PV installation such as subdivision regulations, new construction guidelines, and design requirements.
FOM cost reduction represents optimized O&M strategies, reduced component replacement costs, and lower frequency of component replacement.
Residential PV Systems
Representative Technology
For the ATB, residential PV systems are modeled for a 5.0-kWDC fixed tilt (25°), roof-mounted system. Flat-plate PV can take advantage of direct and indirect insolation, so PV modules need not directly face and track incident radiation. This gives PV systems a broad geographical application, especially for residential PV systems.
Resource Potential
Solar resources across the United States are mostly good to excellent at about 1,000-2,500 kWh/m2/year. The Southwest is at the top of this range, while only Alaska and part of Washington are at the low end. The range for the contiguous United States is about 1,350-2,500 kWh/m2/year. Nationwide, solar resource levels vary by about a factor of two.
Distributed-scale PV is assumed to be configured as a fixed-tilt, roof-mounted system. Compared to utility-scale PV, this reduces both the potential capacity factor and amount of land (roof space) that is available for development. A recent study of rooftop PV technical potential (Gagnon et al. 2016) estimated that as much as 731 GW (926 TWh/yr) of potential exists for small buildings (< 5,000 m2) and 386 GW (506 TWh/yr) of potential exists for medium (5,000-25,000 m2) and large buildings (> 25,000 m2).

Renewable energy technical potential, as defined by Lopez et al. (2012), represents the achievable energy generation of a particular technology given system performance, topographic limitations, and environmental and land-use constraints. The primary benefit of assessing technical potential is that it establishes an upper-boundary estimate of development potential. It is important to understand that there are multiple types of potential-resource, technical, economic, and market (see NREL: "Renewable Energy Technical Potential").
Base Year and Future Year Projections Overview
The Base Year estimates rely on modeled CAPEX and O&M estimates benchmarked with industry and historical data. Capacity factor is estimated based on hours of sunlight at latitude for five representative geographic locations in the United States.
Future year projections are derived from analysis of published projections of PV CAPEX and bottom-up engineering analysis of O&M costs. Three different technology cost scenarios were developed for scenario modeling as bounding levels:
- Constant Technology Cost Scenario: no change in CAPEX, O&M, or capacity factor from 2017 to 2050; consistent across all renewable energy technologies in the ATB
- Mid Technology Cost Scenario: based on the median of literature projections of future CAPEX; O&M technology pathway analysis
- Low Technology Cost Scenario: based on the low bound of literature projections of future CAPEX and O&M technology pathway analysis.
Capital Expenditures (CAPEX): Historical Trends, Current Estimates, and Future Projections
Capital expenditures (CAPEX) are expenditures required to achieve commercial operation in a given year. These expenditures include the hardware, the balance of system (e.g., site preparation, installation, and electrical infrastructure), and financial costs (e.g., development costs, onsite electrical equipment, and interest during construction) and are detailed in CAPEX Definition. In the ATB, CAPEX reflects typical plants and does not include differences in regional costs associated with labor, materials, taxes, or system requirements. The related Standard Scenarios product uses Regional CAPEX Adjustments. The range of CAPEX demonstrates variation with resource in the contiguous United States.
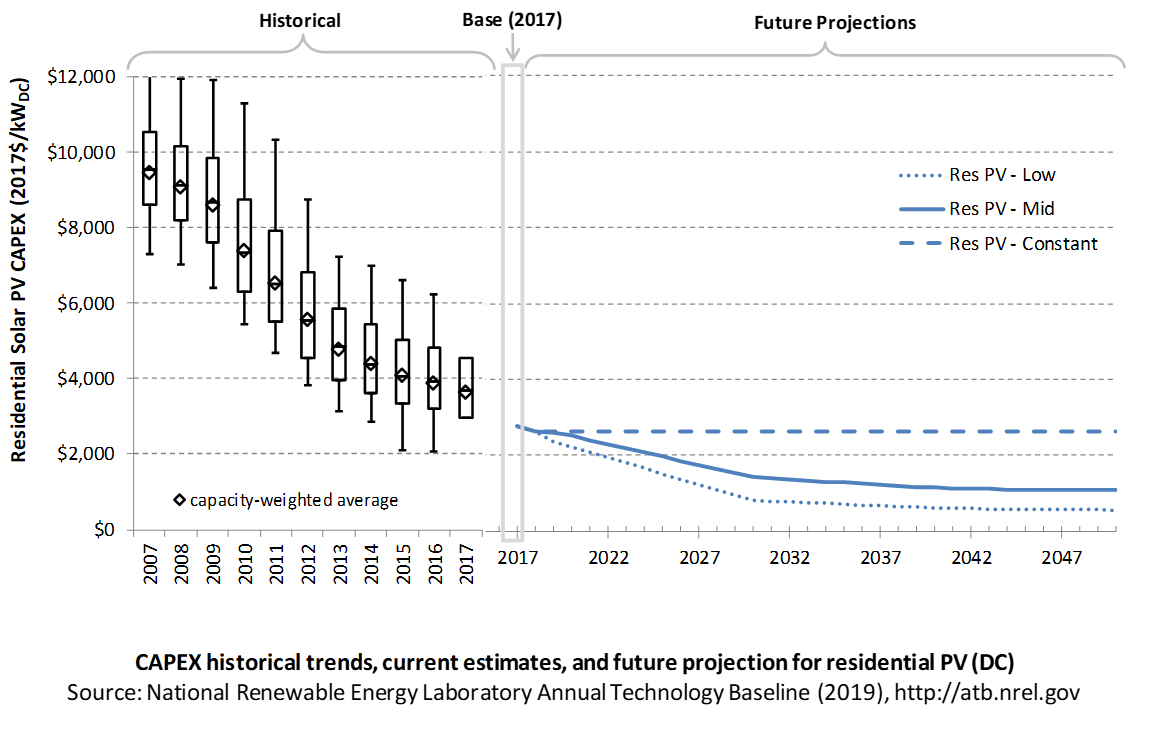
The following figure shows the Base Year estimate and future year projections for CAPEX costs. Three cost scenarios are represented: Constant, Mid, and Low technology cost. Historical data from residential PV installed in the United States are shown for comparison to the ATB Base Year estimates. The estimate for a given year represents CAPEX of a new plant that reaches commercial operation in that year.
Recent Trends
Reported residential PV installation CAPEX (Barbose and Dargouth 2018) is shown in box-and-whiskers format for comparison to historical residential PV benchmark overnight capital cost (Fu, Feldman, and Margolis 2018) and the ATB estimates of future CAPEX projections. The data in Barbose and Dargouth (2018) represent 81% of all U.S. residential and commercial PV capacity installed through 2016 and 75% of capacity installed in 2017.
The difference in each year's price between the market and benchmark data reflects differences in methodologies. There are a variety of reasons reported and benchmark prices can differ, as enumerated by Barbose and Dargouth (2018) and Bolinger and Seel (2018), including:
- Timing-related issues: For instance, the time between contract completion date and project placed in service may vary.
- Variations over time in the size, technology, installer margin, and design of systems installed in a given year
- Which cost categories are included in CAPEX (e.g., financing costs and initial O&M expenses).
Due to the investment tax credit, projects are encouraged to include as many costs incurred in the upfront CAPEX to receive a higher tax credit, which may have otherwise been reported as operating costs. The bottom-up benchmarks are more reflective of an overnight capital cost, which is in line with the ATB methodology of inputting overnight capital cost and calculating construction financing to derive CAPEX.
PV pricing and capacities are quoted in kWDC (i.e., module rated capacity) unlike other generation technologies, which are quoted in kWAC. For PV, this would correspond to the combined rated capacity of all inverters. This is done because kWDC is the unit that the majority of the PV industry uses. Although costs are reported in kWDC, the total CAPEX includes the cost of the inverter, which has a capacity measured in kWAC.
CAPEX estimates for 2018 reflect a continued rapid decline in pricing supported by analysis of recent system cost and pricing for projects that became operational in 2018 (Feldman and Margolis 2018).
Base Year Estimates
For illustration in the ATB, a representative residential-scale PV installation is shown. Although the PV technologies vary, typical installation costs are represented with a single estimate because the CAPEX does not vary with solar resource.
Although the technology market share may shift over time with new developments, the typical installation cost is represented with the projections above.
A system price of $2.77/WDC in 2017 and $2.64/WDC in 2018 are based on bottom-up benchmark analysis reported in U.S. Solar Photovoltaic System Cost Benchmark Q1 2018 (adjusted for inflation) (Fu, Feldman, and Margolis 2018). These figures are in line with other estimated system prices reported in Q2/Q3 2018 Solar Industry Update (Feldman and Margolis 2018).
The Base Year CAPEX estimates should tend toward the low end of observed cost because no regional impacts are included. These effects are represented in the historical market data.
Future Year Projections
Projections of future residential PV installation CAPEX are based on seven system price projections from six separate institutions made in the last two years. We adjusted the "min," "median," and "max" projections in a few different ways. All 2017 and 2018 pricing are based on the bottom-up benchmark analysis reported in U.S. Solar Photovoltaic System Cost Benchmark Q1 2018 (adjusted for inflation) (Fu, Feldman, and Margolis 2018). These figures are in line with other estimated system prices reported in Q2/Q3 2018 Solar Industry Update (Feldman and Margolis 2018).
We adjusted the Mid and Low cost projections for 2019-2050 to remove distortions caused by the combination of forecasts with different time horizons and based on internal judgment of price trends. The Constant technology cost scenario is kept constant at the 2018 CAPEX value, assuming no improvements beyond 2018.
A detailed description of the methodology for developing future year projections is found in Projections Methodology.
Technology innovations that could impact future O&M costs are summarized in LCOE Projections.
CAPEX Definition
Capital expenditures (CAPEX) are expenditures required to achieve commercial operation in a given year. For residential PV, this is modeled for a host-owned business model only.
For the ATB, and based on EIA (2016b) and the NREL Solar-PV Cost Model (Fu, Feldman, and Margolis 2018), the distributed residential solar PV plant envelope is defined to include:
- Hardware
- Module supply
- Power electronics, including inverters
- Racking
- Foundation
- AC and DC wiring materials and installation
- Balance of system (BOS)
- Site and/or roof preparation
- Permitting, inspection, and interconnection costs
- Project indirect costs, including costs related to engineering, distributable labor and materials, construction management start up and commissioning, and contractor overhead costs, fees, and profit
- Financial costs
- Owners costs, such as development costs, legal fees, insurance costs.
CAPEX can be determined for a plant in a specific geographic location as follows:
Regional cost variations are not included in the ATB (CapRegMult = 1). Because distributed PV plants are located directly at the end use, there are no grid connection costs (GCC = 0). In the ATB, the input value is overnight capital cost (OCC) and details to calculate interest during construction (ConFinFactor).
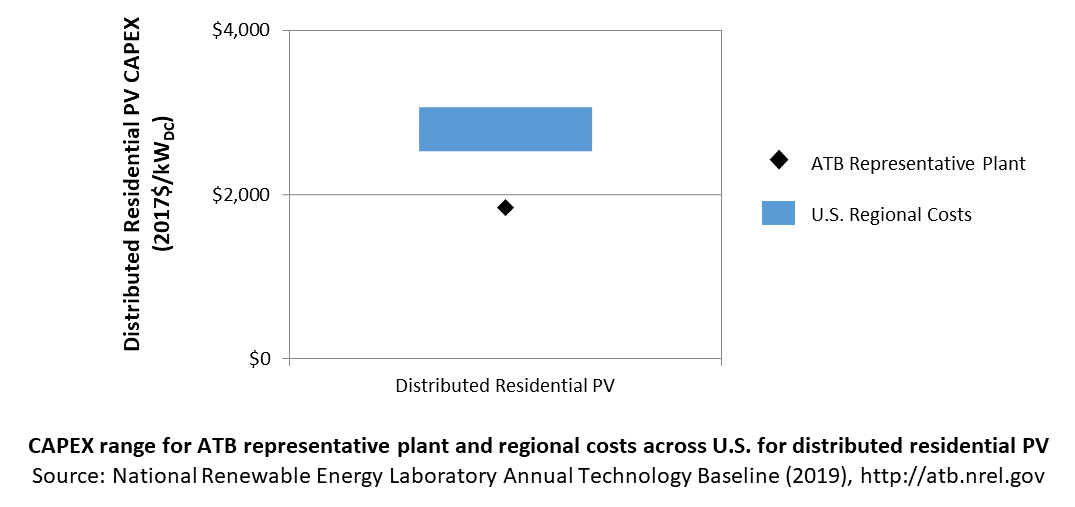
In the ATB, CAPEX represents a typical distributed residential/commercial PV plant and does not vary with resource. Regional cost effects associated with labor rates, material costs, and other regional effects as defined by EIA (2016b) expand the range of CAPEX. Unique land-based spur line costs based on distance and transmission line costs are not estimated. The following figure illustrates the ATB representative plant relative to the range of CAPEX including regional costs across the contiguous United States. The ATB representative plants are associated with a regional multiplier of 1.0.
Standard Scenarios Model Results
ATB CAPEX, O&M, and capacity factor assumptions for the Base Year and future projections through 2050 for Constant, Mid, and Low technology cost scenarios are used to develop the NREL Standard Scenarios using the ReEDS model. See ATB and Standard Scenarios.
CAPEX in the ATB does not represent regional variants (CapRegMult) associated with labor rates, material costs, etc., but dSolar does include 134 regional multipliers (EIA 2016b).
Operation and Maintenance (O&M) Costs
Operations and maintenance (O&M) costs represent the annual expenditures required to operate and maintain a solar PV plant over its lifetime, including:
- Insurance, property taxes, site security, legal and administrative fees, and other fixed costs
- Present value and annualized large component replacement costs over technical life (e.g., inverters at 15 years)
- Scheduled and unscheduled maintenance of solar PV plants, transformers, etc. over the technical lifetime of the plant (e.g., general maintenance, including cleaning and vegetation removal).
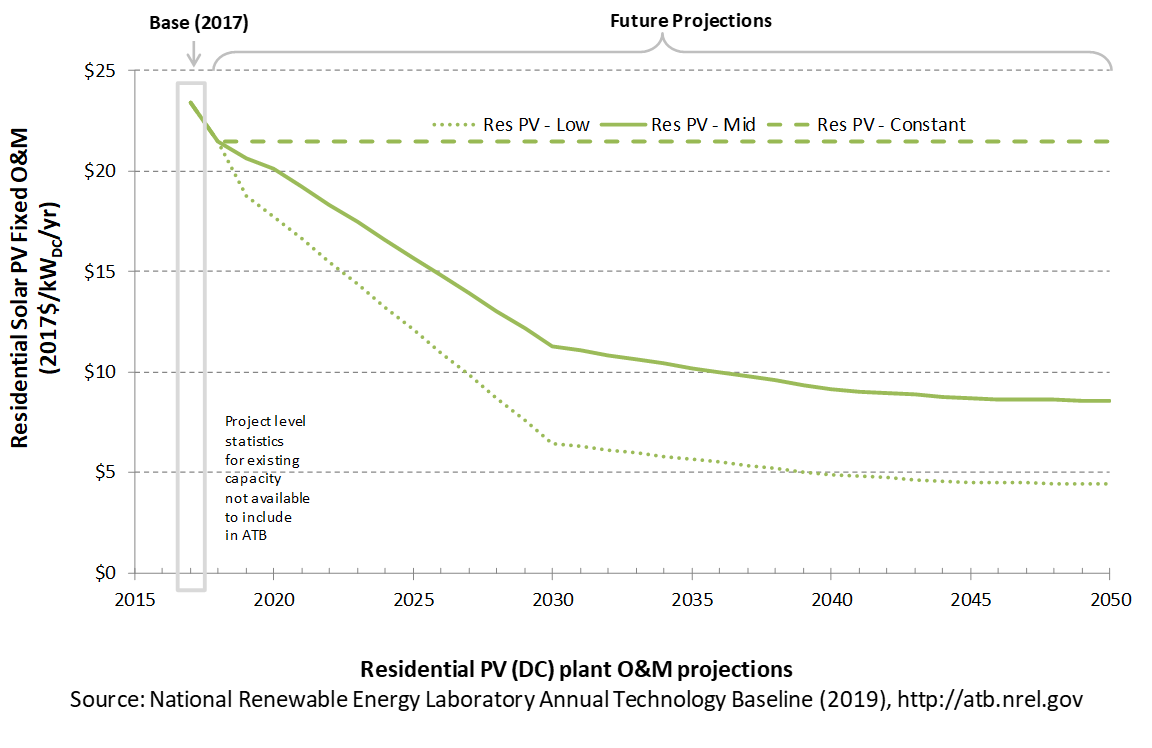
The following figure shows the Base Year estimate and future year projections for fixed O&M (FOM) costs. Three cost scenarios are represented. The estimate for a given year represents annual average FOM costs expected over the technical lifetime of a new plant that reaches commercial operation in that year.
Base Year Estimates
FOM of $23/kWDC - yr based on modeled pricing for a commercial PV system quoted in Q1 2017 as reported by Fu, Feldman, and Margolis (2018), adjusted for inflation. The values in this report (ATB 2019) are higher than those from ATB 2018 to better align with the benchmarks reported in Fu, Feldman, and Margolis (2018); the previous edition relied solely on an O&M-to-CAPEX ratio, derived from multiple reports. A wide range in reported prices exists in the market, and in part, it depends on what maintenance practices exist for a particular system. These cost categories include asset management (including compliance and reporting for incentive payments), different insurance products, site security, cleaning, vegetation removal, and failure of components. Not all these practices are performed for each system; additionally, some factors depend on the quality of the parts and construction. NREL analysts estimate O&M costs can range from $0 to $40/kWDC - yr.
Future Year Projections
FOM for 2018 is also based on pricing reported in Fu, Feldman, and Margolis (2018), adjusted for inflation. From 2019-2050, FOM is based on the historical average ratio of O&M costs ($/kW-yr) to CAPEX costs ($/kW), 0.8:100, as reported by Fu, Feldman, and Margolis (2018). Historically reported data suggest O&M and CAPEX cost reductions are correlated; from 2010 to 2018 benchmark residential PV O&M and CAPEX costs fell 60% and 63% respectively, as reported by Fu, Feldman, and Margolis (2018).
A detailed description of the methodology for developing future year projections is found in Projections Methodology.
Technology innovations that could impact future O&M costs are summarized in LCOE Projections.
Capacity Factor: Expected Annual Average Energy Production Over Lifetime
The capacity factor represents the expected annual average energy production divided by the annual energy production, assuming the plant operates at rated capacity for every hour of the year. It is intended to represent a long-term average over the lifetime of the plant. It does not represent interannual variation in energy production. Future year estimates represent the estimated annual average capacity factor over the technical lifetime of a new plant installed in a given year.
PV system capacity is not directly comparable to other technologies' capacity factors. Other technologies' capacity factors are represented in exclusively AC units (see Solar PV AC-DC Translation). However, because PV pricing in this ATB documentation is represented in $/WDC, PV system capacity is a DC rating. Because each technology uses consistent capacity ratings, the LCOEs are comparable.
The capacity factor is influenced by the hourly solar profile, technology (e.g., thin-film versus crystalline silicon), axis type (e.g., none, one, or two), expected downtime, and inverter losses to transform from DC to AC power. The DC-to-AC ratio is a design choice that influences the capacity factor. PV plant capacity factor incorporates an assumed degradation rate of 0.75%/year (Fu, Feldman, and Margolis 2018) in the annual average calculation. R&D could lower degradation rates of PV plant capacity factor; future projections for Mid and Low cost scenarios reduce degradation rates by 2050, using a straight-line basis, to 0.5%/year and 0.2%/year respectively.
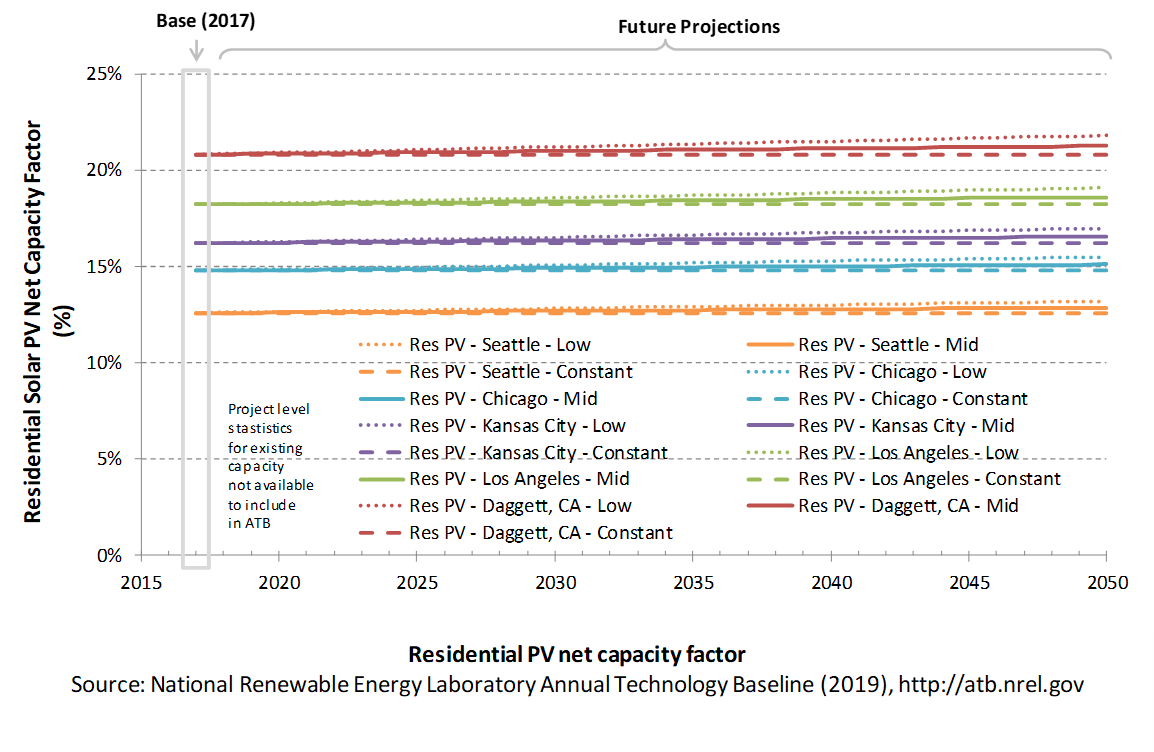
The following figure shows a range of capacity factors based on variation in solar resource in the contiguous United States. The range of the Base Year estimates illustrate the effect of locating a utility-scale PV plant in places with lower or higher solar irradiance. These five values use specific locations as examples of high (Daggett, CA), high-mid (Los Angeles, CA), mid (Kansas City, MO), low-mid (Chicago, IL), and low (Seattle, WA) resource areas in the United States as implemented in the System Advisor Model using PV system characteristics from Fu, Feldman, and Margolis (2018).
Base Year Estimates
For illustration in the ATB, a range of capacity factors is associated with the range of solar irradiance for three resource locations in the contiguous United States:
- Low: Seattle, Washington
- Low-mid: Chicago, Illinois
- Mid: Kansas City, Missouri
- High-mid: Los Angeles, California
- High: Daggett, California
First-year operation capacity factors as modeled range from 13.4% to 22.2%, though these depend significantly on geography and system configuration (e.g., fixed-tilt versus single-axis tracking).
Over time, PV installation output is reduced due to degradation in module quality. This degradation is accounted in ATB estimates of capacity factor over the 30-year lifetime of the plant. The adjusted average capacity factor values in the ATB Base Year are 12.6%, 14.8%, 16.2%, 18.2%, and 20.8%.
Future Year Projections
Projections of capacity factors for plants installed in future years are unchanged from the Base Year for the Constant technology cost scenario. Capacity factors for Mid and Low cost scenarios are projected to increase over time, caused by a straight-line reduction in PV plant capacity degradation rates, reaching 0.5%/year and 0.2%/year by 2050 for the Mid and Low cost scenarios respectively. The following table summarizes the difference in average capacity factor in 2050 caused by different degradation rates in the Constant, Mid, and Low cost scenarios.
| Seattle, WA | Chicago, IL | Kansas City, MO | Los Angeles, CA | Daggett, CA | |
| Low Cost (0.30% degradation rate) | 13.1% | 15.4% | 16.8% | 18.9% | 21.6%< |
| Mid Cost (0.50% degradation rate) | 12.9% | 15.1% | 16.6% | 18.6% | 21.3% |
| Constant Cost (0.75% degradation rate) | 12.6% | 14.8% | 16.2% | 18.2% | 20.8% |
Solar PV plants have very little downtime, inverter efficiency is already optimized, and tracking is already assumed. That said, there is potential for future increases in capacity factors through technological improvements beyond lower degradation rates, such as less panel reflectivity and improved performance in low-light conditions.
Standard Scenarios Model Results
ATB CAPEX, O&M, and capacity factor assumptions for the Base Year and future projections through 2050 for Constant, Mid, and Low technology cost scenarios are used to develop the NREL Standard Scenarios using the ReEDS model. See ATB and Standard Scenarios.
dSolar does not endogenously consider curtailment from surplus renewable energy generation, though this is a feature of the linked ReEDS-dSolar model (Cole et al. 2016), where balancing area-level marginal curtailments can be applied to distributed PV generation as determined by scenario constraints.
Plant Cost and Performance Projections Methodology
Currently, CAPEX – not LCOE – is the most common metric for PV cost. Due to differing assumptions in long-term incentives, system location and production characteristics, and cost of capital, LCOE can be confusing and often incomparable between differing estimates. While CAPEX also has many assumptions and interpretations, it involves fewer variables to manage. Therefore, PV projections in the ATB are driven entirely by plant and operational cost improvements.
We created Constant, Mid, and Low technology cost CAPEX cases to explore the range of possible outcomes of future PV cost improvements. The Constant technology case represents no CAPEX improvements made beyond today, the Mid case represents current expectations of price reductions in a "business-as-usual" scenario, and the Low case represents current expectations of potential cost reductions given improved R&D funding and more aggressive global deployment targets.
While CAPEX is one of the drivers to lower costs, R&D efforts continue to focus on other areas to lower the cost of energy from residential PV. While these are not incorporated in the ATB, they include longer system lifetime, improved performance and reliability, and lower cost of capital.
Projections of future residential PV installation CAPEX are based on seven system price projections from six separate institutions. Projections include short-term U.S. price forecasts and long-term global and U.S. price forecasts made in the past two years. The short-term forecasts were primarily provided by market analysis firms with expertise in the PV industry, through a subscription service with NREL. The long-term forecasts primarily represent the collection of publicly available, unique forecasts with either a long-term perspective of solar trends or through capacity expansion models with assumed learning by doing.
- Short-Term Forecast Institutions: Bloomberg New Energy Finance, CAISO, GTM Research, Navigant Research (Labastida and Gauntlett 2016), U.S. Energy Information Administration
- Long-Term Forecast Institutions: Bloomberg New Energy Finance, International Energy Agency.
In instances in which literature projections did not include all years, a straight-line change in price was assumed between any two projected values. To generate Mid and Low technology cost scenarios we took the "median" and "min" of the data sets; however, we only included short-term U.S. forecasts until 2030 as they focus on near-term pricing trends within the industry. Starting in 2030, we include long-term global and U.S. forecasts in the data set, as they focus more on long-term trends within the industry. It is also assumed after 2025 U.S. prices will be on par with global averages. Many of the global projections are weighted heavily toward western countries (e.g., European countries, Japan, and the United States), and in the long-term, the United States should follow global trends. The federal tax credit for solar assets reverts down to 10% for all projects placed in service after 2023, which has the potential to lower upfront financing costs and remove any distortions in reported pricing, compared to other global markets. Additionally, a larger portion of the United States will have a more mature PV market, which should result in a narrower price range. Many institutions used one system price for all countries. Changes in price for the Mid and Low technology cost scenarios between 2020 and 2030 are interpolated on a straight-line basis.
We adjusted the "median" and "min" projections in a few different ways. All 2017 and 2018 pricing are based on the bottom-up benchmark analysis reported in U.S. Solar Photovoltaic System Cost Benchmark Q1 2018 (adjusted for inflation) (Fu, Feldman, and Margolis 2018). These figures are in line with other estimated system prices reported in Q2/Q3 2018 Solar Industry Update (Feldman and Margolis 2018).
We adjusted the Mid and Low cost projections for 2019-2050 to remove distortions caused by the combination of forecasts with different time horizons and based on internal judgment of price trends. The Constant technology cost scenario is kept constant at the 2018 CAPEX value, assuming no improvements beyond 2018.

From 2019-2050, FOM is based on the historical average ratio of O&M costs ($/kW-yr) to CAPEX costs ($/kW), 0.8:100, as reported by Fu, Feldman, and Margolis (2018). Historically reported data suggest O&M and CAPEX cost reductions are correlated; from 2010 to 2018 benchmark residential PV O&M and CAPEX costs fell 60% and 63% respectively, as reported by Fu, Feldman, and Margolis (2018).
Projections of capacity factors for plants installed in future years are unchanged from 2018 for the Constant technology cost scenario. Capacity factors for Mid and Low cost scenarios are projected to increase over time, caused by a straight-line reduction in PV plant capacity degradation rates from 0.75%, reaching 0.5%/year and 0.2%/year by 2050 for the Mid and Low cost scenarios, respectively.
Levelized Cost of Energy (LCOE) Projections
Levelized cost of energy (LCOE) is a summary metric that combines the primary technology cost and performance parameters: CAPEX, O&M, and capacity factor. It is included in the ATB for illustrative purposes. The ATB focuses on defining the primary cost and performance parameters for use in electric sector modeling or other analysis where more sophisticated comparisons among technologies are made. The LCOE accounts for the energy component of electric system planning and operation. The LCOE uses an annual average capacity factor when spreading costs over the anticipated energy generation. This annual capacity factor ignores specific operating behavior such as ramping, start-up, and shutdown that could be relevant for more detailed evaluations of generator cost and value. Electricity generation technologies have different capabilities to provide such services. For example, wind and PV are primarily energy service providers, while the other electricity generation technologies provide capacity and flexibility services in addition to energy. These capacity and flexibility services are difficult to value and depend strongly on the system in which a new generation plant is introduced. These services are represented in electric sector models such as the ReEDS model and corresponding analysis results such as the Standard Scenarios.
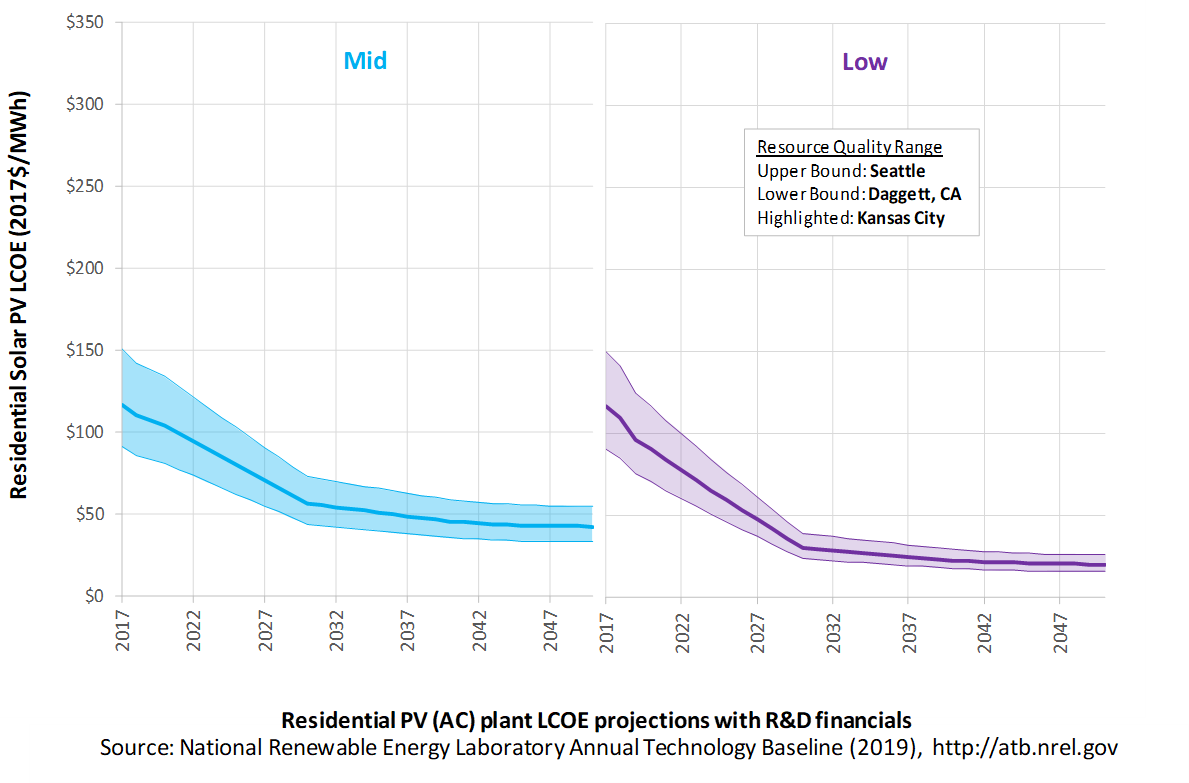
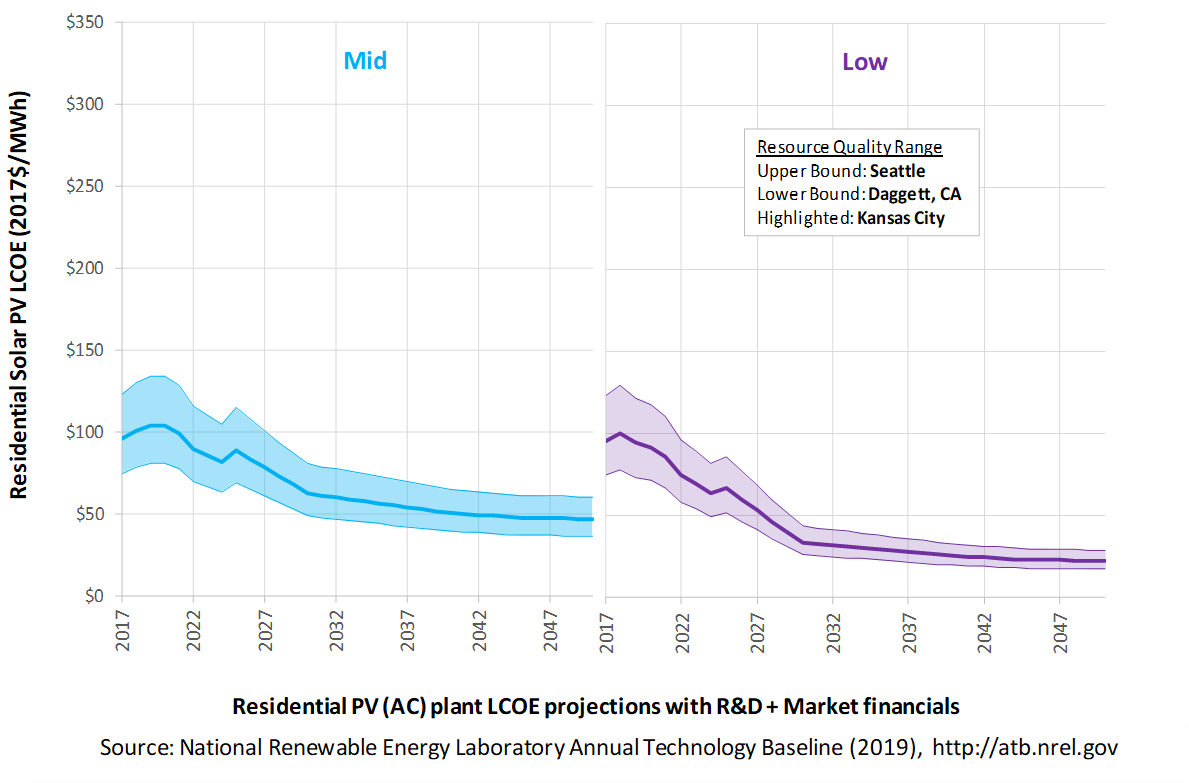
The following three figures illustrate LCOE, which includes the combined impact of CAPEX, O&M, and capacity factor projections for residential PV across the range of resources present in the contiguous United States. For the purposes of the ATB, the costs associated with technology and project risk in the U.S. market are represented in the financing costs but not in the upfront capital costs (e.g., developer fees and contingencies). An individual technology may receive more favorable financing terms outside of the United States, due to less technology and project risk, caused by more project development experience (e.g., offshore wind in Europe) or more government or market guarantees. The R&D Only LCOE sensitivity cases present the range of LCOE based on financial conditions that are held constant over time unless R&D affects them, and they reflect different levels of technology risk. This case excludes effects of tax reform, tax credits, and changing interest rates over time. The R&D + Market LCOE case adds to these financial assumptions: (1) the changes over time consistent with projections in the Annual Energy Outlook and (2) the effects of tax reform and tax credits. The ATB representative plant characteristics that best align with those of recently installed or anticipated near-term residential PV plants are associated with Res PV: Kansas City. Data for all the resource categories can be found in the ATB Data spreadsheet; for simplicity, not all resource categories are shown in the figures. In the R&D + Market LCOE case, there is an increase in LCOE from 2018-2020, caused by an increase WACC, and an increase from 2023-2024, caused by the reduction in tax credits.
R&D Only | R&D + Market
The methodology for representing the CAPEX, O&M, and capacity factor assumptions behind each pathway is discussed in Projections Methodology. In general, the degree of adoption of technology innovation distinguishes the Constant, Mid, and Low technology cost scenarios. These projections represent trends that reduce CAPEX and improve performance. Development of these scenarios involves technology-specific application of the following general definitions:
- Constant Technology Cost Scenario: Base Year (or near-term estimates of projects under construction) equivalent through 2050 maintains current relative technology cost differences
- Mid Technology Cost Scenario: Technology advances through continued industry growth, public and private R&D investments, and market conditions relative to current levels that may be characterized as "likely" or "not surprising"
- Low Technology Cost Scenario: technology advances that may occur with breakthroughs, increased public and private R&D investments, and/or other market conditions that lead to cost and performance levels that may be characterized as the "limit of surprise" but not necessarily the absolute low bound.
To estimate LCOE, assumptions about the cost of capital to finance electricity generation projects are required, and the LCOE calculations are sensitive to these financial assumptions. Two project finance structures are used within the ATB:
- R&D Only Financial Assumptions: This sensitivity case allows technology-specific changes to debt interest rates, return on equity rates, and debt fraction to reflect effects of R&D on technological risk perception, but it holds background rates constant at 2017 values from AEO 2019 (EIA 2019b) and excludes effects of tax reform and tax credits.
- R&D Only + Market Financial Assumptions: This sensitivity case retains the technology-specific changes to debt interest, return on equity rates, and debt fraction from the R&D Only case and adds in the variation over time consistent with AEO2019 as well as effects of tax reform and tax credits. For a detailed discussion of these assumptions, see Project Finance Impact on LCOE.
A constant cost recovery period – over which the initial capital investment is recovered – of 30 years is assumed for all technologies throughout this website, and can be varied in the ATB data spreadsheet.
The equations and variables used to estimate LCOE are defined on the Equations and Variables page. For illustration of the impact of changing financial structures such as WACC, see Project Finance Impact on LCOE. For LCOE estimates for the Constant, Mid, and Low technology cost scenarios for all technologies, see 2019 ATB Cost and Performance Summary.
In general, differences among the technology cost cases reflect different levels of adoption of innovations. Reductions in technology costs reflect the cost reduction opportunities that are listed below.
The LCOE for residential PV systems is calculated using the same financing parameters as the utility systems. Although we recognize that residential systems have a wide range of financing options available to them (e.g., cash payment, loan, and lease), we represent LCOEs using these utility-based financing calculations in order to allow better comparison against the utility system LCOEs.
- Modules
- Increased module efficiencies and increased production-line throughput to decrease CAPEX; overhead costs on a per-kilowatt basis will go down if efficiency and throughput improvement are realized
- Reduced wafer thickness or the thickness of thin-film semiconductor layers
- Development of new semiconductor materials
- Development of larger manufacturing facilities in low-cost regions
- Balance of system (BOS)
- Increased module efficiency, reducing the size of the installation
- Development of racking systems that enhance energy production or require less robust engineering
- Integration of racking or mounting components in modules
- Reduction of supply chain complexity and cost
- Creation of standard packaged system design
- Improvement of supply chains for BOS components in modules
- Improved power electronics
- Improvement of inverter prices and performance, possibly by integrating microinverters
- Decreased installation costs and margins
- Reduction of supply chain margins (e.g., profit and overhead charged by suppliers, manufacturer, distributors, and retailers); this will likely occur naturally as the U.S. PV industry grows and matures
- Streamlining of installation practices through improved workforce development and training and developing standardized PV hardware
- Expansion of access to a range of innovative financing approaches and business models
- Development of best practices for permitting interconnection and PV installation such as subdivision regulations, new construction guidelines, and design requirements.
FOM cost reduction represents optimized O&M strategies, reduced component replacement costs, and lower frequency of component replacement.
Battery Storage
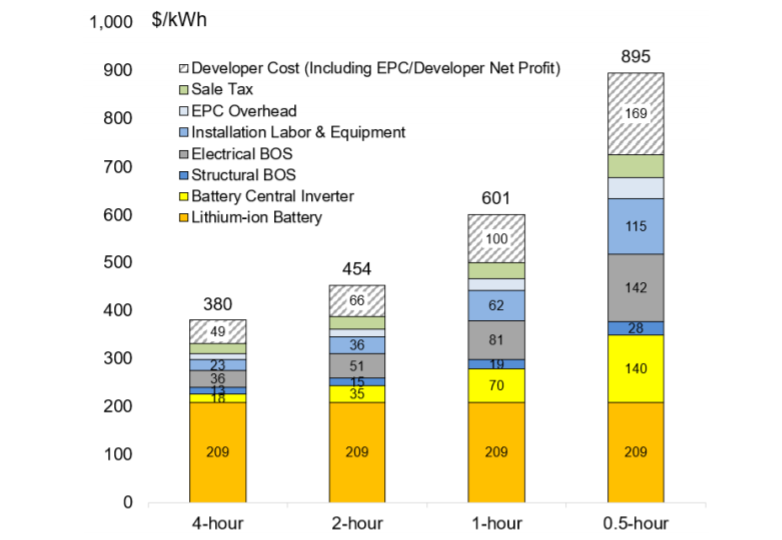
Energy storage technologies are important to document in the ATB because of their potential role in enhancing grid flexibility, especially under scenarios of high penetration of variable renewable technologies. CSP with TES and Hydropower both include storage capabilities, and a variety of other storage technologies could enhance the flexibility of the electrical grid. This section documents assumptions about only one of them: 4-hour, utility-scale, lithium-ion battery storage. NREL has completed recent analysis on ranges of costs related to other battery sizes (Fu, Remo, & Margolis, 2018) with relative costs represented in Figure ES-1 of the report (included below) which looked at 4-hour to 0.5 hour battery duration of utility scale plants.
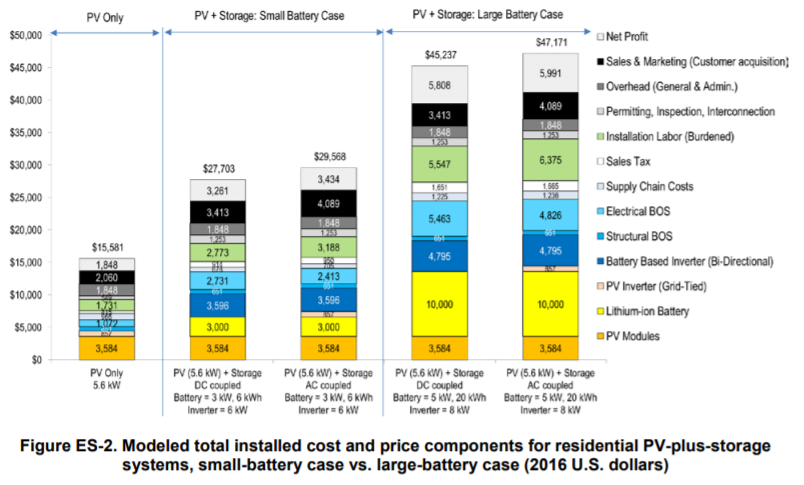
The ATB does not currently have costs for distributed battery storage-either for residential nor commercial applications behind the meter nor for a micro-grid or off-grid application. NREL has completed prior work on residential battery plus solar PV system analysis (Ardani et al., 2017) resulting in a range of costs of PV+battery systems as shown in the figure below. Note these costs are for 2016 and published in 2017, so we anticipate battery costs to be significantly lower currently.
Base Year and Future Year Projections Overview
Battery cost and performance projections are based on a literature review of 25 sources published between 2016 and 2019, as described by Cole and Frazier (2019) . Three different projections from 2017 to 2050 were developed for scenario modeling based on this literature:
- High Technology Cost Scenario: generally based on the maximum of literature projections of future CAPEX and O&M technology pathway analysis; distinct from the Constant technology cost scenarios used among renewable energy technologies in the ATB
- Mid Technology Cost Scenario: generally based on the median of literature projections of future CAPEX and O&M technology pathway analysis
- Low Technology Cost Scenario: generally based on the low bound of literature projections of future CAPEX and O&M technology pathway analysis.
Standard Scenarios Model Results
ATB CAPEX, O&M, and round-trip efficiency assumptions for the Base Year and future projections through 2050 for High, Mid, and Low technology cost scenarios are used to develop the NREL Standard Scenarios using the ReEDS model. See ATB and Standard Scenarios.
Representative Technology
The representative technology was a utility-scale lithium-ion battery storage system with a 15-year life and a 4-hour rating, meaning it could discharge at its rated capacity for four hours as described by Cole and Frazier (2019) . Within the ATB spreadsheet, the costs are separated into energy and power cost estimates, which allow capital costs to be constructed for durations other than 4 hours according to the following equation:
For more information on the power vs. energy cost breakdown, see Cole and Frazier (2019) .
Capital Expenditures (CAPEX): Historical Trends, Current Estimates, and Future Projections
Recent Trends
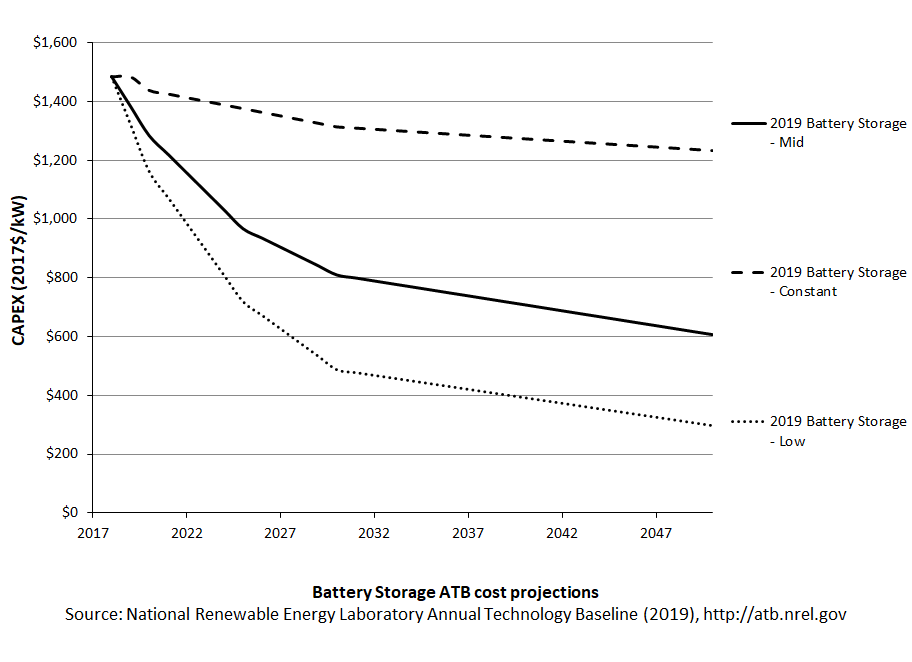
Costs of lithium-ion battery storage systems have declined rapidly in recent years, prompting greater interest in utility-scale applications.
Base Year Estimates
The Base Year cost estimate is taken from Fu, Remo, and Margolis (2018). Comparisons to other reported costs for 2018 are included in Cole, Wesley & Frazier, A. Will (2019). Although the ATB uses a 2017 Base Year, the 2018 estimate based on the literature is the first year reported in the ATB, with a value of $1,484/kW in 2017 dollars.
Future Projections
Future projections are taken from Cole and Frazier (2019), which generally used the median of published cost estimates to develop a Mid Technology Cost Scenario and the minimum values to develop a Low Technology Cost Scenario. Analysts' judgment was used to select the long-term projections to 2050 from a sparse data set.
CAPEX Definition
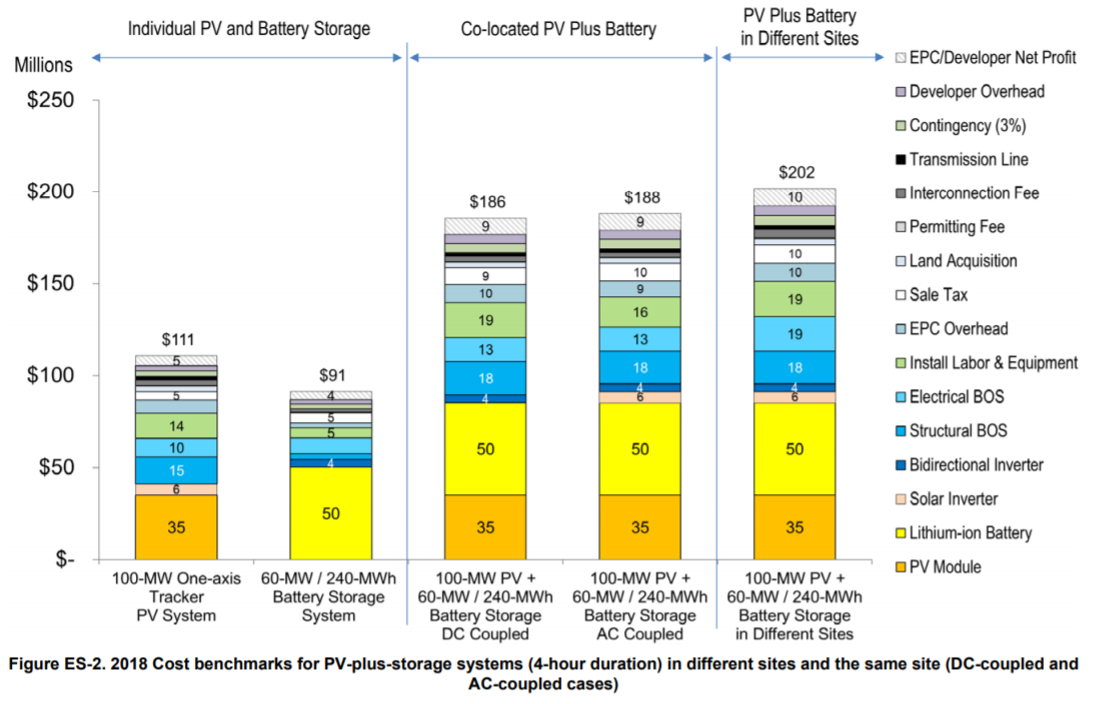
The literature review does not enumerate elements of the capital cost of lithium-ion batteries (Cole, Wesley & Frazier, A. Will, 2019). However, the NREL storage cost report does detail a breakdown of capital costs with the actual battery pack being the largest component but significant other costs are also included. This breakdown is different if the battery is part of a hybrid system with solar PV. These relative costs for utility-scale standalone battery and battery + PV are demonstrated in the figure below (Fu, Remo, & Margolis, 2018).
Operation and Maintenance (O&M) Costs
Base Year Estimates
Cole and Frazier (2019) assumed no variable operation and maintenance (VOM) cost. All operating costs were instead represented using fixed operation and maintenance (FOM) costs. The FOM costs include augmentation costs needed to keep the battery system operating at rated capacity for its lifetime. In the ATB, FOM is defined as the value needed to compensate for degradation to enable the battery system to have a constant capacity throughout its life. The literature review states that FOM costs are estimated at 2.5% of the $/kW capital costs.
Future Projections
In the ATB, the FOM cost remains constant at 2.5% of capital costs in all scenarios.
Round-trip efficiency is the ratio of useful energy output to useful energy input. Cole and Frazier (2019) identified 85% as a representative round-trip efficiency, and the ATB adopts this value.
Coal
The ATB includes three coal power plant types: coal-new, coal-IGCC, and coal-CCS. The cost and performance characteristics of these plants are adapted from EIA data rather than derived from original analysis.
Capital Expenditures (CAPEX): Historical Trends, Current Estimates, and Future Projections
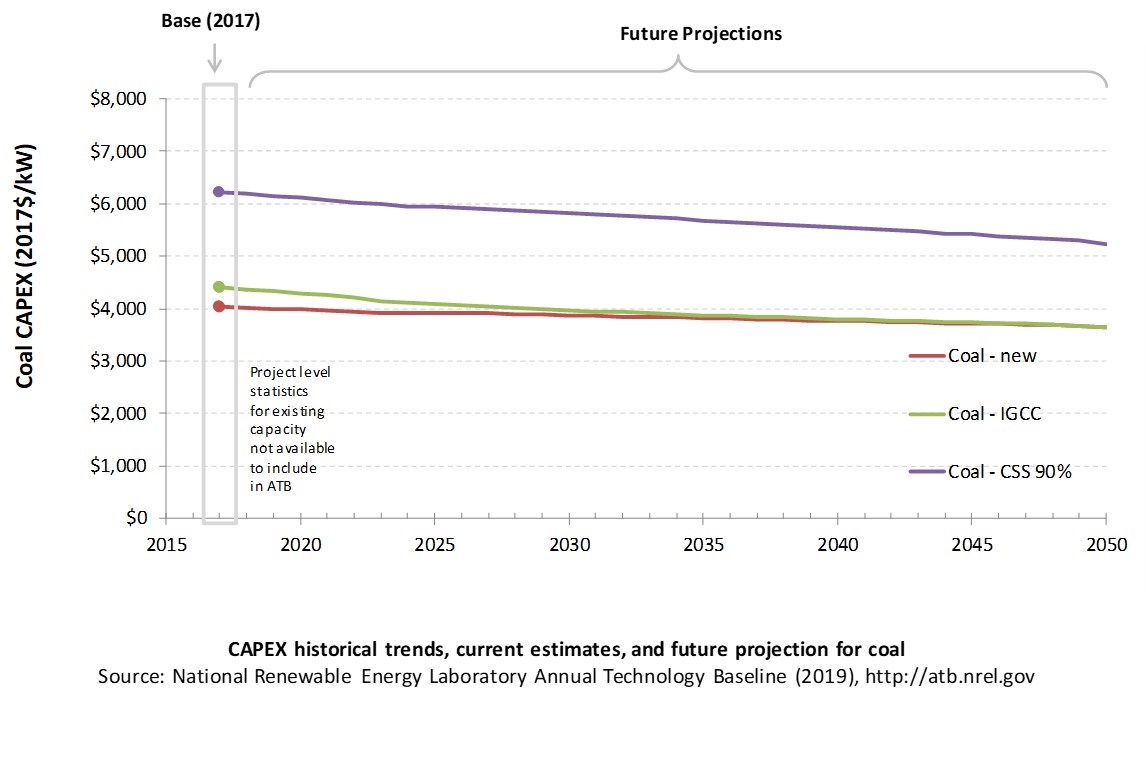
Coal power plant CAPEX is taken from the AEO2019 Reference Scenario (EIA, 2019a) with the adjustments discussed in the CAPEX definition section. The ATB includes only a single CAPEX projection for each type of coal plant.
Comparison with Other Sources
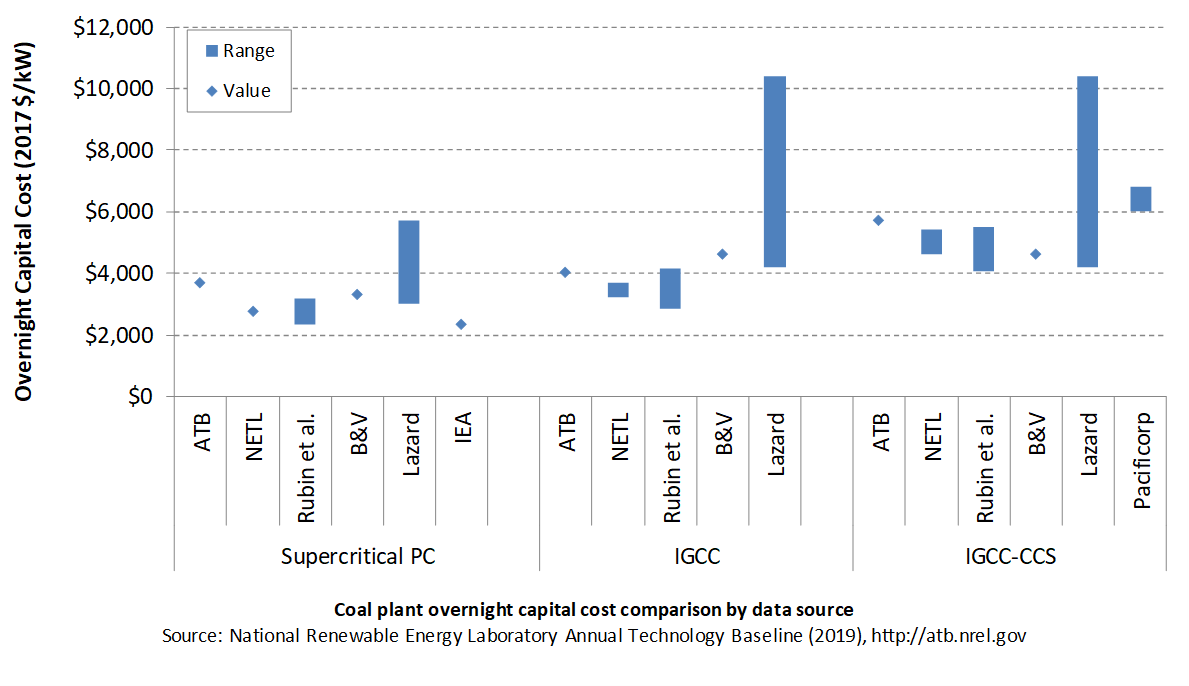
Lazard (2016) does not explicitly define its ranges with and without CCS; thus, the high end of their pulverized coal and IGCC ranges and the low end of their IGCC-CCS range are assumed to be the middle of the full reported range. All sources have been normalized to the same dollar year. Costs vary due to differences in system design (e.g., coal rank), methodology, and plant cost definitions. The coal capital costs include environmental controls to meet current federal regulations.
CAPEX Definition
Capital expenditures (CAPEX) are expenditures required to achieve commercial operation in a given year.
For coal power plants, CAPEX equals interest during construction (ConFinFactor) times the overnight capital cost (OCC).
Overnight capital costs are modified from AEO2019 (EIA, 2019a). The EIA projections were adjusted by removing the material price index. The material price index accounts for projected changes in the price index for metals and metals products, and it is independent of the learning-based cost reductions applied in the EIA projections.
For the ATB, coal-CCS technology is ultra-supercritical pulverized coal technology fitted with CCS. Both 30% capture and 90% capture options are included for the coal-CCS technology. The CCS plant configuration includes only the cost of capturing and compressing the CO2. It does not include CO2 delivery and storage.
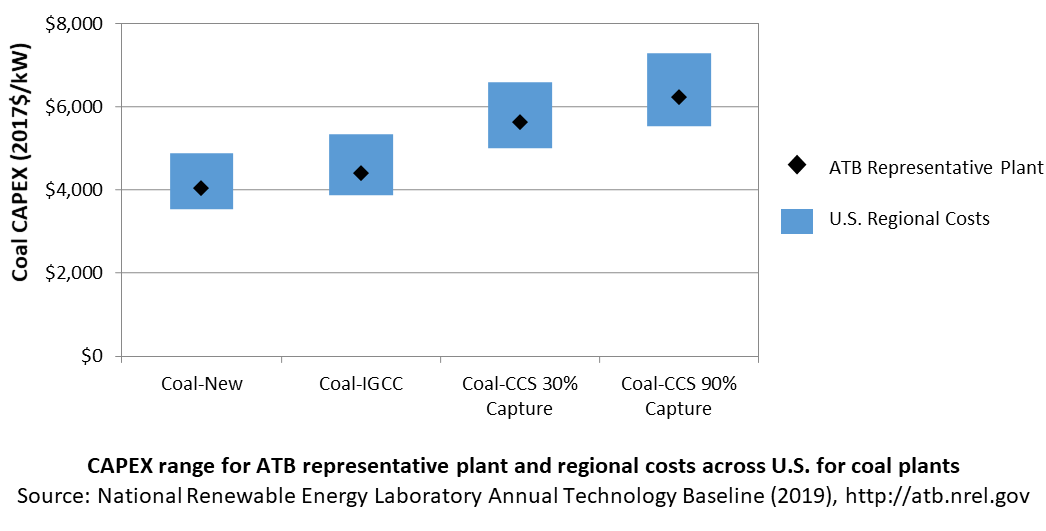
| Overnight Capital Cost ($/kW) | Construction Financing Factor (ConFinFactor) | CAPEX ($/kW) | |
| Coal-new: Ultra-supercritical pulverized coal with SO2 and NOx controls | $3,711 | 1.087 | $4,036 |
| Coal-IGCC: Integrated gasification combined cycle (IGCC) | $4,055 | 1.087 | $4,409 |
| Coal-CCS: Ultra-supercritical pulverized coal with carbon capture and sequestration (CCS) options (30% / 90% capture) | $5,180 / $5,728 | 1.087 | $5,633 / $6,229 |
CAPEX can be determined for a plant in a specific geographic location as follows:
Regional cost variations and geographically specific grid connection costs are not included in the ATB (CapRegMult = 1; GCC = 0). In the ATB, the input value is overnight capital cost (OCC) and details to calculate interest during construction (ConFinFactor).
In the ATB, CAPEX represents each type of coal plant with a unique value. Regional cost effects associated with labor rates, material costs, and other regional effects as defined by (EIA, 2016) expand the range of CAPEX. Unique land-based spur line costs based on distance and transmission line costs are not estimated. The following figure illustrates the ATB representative plant relative to the range of CAPEX including regional costs across the contiguous United States. The ATB representative plants are associated with a regional multiplier of 1.0.
Operation and Maintenance (O&M) Costs
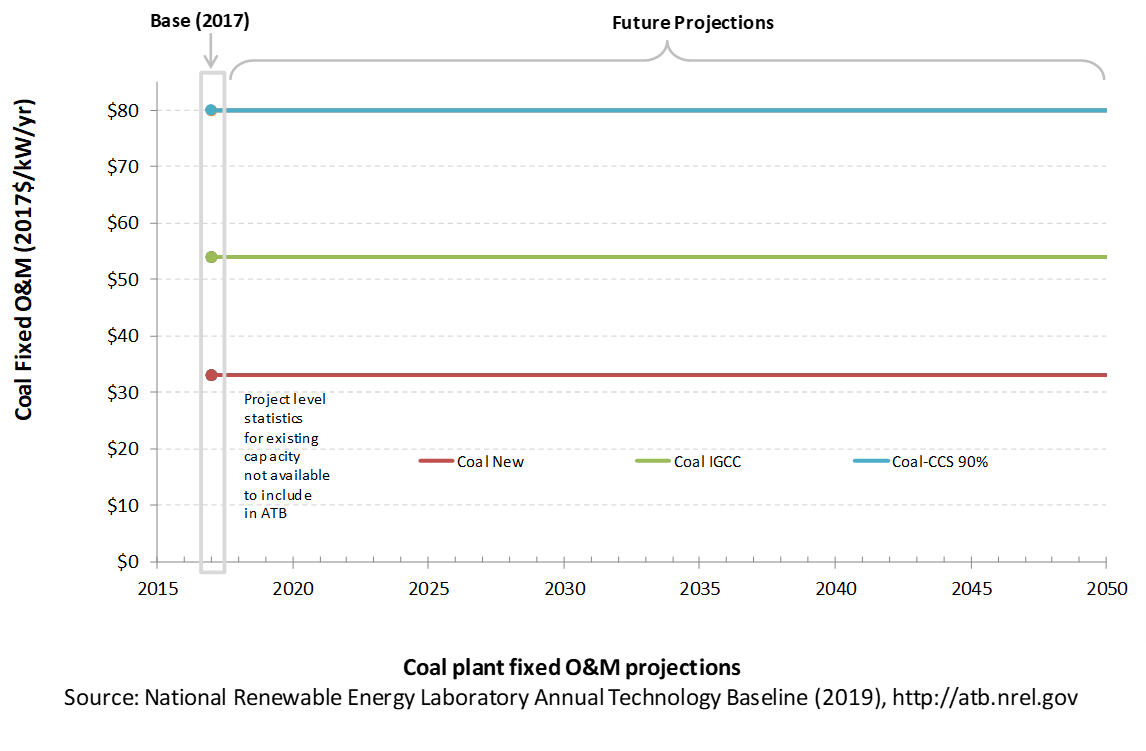
Coal power plant fixed and variable O&M costs are taken from table 8.2 of the AEO2019, and they are assumed to be constant over time.
Capacity Factor: Expected Annual Average Energy Production Over Lifetime
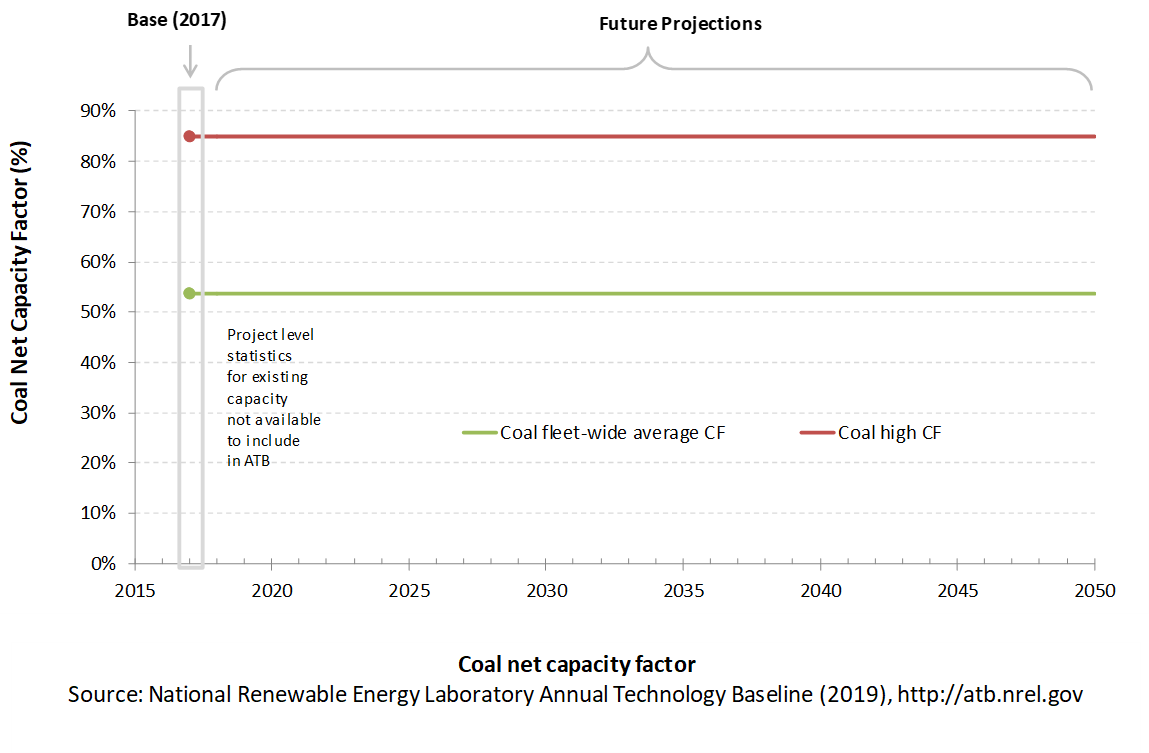
The capacity factor represents the assumed annual energy production divided by the total possible annual energy production, assuming the plant operates at rated capacity for every hour of the year. For coal plants, the capacity factors are typically lower than their availability factors. Coal plant availability factors have a wide range depending on system design and maintenance schedules.
The capacity factor of dispatchable units is typically a function of the unit's marginal costs and local grid needs (e.g., need for voltage support or limits due to transmission congestion).
Coal power plants have typically been operated as baseload units, although that has changed in many locations due to low natural gas prices and increased penetration of variable renewable technologies. The average capacity factor used in the ATB is the fleet-wide average reported by EIA for 2017. The high capacity factor represents a new plant that would operate as a baseload unit. New coal plants would likely be more efficient than existing coal plants, and therefore would be more likely to be dispatched more often, resulting in capacity factors closer to the "high" level than the "average" level, but actual capacity factors will vary based on local grid conditions and needs.
Even though IGCC and coal with CCS have experienced limited deployment in the United States, it is expected that their performance characteristics would be similar to new coal power plants.
Levelized Cost of Energy (LCOE) Projections
Levelized cost of energy (LCOE) is a summary metric that combines the primary technology cost and performance parameters: CAPEX, O&M, and capacity factor. It is included in the ATB for illustrative purposes. The ATB focuses on defining the primary cost and performance parameters for use in electric sector modeling or other analysis where more sophisticated comparisons among technologies are made. The LCOE accounts for the energy component of electric system planning and operation. The LCOE uses an annual average capacity factor when spreading costs over the anticipated energy generation. This annual capacity factor ignores specific operating behavior such as ramping, start-up, and shutdown that could be relevant for more detailed evaluations of generator cost and value. Electricity generation technologies have different capabilities to provide such services. For example, wind and PV are primarily energy service providers, while the other electricity generation technologies provide capacity and flexibility services in addition to energy. These capacity and flexibility services are difficult to value and depend strongly on the system in which a new generation plant is introduced. These services are represented in electric sector models such as the ReEDS model and corresponding analysis results such as the Standard Scenarios.
References
The following references are specific to this page; for all references in this ATB, see References.Ardani, K., O'Shaughnessy, E., Fu, R., McClurg, C., Huneycutt, J., & Margolis, R. (2017). Installed Cost Benchmarks and Deployment Barriers for Residential Solar Photovoltaics with Energy Storage: Q1 2016 (No. NREL/TP-7A40-67474). Retrieved from National Renewable Energy Laboratory website: Installed Cost Benchmarks and Deployment Barriers for Residential Solar Photovoltaics with Energy Storage: Q1 2016
Barbose, G., & Darghouth, N. (2018). Tracking the Sun XI: The Installed Price of Residential and Non-Residential Photovoltaic Systems in the United States (No. LBNL-2001062). https://doi.org/10.2172/1477384
Black & Veatch. (2012). Cost and Performance Data for Power Generation Technologies. Retrieved from Black & Veatch Corporation website: https://www.bv.com/docs/reports-studies/nrel-cost-report.pdf
Bolinger, M., & Seel, J. (2018). Utility-Scale Solar: An Empirical Trends in Project Technology, Cost, Performance, and PPA Pricing in the United States (2018 Edition). Retrieved from Lawrence Berkeley National Laboratory website: https://emp.lbl.gov/sites/default/files/lbnl_utility_scale_solar_2018_edition_report.pdf
Cole, W., Lewis, H., Sigrin, B., & Margolis, R. (2016). Interactions of Rooftop PV Deployment with the Capacity Expansion of the Bulk Power System. Applied Energy, 168, 473–481. https://doi.org/10.1016/j.apenergy.2016.02.004
Cole, Wesley, & Frazier, A. Will. (2019). Cost Projections for Utility-Scale Battery Storage (No. NREL/TP-6A20-73222). Retrieved from National Renewable Energy Laboratory website: https://www.nrel.gov/docs/fy19osti/73222.pdf
EIA. (2016b). Capital Cost Estimates for Utility Scale Electricity Generating Plants. Retrieved from U.S. Energy Information Administration website: https://www.eia.gov/analysis/studies/powerplants/capitalcost/pdf/capcost_assumption.pdf
EIA. (2019a). Annual Energy Outlook 2019 with Projections to 2050. Retrieved from U.S. Energy Information Administration website: https://www.eia.gov/outlooks/aeo/pdf/AEO2019.pdf
Feldman, D., & Margolis, R. (2018, November). Q2/Q3 2018 Solar Industry Update. Retrieved from https://www.nrel.gov/docs/fy19osti/72810.pdf
Fu, R., Feldman, D., & Margolis, R. (2018). U.S. Solar Photovoltaic System Cost Benchmark: Q1 2018. https://doi.org/10.2172/1484344
Fu, R., Remo, T. W., & Margolis, R. M. (2018). 2018 U.S. Utility-Scale Photovoltaics-Plus-Energy Storage System Costs Benchmark (No. NREL/TP-6A20-71714). https://doi.org/10.2172/1483474
Gagnon, P., Margolis, R., Melius, J., Phillips, C., & Elmore, R. (2016). Rooftop Solar Photovoltaic Technical Potential in the United States: A Detailed Assessment (No. NREL/TP-6A20-65298). https://doi.org/10.2172/1236153
IEA. (2016). World Energy Outlook 2016 (No. WEO2016). Retrieved from International Energy Agency website: https://webstore.iea.org/world-energy-outlook-2016
Labastida, R. R., & Gauntlett, D. (2016). Next-Generation Solar PV: High Efficiency Solar PV Modules and Module-Level Power Electronics: Global Market Analysis and Forecasts [Market Report]. Chicago, IL: Navigant Research.
Lazard. (2016). Lazard's Levelized Cost of Energy Analysis: Version 10.0. Retrieved from Lazard website: https://www.lazard.com/media/438038/levelized-cost-of-energy-v100.pdf
Lopez, A., Roberts, B., Heimiller, D., Blair, N., & Porro, G. (2012). U.S. Renewable Energy Technical Potentials: A GIS-Based Analysis (Technical Report No. NREL/TP-6A20-51946). https://doi.org/10.2172/1219777
Rubin, E. S., Davison, J. E., & Herzog, H. J. (2015). The Cost of CO2 Capture and Storage. International Journal of Greenhouse Gas Control, 40, 378–400. https://doi.org/10.1016/j.ijggc.2015.05.018
Zoelle, A., Keairns, D., Pinkerton, L. L., Turner, M. J., Woods, M., Kuehn, N., … Chou, V. (2015). Cost and Performance Baseline for Fossil Energy Plants Volume 1a: Bituminous Coal (PC) and Natural Gas to Electricity Revision 3 (No. DOE/NETL-2015/1723). https://doi.org/10.2172/1480987

