Geothermal
CAPEX Definition
Capital expenditures (CAPEX) are expenditures required to achieve commercial operation in a given year.
For the ATB – and based on (EIA, 2016) and GETEM component cost calculations – the geothermal plant envelope is defined to include:
- Geothermal generation plant
- Exploration, confirmation drilling, well field development, reservoir stimulation (EGS), plant equipment, and plant construction
- Power plant equipment, well-field equipment, and components for wells (including dry/non-commercial wells)
- Balance of system (BOS)
- Installation and electrical infrastructure, such as transformers, switchgear, and electrical system connecting turbines to each other and to the control center
- Project indirect costs, including costs related to engineering, distributable labor and materials, construction management start up and commissioning, and contractor overhead costs, fees, and profit
- Financial costs
- Owners' costs, such as development costs, preliminary feasibility and engineering studies, environmental studies and permitting, legal fees, insurance costs, and property taxes during construction
- Electrical interconnection and onsite electrical equipment (e.g., switchyard), a nominal-distance spur line (<1 mile), and necessary upgrades at a transmission substation; distance-based spur line cost (GCC) not included in the ATB
- Interest during construction estimated based on four-year and five-year duration for hydrothermal and EGS respectively (for the low scenario) and an eight-year duration and ten-year duration for hydrothermal and EGS respectively (for the mid- and constant-scenario) accumulated at different intervals for hydro and EGS based on scheduled at outlined by the GeoVision Study (ConFinFactor).
CAPEX can be determined for a plant in a specific geographic location as follows:
Regional cost variations and geographically specific grid connection costs are not included in the ATB (CapRegMult = 1; GCC = 0). In the ATB, the input value is overnight capital cost (OCC) and details to calculate interest during construction (ConFinFactor).
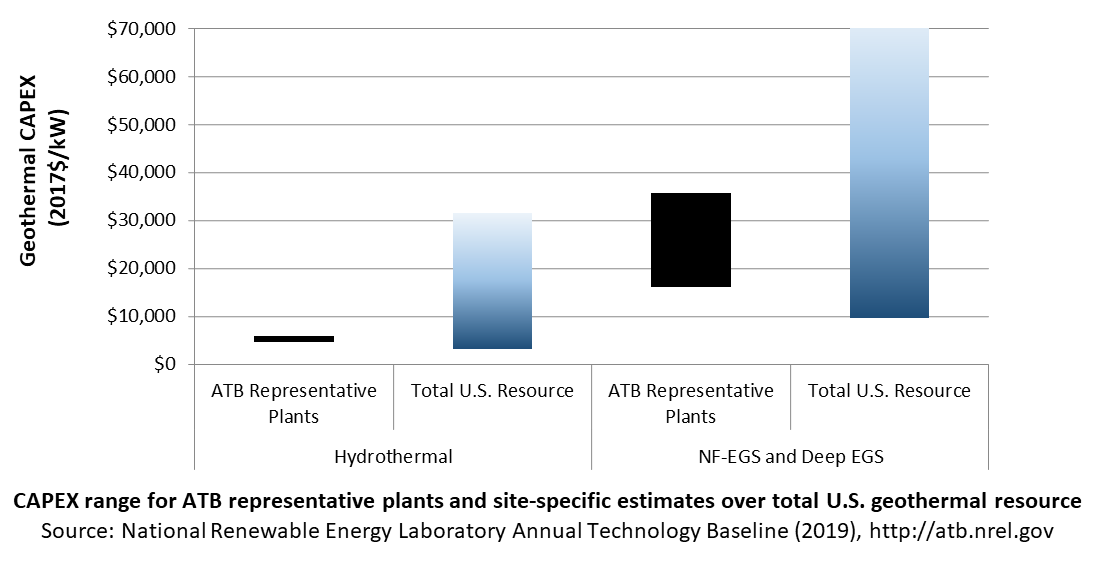
In the ATB, CAPEX is shown for six representative plants. Examples of CAPEX for binary organic Rankine cycle and flash energy conversion processes in each of three geothermal resource types are presented. CAPEX estimates for all hydrothermal NF-EGS potential results in a CAPEX range that is much broader than that shown in the ATB. It is unlikely that all the resource potential will be developed due to the high costs for some sites. Regional cost effects and distance-based spur line costs are not estimated.

Standard Scenarios Model Results
ATB CAPEX, O&M, and capacity factor assumptions for the Base Year and future projections through 2050 for Constant, Mid, and Low technology cost scenarios are used to develop the NREL Standard Scenarios using the ReEDS model. See ATB and Standard Scenarios.
The ReEDS model represents cost and performance for hydrothermal, NF-EGS, and EGS potential in 5 bins for each of 134 geographic regions, resulting in a greater CAPEX range in the reference supply curve than what is shown in examples in the ATB.
CAPEX in the ATB does not represent regional variants (CapRegMult) associated with labor rates, material costs, etc., and neither does the ReEDS model.
CAPEX in the ATB does not include geographically determined spur line (GCC) from plant to transmission grid, and neither does the ReEDS model.
Operations and maintenance (O&M) costs represent average annual fixed expenditures (and depend on rated capacity) required to operate and maintain a hydrothermal plant over its lifetime of 30 years (plant and reservoir), including:
- Insurance, taxes, land lease payments, and other fixed costs
- Present value and annualized large component overhaul or replacement costs over technical life (e.g., downhole pumps)
- Scheduled and unscheduled maintenance of geothermal plant components and well field components over the technical lifetime of the plant and reservoir.
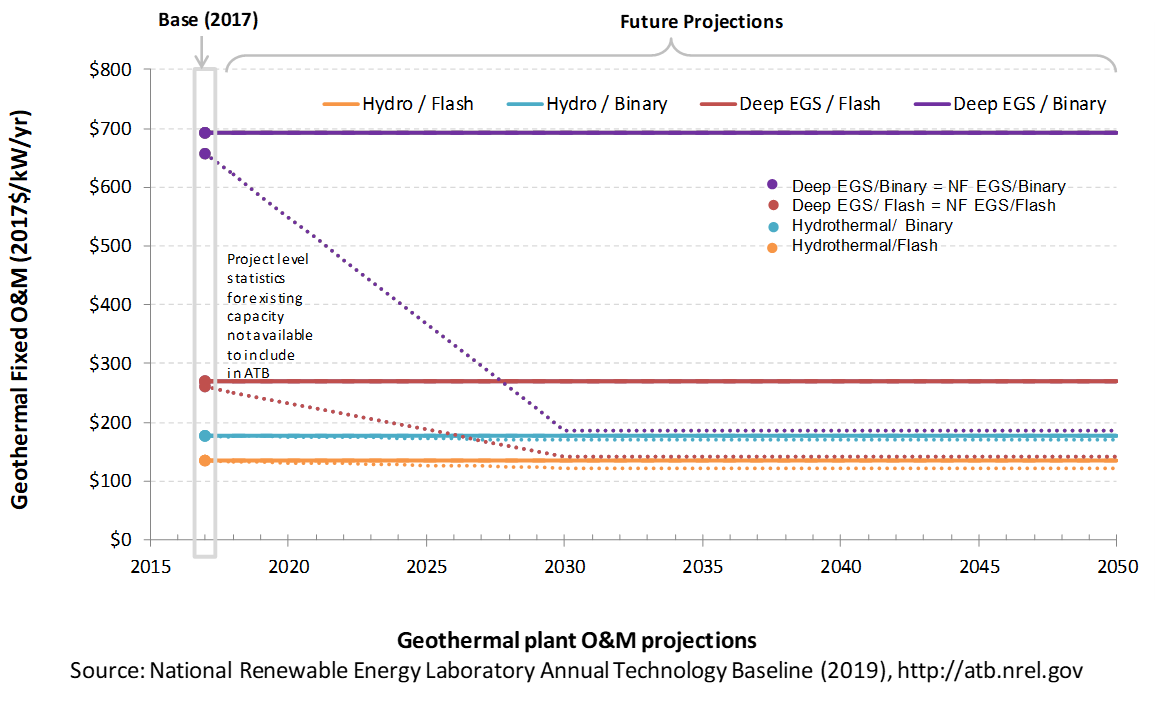
The following figure shows the Base Year estimate and future year projections for fixed O&M (FOM) costs. Three cost scenarios are represented. The estimate for a given year represents annual average FOM costs expected over the technical lifetime of a new plant that reaches commercial operation in that year.

Base Year Estimates
FOM is estimated for each example of a plant based on technical characteristics.
GETEM is used to estimate FOM for each of the six representative plants. FOM for NF-EGS and EGS are equivalent.
Future Year Projections
Future FOM cost reductions are based on results from the GeoVision scenario (DOE, 2019) and are described in detail in Augustine, Ho, and Blair (2019).
References
The following references are specific to this page; for all references in this ATB, see References.Augustine, Chad, Ho, J., & Blair, N. (2019). GeoVision Analysis Supporting Task Force Report: Electric Sector Potential to Penetration (No. NREL/ TP-6A20-71833). Retrieved from National Renewable Energy Laboratory website: https://www.nrel.gov/docs/fy19osti/71833.pdf
DOE. (2019). GeoVision: Harnessing the Heat Beneath Our Feet (No. DOE/EE-1306). Retrieved from U.S. Department of Energy website: https://www.energy.gov/eere/geothermal/geovision
EIA. (2016b). Capital Cost Estimates for Utility Scale Electricity Generating Plants. Retrieved from U.S. Energy Information Administration website: https://www.eia.gov/analysis/studies/powerplants/capitalcost/pdf/capcost_assumption.pdf
