
Offshore Wind
CAPEX Definition
Capital expenditures (CAPEX) are expenditures required to achieve commercial operation in a given year.
Based on Moné at al. (2015) and Beiter et al. (2016), the System Cost Breakdown Structure of the ATB for the wind plant envelope is defined to include:
- Wind turbine supply
- Balance of system (BOS)
- Turbine installation, substructure supply and installation
- Site preparation, port and staging area support for delivery, storage, handling, and installation of underground utilities
- Electrical infrastructure, such as transformers, switchgear, and electrical system connecting turbines to each other (array cable system costs) and to the cable landfall (export cable system costs)
- Development and project management
- Financial costs
- Owners' costs, such as development costs, preliminary feasibility and engineering studies, environmental studies and permitting, legal fees, insurance costs, and property taxes during construction
- Interest during construction estimated based on three-year duration accumulated 40%/40%/20% at half-year intervals and an 8% interest rate (ConFinFactor).
CAPEX can be determined for a plant in a specific geographic location as follows:
Regional cost variations are not included in the ATB (CapRegMult = 1). In the ATB, the input value is overnight capital cost (OCC) and details to calculate interest during construction (ConFinFactor). Because transmission infrastructure between an offshore wind plant and the point at which a grid connection is made onshore is a significant component of the offshore wind plant cost, an offshore spur line cost (OffSpurCost) for each TRG is included in the CAPEX estimate. The offshore spur line cost reflects a capacity-weighted average of all potential wind plant areas within a TRG, similar to OCC.
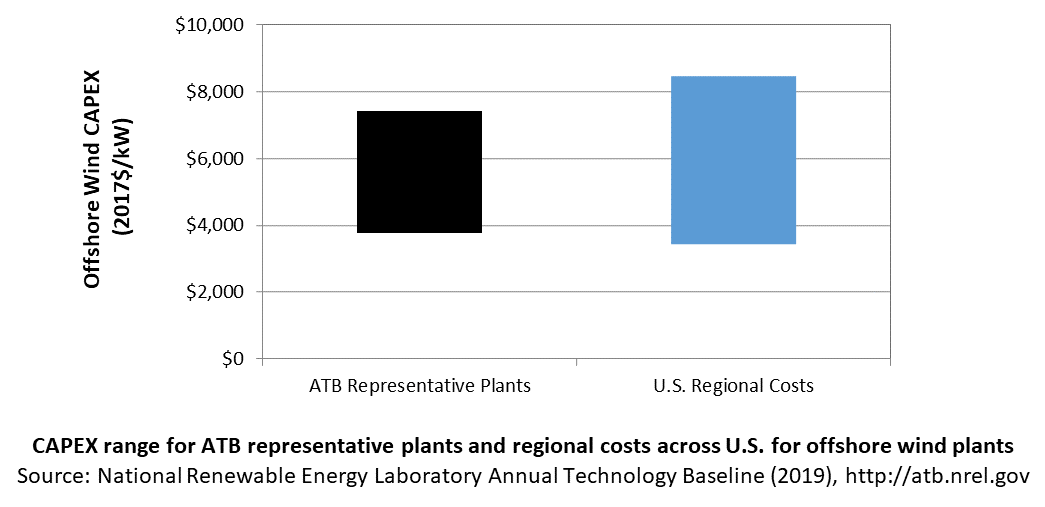
In the ATB, CAPEX represents the capacity-weighted average values of all potential wind plant areas within a TRG and varies with water depth and distance from shore. Regional cost effects associated with labor rates, material costs, and other regional effects as defined by DOE and NREL (2015) expand the range of CAPEX. Unique land-based spur line costs for each of the 7,000 areas based on distance and transmission line costs expand the range of CAPEX even further. The following figure illustrates the ATB representative plants relative to the range of CAPEX including regional costs across the contiguous United States. The ATB representative plants are associated with a regional multiplier of 1.0.
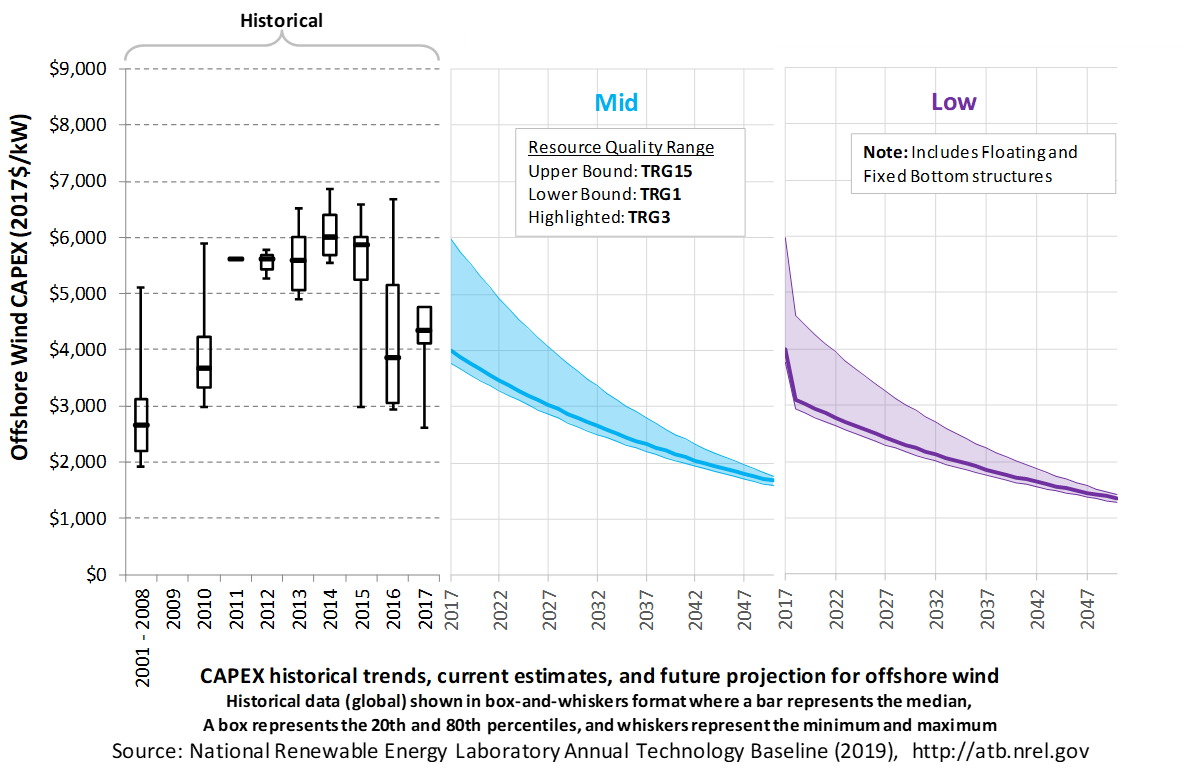
The following figure shows the Base Year estimate and future year projections for CAPEX costs. Mid and Low technology cost scenarios are shown. Historical data from offshore wind plants installed globally are shown for comparison to the ATB Base Year estimates. The estimate for a given year represents CAPEX of a new plant that reaches commercial operation in that year.
Recent Trends
Actual global offshore wind plant CAPEX is shown in box-and-whiskers format for comparison to the ATB current CAPEX estimates and future projections. CAPEX estimates for 2017 correspond well with market data for plants installed in 2017. Projections reflect a continuation of the downward trend observed in the recent past and are anticipated to continue based on preliminary data for 2017 projects.
Base Year Estimates
Base Year estimates for CAPEX were derived using an updated version of NREL's Offshore Regional Cost Analyzer (ORCA) (Beiter et al. 2016). A variety of spatial parameters were considered, such as water depth, distance from shore, distance to ports, and wave height to estimate CAPEX. CAPEX estimates were calibrated to correspond to the latest cost and technology trends observed in the U.S. and European offshore wind markets, including:
- Turbine CAPEX: $1,300/kW were assumed for the Base Year to account for decreases in Turbine CAPEX that were observed in global offshore wind markets.
- Turbine Rating: A turbine technology trend of 6 MW (Base Year), 8 MW (2022 commercial operation date [COD]), 10 MW (2027 COD), and 10 MW (2032 COD) was assumed to correspond to recent technology trends. While higher turbine ratings may be commercially available during this period (e.g., up to 15-MW turbine ratings are expected to be commercially available by the early 2030s), the selected turbine ratings are intended to reflect the average turbine rating of the operating U.S. offshore wind fleet.
- Export System Cable Costs: A reduction of 25% in comparison to an earlier version of ORCA (Beiter et al. 2016) was assumed for the Base Year to account for increased competition within the supply chain in recent years and for changes in material use and commodity prices.
- Cost Reduction Trajectory: Recent literature was surveyed to identify the most up-to-date cost reduction trends expected for U.S. and European offshore wind projects; the version of ORCA used to estimate cost reduction trajectories are derived from Valpy et al. (2017)(fixed bottom) and Hundleby et al. (2017) (floating).
- Contingency Levels: A markup of 25% on top of European contingency levels was assumed to account for the higher risk of installing and operating early offshore wind farms in the United States.
- Lease Area Price: This cost to projects was included to account for the recent increase in the tendered U.S. lease area prices.
Future Year Projections
- Mid Technology Cost Scenario: CAPEX percentage reduction estimated from BVG ((Valpy et al. 2017) for fixed-bottom and (Hundleby et al. 2017)) from the Base Year, which is intended to correspond to a 50% probability of exceedance.
- Low Technology Cost Scenario: CAPEX deviation from the Mid Technology Cost Scenario in CAPEX, O&M, or capacity factor from 2017 to 2050 informed by analysts' bottom-up technology and cost modeling. This scenario is intended to correspond to a 10%-30% probability of exceedance.
A detailed description of the methodology for developing future year projections is found in Projections Methodology.
Technology innovations that could impact future O&M costs are summarized in LCOE Projections.
Standard Scenarios Model Results
ATB CAPEX, O&M, and capacity factor assumptions for the Base Year and future projections through 2050 for Constant, Mid, and Low technology cost scenarios are used to develop the NREL Standard Scenarios using the ReEDS model. See ATB and Standard Scenarios.
CAPEX in the ATB does not represent regional variants (CapRegMult) associated with labor rates, material costs, etc., but the ReEDS model does include 134 regional multipliers (EIA 2013).
The ReEDS model determines offshore spur line and land-based spur line (GCC) uniquely for each of the 7,000 areas based on distance and transmission line cost.
References
The following references are specific to this page; for all references in this ATB, see References.Beiter, P., Musial, W., Smith, A., Kilcher, L., Damiani, R., Maness, M., … Scott, G. (2016). A Spatial-Economic Cost-Reduction Pathway Analysis for U.S. Offshore Wind Energy Development from 2015-2030 (Technical Report No. NREL/TP-6A20-66579). https://doi.org/10.2172/1324526
DOE, & NREL. (2015). Wind Vision: A New Era for Wind Power in the United States (Technical Report No. DOE/GO-102015-4557). Retrieved from U.S. Department of Energy website: https://www.nrel.gov/docs/fy15osti/63197-2.pdf
EIA. (2013). Updated Capital Cost Estimates for Utility Scale Electricity Generating Plants. Retrieved from U.S. Energy Information Administration website: https://www.eia.gov/analysis/studies/powerplants/capitalcost/archive/2013/pdf/updated_capcost.pdf
Hundleby, G., Freeman, K., Logan, A., & Frost, C. (2017). Floating Offshore: 55 Technology Innovations that will have greater impact on reducing the cost of electricity from European floating offshore wind farms. Retrieved from KiC InnoEnergy and BVG Associates website.
Moné, C., Smith, A., Maples, B., & Hand, M. (2015). 2013 Cost of Wind Energy Review (No. NREL/TP-5000-63267). https://doi.org/10.2172/1172936
Valpy, B., Hundleby, G., Freeman, K., Roberts, A., & Logan, A. (2017). Future renewable energy costs: Offshore wind. Retrieved from KiC InnoEnergy and BVG Associates website: http://www.innoenergy.com/wp-content/uploads/2014/09/InnoEnergy-Offshore-Wind-anticipated-innovations-impact-2017_A4.pdf