
Concentrating Solar Power
Levelized Cost of Energy (LCOE) Projections
Levelized cost of energy (LCOE) is a summary metric that combines the primary technology cost and performance parameters: CAPEX, O&M, and capacity factor. It is included in the ATB for illustrative purposes. The ATB focuses on defining the primary cost and performance parameters for use in electric sector modeling or other analysis where more sophisticated comparisons among technologies are made. The LCOE accounts for the energy component of electric system planning and operation. The LCOE uses an annual average capacity factor when spreading costs over the anticipated energy generation. This annual capacity factor ignores specific operating behavior such as ramping, start-up, and shutdown that could be relevant for more detailed evaluations of generator cost and value. Electricity generation technologies have different capabilities to provide such services. For example, wind and PV are primarily energy service providers, while the other electricity generation technologies such as CSP can provide capacity and flexibility services in addition to energy. These capacity and flexibility services are difficult to value and depend strongly on the system in which a new generation plant is introduced. These services are represented in electric sector models such as the ReEDS model and corresponding analysis results such as the Standard Scenarios.
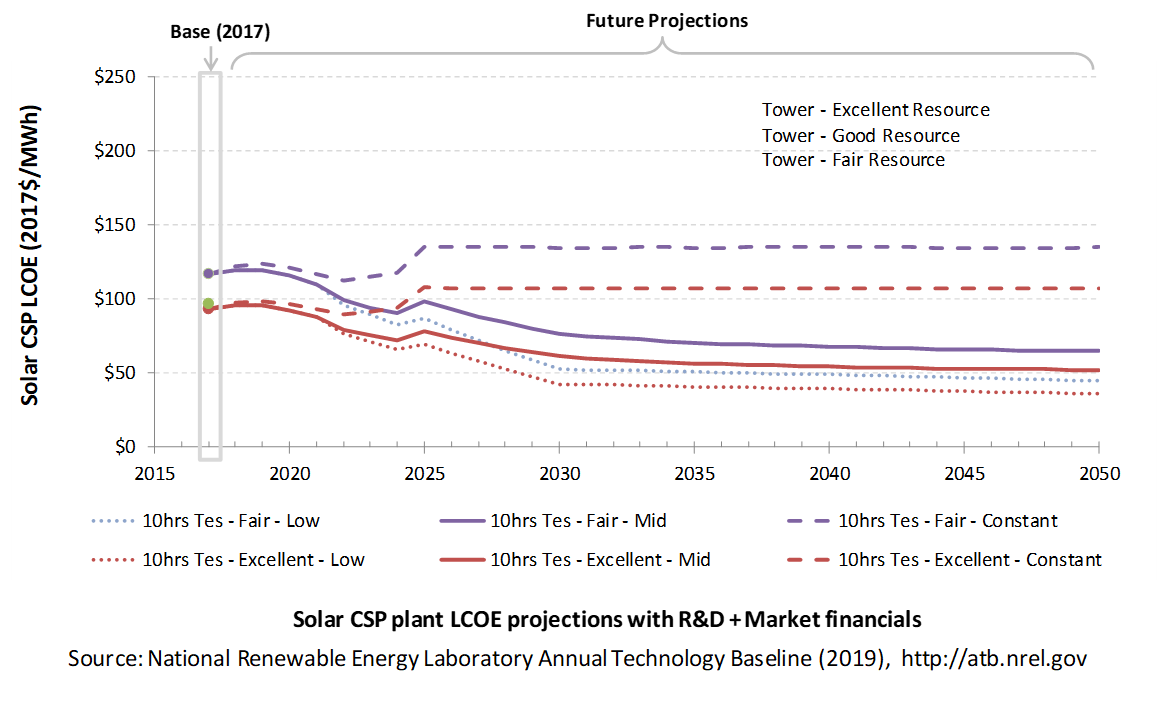
The following three figures illustrate LCOE, which includes the combined impact of CAPEX, O&M, and capacity factor projections for power-tower CSP across the range of resources present in the contiguous United States. For the purposes of the ATB, the costs associated with technology and project risk in the U.S. market are represented in the financing costs but not in the upfront capital costs (e.g., developer fees and contingencies). An individual technology may receive more favorable financing terms outside the United States, due to less technology and project risk, caused by more project development experience (e.g., offshore wind in Europe) or more government or market guarantees. The R&D Only LCOE sensitivity cases present the range of LCOE based on financial conditions that are held constant over time unless R&D affects them, and they reflect different levels of technology risk. This case excludes effects of tax reform, tax credits, and changing interest rates over time. The R&D + Market LCOE case adds to these financial assumptions: (1) the changes over time consistent with projections in the Annual Energy Outlook and (2) the effects of tax reform and tax credits. For example, the projected LCOE for most utility scale renewable energy generation technologies could potentially increase from the end of 2020 due to the decreasing levels of the ITC. The ATB representative plant characteristics that best align with those of recently installed or anticipated near-term CSP plants are associated with Tower-Excellent Resource. Data for all the resource categories can be found in the ATB Data spreadsheet; for simplicity, not all resource categories are shown in the figures.
Note: the future projection of the "Good resource" (i.e., for a CSP plant built in Phoenix, Arizona) is not shown in the figures to simplify the figures and because the projection lies between the Excellent and the Fair Resource projections.
R&D Only | R&D + Market

 R&D + Market
The methodology for representing the CAPEX, O&M, and capacity factor assumptions behind each pathway is discussed in Projections Methodology. In general, the degree of adoption of technology innovation distinguishes the Constant, Mid, and Low technology cost scenarios. These projections represent trends that reduce CAPEX and improve performance. Development of these scenarios involves technology-specific application of the following general definitions:
- Constant Technology: Base Year (or near-term estimates of projects under construction) equivalent through 2050 maintains current relative technology cost differences
- Mid Technology Cost Scenario: Technology advances through continued industry growth, public and private R&D investments, and market conditions relative to current levels that may be characterized as "likely" or "not surprising"
- Low Technology Cost Scenario: Technology advances that may occur with breakthroughs, increased public and private R&D investments, and/or other market conditions that lead to cost and performance levels that may be characterized as the " limit of surprise" but not necessarily the absolute low bound.
To estimate LCOE, assumptions about the cost of capital to finance electricity generation projects are required, and the LCOE calculations are sensitive to these financial assumptions. Two project finance structures are used within the ATB:
- R&D Only Financial Assumptions: This sensitivity case allows technology-specific changes to debt interest rates, return on equity rates, and debt fraction to reflect effects of R&D on technological risk perception, but it holds background rates constant at 2017 values from AEO2019 (EIA 2019) and excludes effects of tax reform and tax credits.
- R&D Only + Market Financial Assumptions: This sensitivity case retains the technology-specific changes to debt interest, return on equity rates, and debt fraction from the R&D Only case and adds in the variation over time consistent with AEO2019 (EIA 2019) as well as effects of tax reform and tax credits. For a detailed discussion of these assumptions, see Project Finance Impact on LCOE.
A constant cost recovery period – over which the initial capital investment is recovered – of 30 years is assumed for all technologies throughout this website, and can be varied in the ATB data spreadsheet.
The equations and variables used to estimate LCOE are defined on the Equations and Variables page. For illustration of the impact of changing financial structures such as WACC, see Project Finance Impact on LCOE. For LCOE estimates for the Constant, Mid, and Low technology cost scenarios for all technologies, see 2019 ATB Cost and Performance Summary.
For illustration of the impact of changing financial structures such as WACC, see Project Finance Impact on LCOE. For LCOE estimates for the Constant, Mid, and Low technology cost scenarios for all technologies, see 2019 ATB Cost and Performance Summary.
In general, differences among the technology cost cases reflect different levels of adoption of innovations. Reductions in technology costs reflect the cost reduction opportunities that are listed below.
- Power tower improvements
- Better and longer-lasting selective surface coatings improve receiver efficiency and reduce O&M costs.
- New salts allow for higher operating temperatures and lower-cost TES.
- Development of the power cycle running at approximately 700°C and 55% gross efficiency improves cycle efficiency, reduces powerblock cost, and reduces O&M costs.
- Lower-cost heliostats developed due to design changes and automated and high-volume manufacturing.
- General and "soft" costs improvements
- Expansion of world market leads to greater and more efficient supply chains, and reduction of supply chain margins (e.g., profit and overhead charged by suppliers, manufacturer, distributors, and retailers).
- Expansion of access to a range of innovative financing approaches and business models
- The LCOE range shown is based on locations with Fair (Abilene, Texas), Good (Phoenix, Arizona), and Excellent (Daggett, California) resources. The CAPEX is the same for each resource as the same plant is used. Future-year LCOE projections for the Good case are not shown to simplify the figure. Using the R&D Only scenario and financials, and with the capacity factor of 64% for Daggett, California (NREL n.d.), in the Mid case by 2030, the LCOE could reach approximately 55$/MWh, and it could potentially reach $47/MWh by 2050.
References
The following references are specific to this page; for all references in this ATB, see References.EIA. (2019a). Annual Energy Outlook 2019 with Projections to 2050. Retrieved from U.S. Energy Information Administration website: https://www.eia.gov/outlooks/aeo/pdf/AEO2019.pdf
NREL. (n.d.b). System Advisor Model (SAM). Retrieved January 26, 2018, from National Renewable Energy Laboratory website: https://sam.nrel.gov/