
Offshore Wind
Representative Technology
In 2016, the first offshore wind plant (30 MW) commenced commercial operation in the United States near Block Island (Rhode Island). In 2018, Vineyard Wind LLC and Massachusetts electric distribution companies submitted a 20-year power purchase agreement (PPA) for 800 MW of offshore wind generation and renewable energy certificates to the Massachusetts Department of Public Utilities for review and approval. In the ATB, cost and performance estimates are made for commercial-scale projects with 600 MW in capacity. The ATB Base Year offshore wind plant technology reflects a machine rating of 6 MW with a rotor diameter of 155 m and hub height of 100 m, which is typical of European projects installed in 2016 and 2017 and the turbine rating installed at the Block Island Wind Farm (GE Haliade 150-6MW).
Resource Potential
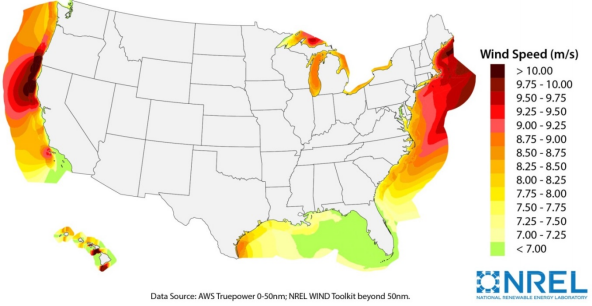
Wind resource is prevalent throughout major U.S. coastal areas, including the Great Lakes. The resource potential exceeds 2,000 GW, excluding Alaska, based on domain boundaries from 50 nautical miles (nm) to 200 nm, turbine hub heights of 100 m (previously 90 m), and a capacity array power density of 3 MW/km2(Walt Musial et al. 2016). A range of technology exclusions were applied based on maximum water depth for deployment, minimum wind speed, and limits to floating technology in freshwater surface ice. Resource potential was represented by more than 7,000 areas for offshore wind plant deployment after accounting for competing use and environmental exclusions, such as marine protected areas, shipping lanes, pipelines, and others.
Base Year and Future Year Projections Overview
Based on a resource assessment (Walt Musial et al. 2016), LCOE was estimated at more than 7,000 areas (with a total capacity of approximately 2,000 GW). Using an updated version of NREL's Offshore Regional Cost Analyzer (ORCA) (Beiter et al. 2016), a variety of spatial parameters were considered, such as wind speeds, water depth, distance from shore, distance to ports, and wave height. CAPEX, O&M, and capacity factor are calculated for each geographic location using engineering models, hourly wind resource profiles, and representative sea states. ORCA was calibrated to the latest cost and technology trends observed in the U.S. and European offshore wind markets, including:
- Turbine CAPEX: $1,300/kW were assumed for the Base Year to account for decreases in Turbine CAPEX that were observed in global offshore wind markets.
- Turbine Rating: A turbine technology trend of 6 MW (Base Year), 8 MW (2022 commercial operation date [COD]), 10 MW (2027 COD), and 10 MW (2032 COD) was assumed to correspond to recent technology trends. While higher turbine ratings may be commercially available during this period (e.g., up to 15-MW turbine ratings are expected to be commercially available by the early 2030s), the selected turbine ratings are intended to reflect the average turbine rating of the operating U.S. offshore wind fleet.
- Export System Cable Costs: A reduction of 25% in comparison to an earlier version of ORCA (Beiter et al. 2016) was assumed for the Base Year to account for increased competition within the supply chain in recent years and for changes in material use and commodity prices.
- Cost Reduction Trajectory: Recent literature was surveyed to identify the most up-to-date cost reduction trends expected for U.S. and European offshore wind projects; the version of ORCA used to estimate cost reduction trajectories are derived from Valpy et al. (2017)(fixed bottom) and Hundleby et al. (2017)(floating).
- Contingency Levels: A markup of 25% above of European contingency levels was assumed to account for the higher risk of installing and operating early offshore wind farms in the United States.
- Lease Area Price: This cost to projects was included to account for the recent increase in the tendered U.S. lease area prices.
The spatial LCOE assessment served as the basis for estimating the ATB baseline LCOE in the Base Year 2017, weighted by the available capacity, for fixed-bottom and floating offshore wind technology. Only sites that exceed a distance to cable landfall of 20 kilometers (km) and a water depth of 10 meters (m) were included in the spatial assessment for the ATB to represent those sites only that are likely to be developed in the near-to-medium term. Long-term average hourly wind profiles are assumed and estimated LCOE reflects the least-cost choice among four substructure types (Beiter et al. 2016):
- Monopile (fixed-bottom)
- Jacket (fixed-bottom)
- Semi-submersible (floating)
- Spar (floating).
The representative offshore wind plant size is assumed to be 600 MW (Beiter et al. 2016). For illustration in the ATB, the full resource potential, represented by 7,000 areas, was divided into 15 techno-resource groups (TRGs), of which TRGs 1-5 are representative of fixed-bottom wind technology and TRGs 6-15 are representative of floating offshore wind technology. The capacity-weighted average CAPEX, O&M, grid connection costs, and capacity factor for each group are presented in the ATB.
For illustration in the ATB, all potential offshore wind plant areas were represented in 15 TRGs with TRGs 1-5 representing fixed-bottom offshore technology and TRGs 6-15 representing floating offshore wind technology. These were defined by resource potential (GW) and have higher resolution on the least-cost TRGs, as these are the most likely sites to be deployed, based on their economics. The following table summarizes the capacity-weighted average water depth, distance to cable landfall, and cost and performance parameters for each TRG. The table includes the relative resource potential. Typical offshore wind installations in 2017 that have spatial and economic conditions that may lend themselves well to near-term deployment are associated with TRG 3.
TRG Definitions for Offshore Wind
| TRG | Weighted Water Depth (m) | Weighted Distance Site to Cable Landfall (km) | Weighted Average CAPEX ($/kW) | Weighted Average OPEX ($/kW/yr) | Weighted Average Net CF (%) | Potential Wind Plant Capacity of Fixed-Bottom/Floating Total (%) | |
| Fixed-Bottom | TRG 1 | 18 | 27 | 3,361 | 105 | 45 | 2 |
| TRG 2 | 22 | 29 | 3,475 | 106 | 44 | 3 | |
| TRG 3 | 24 | 33 | 3,660 | 109 | 44 | 7 | |
| TRG 4 | 29 | 57 | 4,001 | 112 | 41 | 44 | |
| TRG 5 | 31 | 65 | 4,633 | 107 | 30 | 44 | |
| Floating | TRG 6 | 144 | 38 | 4,602 | 77 | 52 | 1 |
| TRG 7 | 159 | 45 | 4,661 | 78 | 51 | 2 | |
| TRG 8 | 157 | 46 | 4,710 | 78 | 49 | 4 | |
| TRG 9 | 148 | 64 | 4,936 | 84 | 49 | 8 | |
| TRG 10 | 107 | 101 | 5,209 | 91 | 47 | 15 | |
| TRG 11 | 375 | 116 | 5,320 | 98 | 43 | 15 | |
| TRG 12 | 467 | 116 | 5,331 | 97 | 36 | 15 | |
| TRG 13 | 663 | 166 | 5,785 | 92 | 34 | 15 | |
| TRG 14 | 432 | 147 | 6,145 | 87 | 30 | 15 | |
| TRG 15 | 468 | 133 | 6,599 | 83 | 28 | 11 | |
Future year projections for CAPEX, O&M, and capacity factor in the "Mid Technology Cost" Scenario are derived from the estimated cost reduction potential for offshore wind technologies based on assessments by BVG Associates ((Valpy et al. 2017), (Hundleby et al. 2017)) for 2017-2032. Based on the modeled data between 2017-2032, an (exponential) trend fit is derived for CAPEX, O&M in the "Mid Technology Cost" Scenario, and capacity factor to extrapolate ATB data for years 2033-2050. The specific scenarios are:
- Constant Technology Cost Scenario: no change in CAPEX, O&M, or capacity factor from 2015 to 2050; consistent across all renewable energy technologies in the ATB.
- Mid Technology Cost Scenario: LCOE percentage reduction estimated from BVG ((Valpy et al. 2017), (Hundleby et al. 2017)) from the Base Year, which is intended to correspond to a 50% probability of exceedance.
- Low Technology Cost Scenario: LCOE deviation from the Mid Technology Cost Scenario in CAPEX, O&M, or capacity factor from 2017 to 2050 informed by analysts' bottom-up technology and cost modeling. This scenario is intended to correspond to a 10%-30% probability of exceedance.
Capital Expenditures (CAPEX): Historical Trends, Current Estimates, and Future Projections
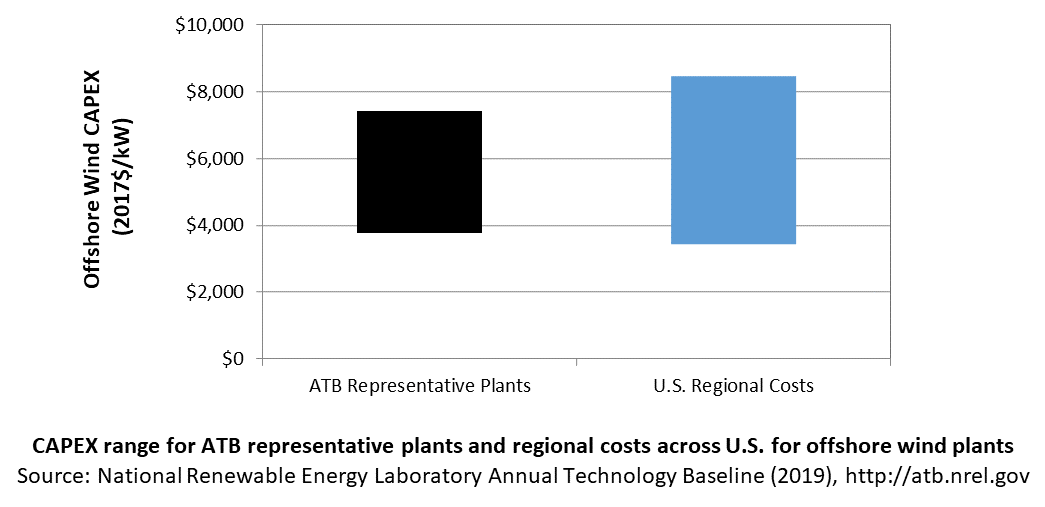
Capital expenditures (CAPEX) are expenditures required to achieve commercial operation in a given year. These expenditures include the wind turbine, the balance of system (e.g., site preparation, installation, and electrical infrastructure), and financial costs (e.g., development costs, onsite electrical equipment, and interest during construction) and are detailed in CAPEX Definition. In the ATB, CAPEX reflects typical plants and does not include differences in regional costs associated with labor, materials, taxes, or system requirements. The related Standard Scenarios product uses Regional CAPEX Adjustments. The range of CAPEX demonstrates variation with spatial site parameters in the contiguous United States.
CAPEX Definition
Capital expenditures (CAPEX) are expenditures required to achieve commercial operation in a given year.
Based on Moné at al. (2015) and Beiter et al. (2016), the System Cost Breakdown Structure of the ATB for the wind plant envelope is defined to include:
- Wind turbine supply
- Balance of system (BOS)
- Turbine installation, substructure supply and installation
- Site preparation, port and staging area support for delivery, storage, handling, and installation of underground utilities
- Electrical infrastructure, such as transformers, switchgear, and electrical system connecting turbines to each other (array cable system costs) and to the cable landfall (export cable system costs)
- Development and project management
- Financial costs
- Owners' costs, such as development costs, preliminary feasibility and engineering studies, environmental studies and permitting, legal fees, insurance costs, and property taxes during construction
- Interest during construction estimated based on three-year duration accumulated 40%/40%/20% at half-year intervals and an 8% interest rate (ConFinFactor).
CAPEX can be determined for a plant in a specific geographic location as follows:
Regional cost variations are not included in the ATB (CapRegMult = 1). In the ATB, the input value is overnight capital cost (OCC) and details to calculate interest during construction (ConFinFactor). Because transmission infrastructure between an offshore wind plant and the point at which a grid connection is made onshore is a significant component of the offshore wind plant cost, an offshore spur line cost (OffSpurCost) for each TRG is included in the CAPEX estimate. The offshore spur line cost reflects a capacity-weighted average of all potential wind plant areas within a TRG, similar to OCC.
In the ATB, CAPEX represents the capacity-weighted average values of all potential wind plant areas within a TRG and varies with water depth and distance from shore. Regional cost effects associated with labor rates, material costs, and other regional effects as defined by DOE and NREL (2015) expand the range of CAPEX. Unique land-based spur line costs for each of the 7,000 areas based on distance and transmission line costs expand the range of CAPEX even further. The following figure illustrates the ATB representative plants relative to the range of CAPEX including regional costs across the contiguous United States. The ATB representative plants are associated with a regional multiplier of 1.0.
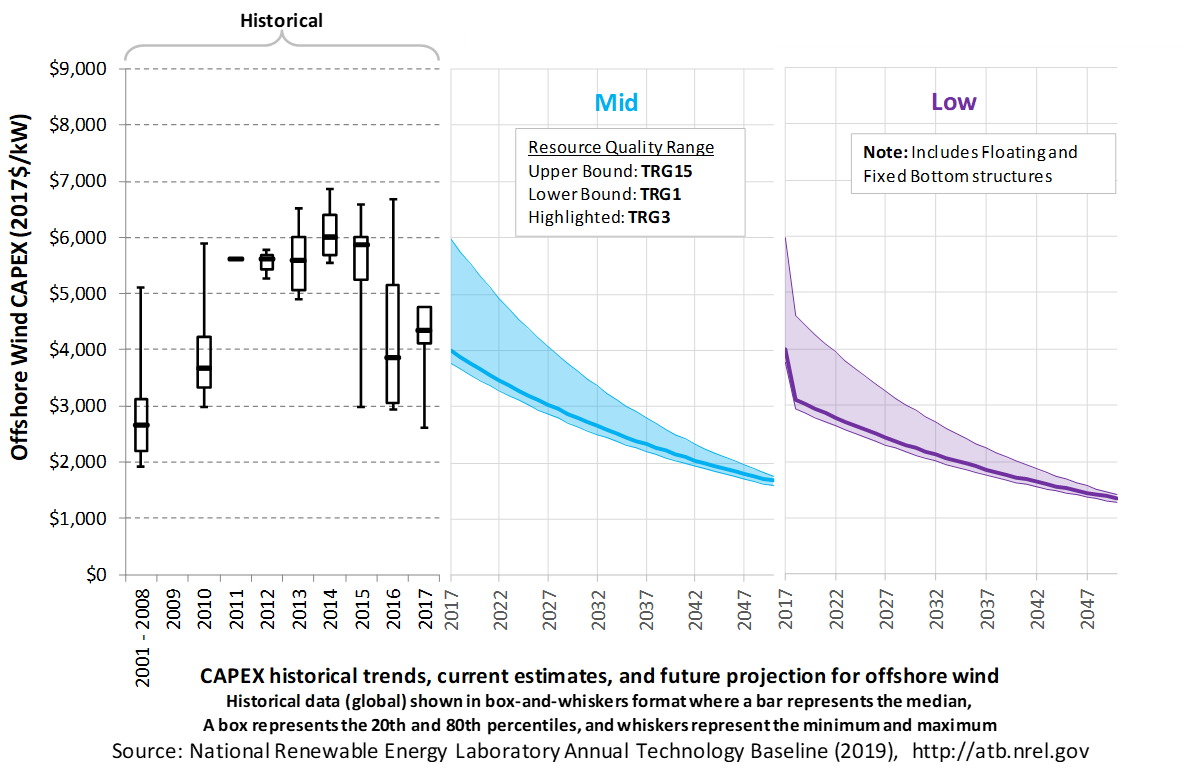
The following figure shows the Base Year estimate and future year projections for CAPEX costs. Mid and Low technology cost scenarios are shown. Historical data from offshore wind plants installed globally are shown for comparison to the ATB Base Year estimates. The estimate for a given year represents CAPEX of a new plant that reaches commercial operation in that year.
Recent Trends
Actual global offshore wind plant CAPEX is shown in box-and-whiskers format for comparison to the ATB current CAPEX estimates and future projections. CAPEX estimates for 2017 correspond well with market data for plants installed in 2017. Projections reflect a continuation of the downward trend observed in the recent past and are anticipated to continue based on preliminary data for 2017 projects.
Base Year Estimates
Base Year estimates for CAPEX were derived using an updated version of NREL's Offshore Regional Cost Analyzer (ORCA) (Beiter et al. 2016). A variety of spatial parameters were considered, such as water depth, distance from shore, distance to ports, and wave height to estimate CAPEX. CAPEX estimates were calibrated to correspond to the latest cost and technology trends observed in the U.S. and European offshore wind markets, including:
- Turbine CAPEX: $1,300/kW were assumed for the Base Year to account for decreases in Turbine CAPEX that were observed in global offshore wind markets.
- Turbine Rating: A turbine technology trend of 6 MW (Base Year), 8 MW (2022 commercial operation date [COD]), 10 MW (2027 COD), and 10 MW (2032 COD) was assumed to correspond to recent technology trends. While higher turbine ratings may be commercially available during this period (e.g., up to 15-MW turbine ratings are expected to be commercially available by the early 2030s), the selected turbine ratings are intended to reflect the average turbine rating of the operating U.S. offshore wind fleet.
- Export System Cable Costs: A reduction of 25% in comparison to an earlier version of ORCA (Beiter et al. 2016) was assumed for the Base Year to account for increased competition within the supply chain in recent years and for changes in material use and commodity prices.
- Cost Reduction Trajectory: Recent literature was surveyed to identify the most up-to-date cost reduction trends expected for U.S. and European offshore wind projects; the version of ORCA used to estimate cost reduction trajectories are derived from Valpy et al. (2017)(fixed bottom) and Hundleby et al. (2017) (floating).
- Contingency Levels: A markup of 25% on top of European contingency levels was assumed to account for the higher risk of installing and operating early offshore wind farms in the United States.
- Lease Area Price: This cost to projects was included to account for the recent increase in the tendered U.S. lease area prices.
Future Year Projections
- Mid Technology Cost Scenario: CAPEX percentage reduction estimated from BVG ((Valpy et al. 2017) for fixed-bottom and (Hundleby et al. 2017)) from the Base Year, which is intended to correspond to a 50% probability of exceedance.
- Low Technology Cost Scenario: CAPEX deviation from the Mid Technology Cost Scenario in CAPEX, O&M, or capacity factor from 2017 to 2050 informed by analysts' bottom-up technology and cost modeling. This scenario is intended to correspond to a 10%-30% probability of exceedance.
A detailed description of the methodology for developing future year projections is found in Projections Methodology.
Technology innovations that could impact future O&M costs are summarized in LCOE Projections.
Standard Scenarios Model Results
ATB CAPEX, O&M, and capacity factor assumptions for the Base Year and future projections through 2050 for Constant, Mid, and Low technology cost scenarios are used to develop the NREL Standard Scenarios using the ReEDS model. See ATB and Standard Scenarios.
CAPEX in the ATB does not represent regional variants (CapRegMult) associated with labor rates, material costs, etc., but the ReEDS model does include 134 regional multipliers (EIA 2013).
The ReEDS model determines offshore spur line and land-based spur line (GCC) uniquely for each of the 7,000 areas based on distance and transmission line cost.
Operation and Maintenance (O&M) Costs
Operations and maintenance (O&M) costs represent the annual fixed expenditures required to operate and maintain a wind plant over its lifetime, including:
- Insurance, taxes, land lease payments and other fixed costs (e.g., project management and administration, weather forecasting, and condition monitoring)
- Present value and annualized large component replacement costs over technical life (e.g., blades, gearboxes, and generators)
- Scheduled and unscheduled maintenance of wind plant components, including turbines and transformers, over the technical lifetime of the plant.
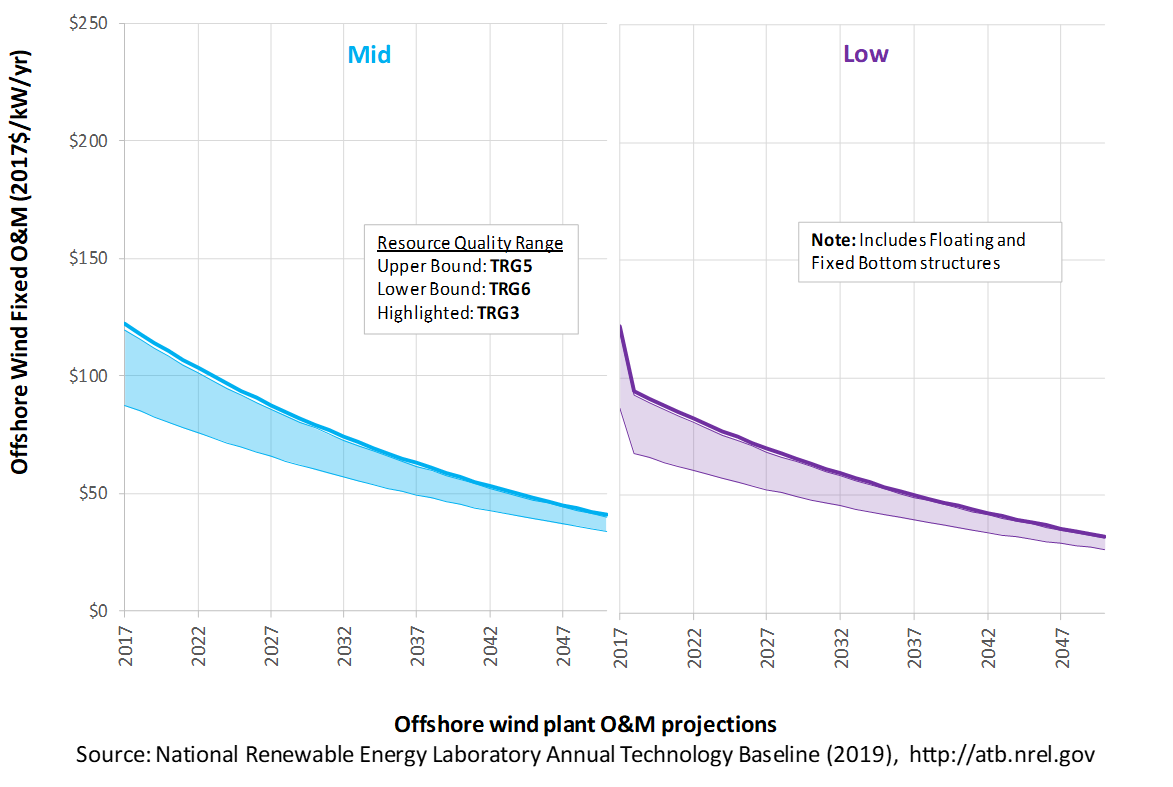
The following figure shows the Base Year estimate and future year projections for fixed and floating O&M (FOM) costs. Mid and Low technology cost scenarios are shown. The estimate for a given year represents annual average FOM costs expected over the technical lifetime of a new plant that reaches commercial operation in that year. The range of Base Year O&M estimates reflect the variation in spatial parameters such as distance from shore and metocean conditions.
Base Year Estimates
FOM costs vary by distance from shore and metocean conditions. As a result, O&M costs in the "Mid Technology Cost Scenario" vary from $87/kW-year (TRG 6) to $127/kW-year (TRG 4) in 2017. The average in the ATB "Mid Technology Cost Scenario" for fixed-bottom offshore technology (TRGs 1-5) is $121/kW-year; the corresponding value for floating offshore wind technology (TRGs 6-15) is $97/kW-year.
Future Year Projections
Future fixed-bottom offshore wind technology O&M is estimated to decline 66% by 2050 in the Mid cost case.
Future floating offshore wind technology O&M is estimated to decline 61% by 2050 in the Mid cost case.
A detailed description of the methodology for developing future year projections is found in Projections Methodology.
Technology innovations that could impact future O&M costs are summarized in LCOE Projections.
Capacity Factor: Expected Annual Average Energy Production Over Lifetime
The capacity factor represents the expected annual average energy production divided by the annual energy production, assuming the plant operates at rated capacity for every hour of the year. It is intended to represent a long-term average over the lifetime of the plant. It does not represent interannual variation in energy production. Future year estimates represent the estimated annual average capacity factor over the technical lifetime of a new plant installed in a given year.
The capacity factor is influenced by the rotor swept area/generator capacity, hub height, hourly wind profile, expected downtime, and energy losses within the wind plant. It is referenced to 100-m above-water-surface, long-term average hourly wind resource data from Musial et al. (2016).
The following figure shows a range of capacity factors based on variation in the wind resource for offshore wind plants in the contiguous United States. Preconstruction estimates for offshore wind plants operating globally in 2015, according to the year in which plants were installed, is shown for comparison to the ATB Base Year estimates. The range of Base Year estimates illustrates the effect of locating an offshore wind plant in a variety of wind resource (TRGs 1-5 are fixed-bottom offshore wind plants and TRGs 6-15 are floating offshore wind plants). Future projections are shown for Mid and Low technology cost scenarios.
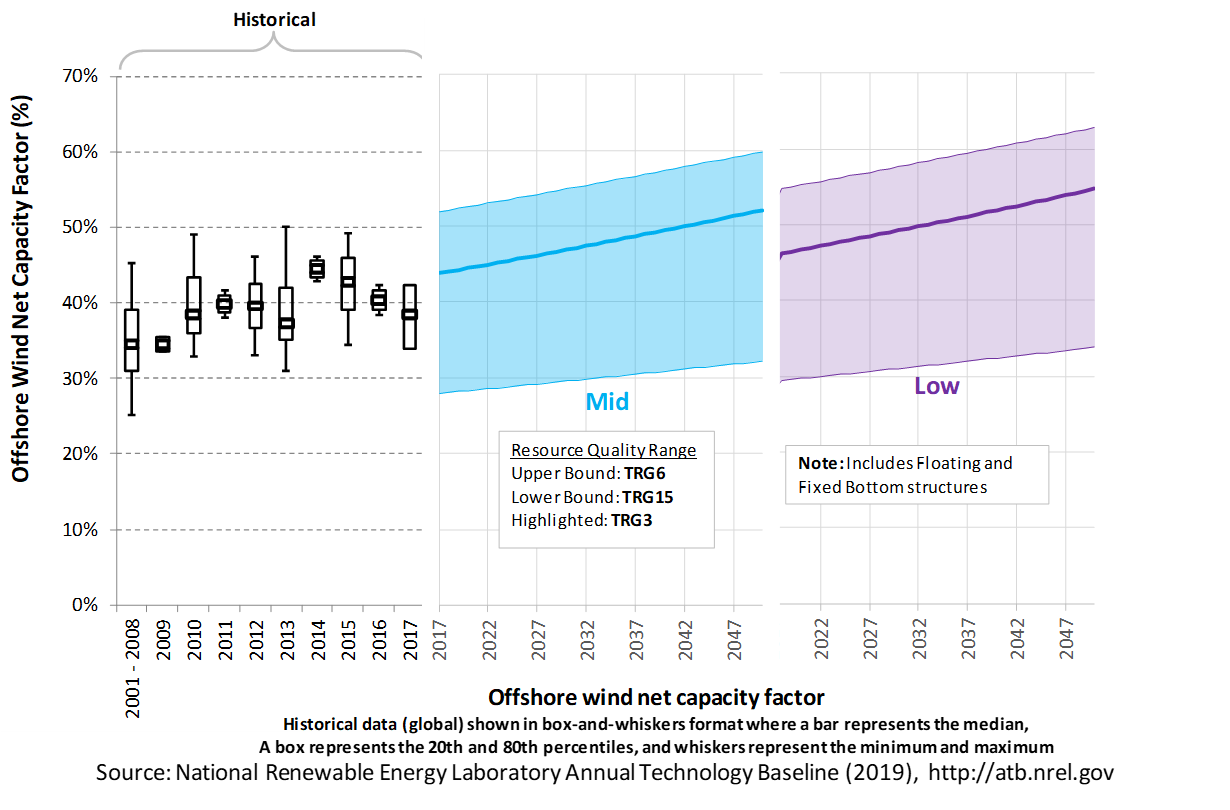
Recent Trends
Preconstruction annual energy estimates from publicly available global operating wind capacity in 2017 (Walter Musial et al. forthcoming) are shown in a box-and-whiskers format for comparison with the ATB current estimates and future projections. The historical data illustrate preconstruction estimated capacity factors for projects by year of commercial online date. The figure shows the comparison between the range of capacity factors defined by the ATB TRGs and the reported capacity factors for projects installed in 2017.
Base Year Estimates
The capacity factor is determined using a representative power curve for a generic NREL-modeled 6-MW offshore wind turbine (Beiter et al. 2016) and includes geospatial estimates of gross capacity factors for the entire resource area (Walt Musial et al. 2016). The net capacity factor considers spatial variation in wake losses, electrical losses, turbine availability, and other system losses. For illustration in the ATB, all 7,000 wind plant areas are represented in 15 TRGs.
Future Year Projections
Projections of capacity factors for plants installed in future years were determined based on estimates obtained from BVG ((Valpy et al. 2017), (Hundleby et al. 2017)) for both fixed-bottom and floating offshore wind technologies. Projections for capacity factors implicitly reflect technology innovations such as larger rotors and taller towers that will increase energy capture at the same geographic location without explicitly specifying tower height and rotor diameter changes.
A detailed description of the methodology for developing future year projections is found in Projections Methodology.
Technology innovations that could impact future O&M costs are summarized in LCOE Projections.
Standard Scenarios Model Results
ATB CAPEX, O&M, and capacity factor assumptions for the Base Year and future projections through 2050 for Constant, Mid, and Low technology cost scenarios are used to develop the NREL Standard Scenarios using the ReEDS model. See ATB and Standard Scenarios.
The ReEDS model output capacity factors for offshore wind can be lower than input capacity factors due to endogenously estimated curtailments determined by scenario constraints.
Plant Cost and Performance Projections Methodology
ATB projections between the Base Year and 2032 (COD) were derived from an expert elicitation conducted by BVG Associates ((Valpy et al. 2017), (Hundleby et al. 2017)). The expert elicitation assesses the impact of more than 50 technology innovations on various cost components of European offshore wind farms up to 2032 (COD). The cost impact from technology innovations was assessed by soliciting industry experts about the maximum cost impact from a technology innovation in combination with an assessment of an innovation's commercial readiness and market share in a given year.
For the ATB, three different technology cost scenarios were adapted from the expert survey results for scenario modeling as bounding levels:
- Constant Technology Cost Scenario: no change in CAPEX, O&M, or capacity factor from 2015 to 2050; consistent across all renewable energy technologies in the ATB.
- Mid Technology Cost Scenario: LCOE percentage reduction estimated from BVG ((Valpy et al. 2017), (Hundleby et al. 2017)) from the Base Year, intended to correspond to a 50% probability of exceedance.
- Low Technology Cost Scenario: LCOE deviation from the Mid Technology Cost Scenario in CAPEX, O&M, or capacity factor from 2017 to 2050 informed by analysts' bottom-up technology and cost modeling. This scenario is intended to correspond to a 10%-30% probability of exceedance.
Expert survey estimates from BVG Associates were normalized to the ATB Base Year starting point and applied to overnight capital costs (OCC), FOM, and annual energy production in 2022 (COD), 2027 (COD), and 2032 (COD). These serve as the ATB Mid projection between 2017-2032 (COD). The ATB Mid scenario is intended to represent a cluster of technology innovations that change the manufacturing, installation, operation, and performance of a wind farm consistent with historical cost reduction rates. The ATB Low scenario is intended to represent a cluster of technology innovations that fundamentally change the manufacturing, installation, operation and performance of a wind farm resulting in considerably higher cost reductions than the ATB Mid scenario. The ATB Low scenario is represented by cost reductions that are twice the rate achieved in the ATB Mid scenario. The percentage reduction in LCOE was applied equally across all TRGs. The cost reductions for ATB Mid and ATB Low scenarios between 2032 and 2050 were extrapolated (i.e., exponentially fit) based on the estimated trend between 2017 and 2032 (COD).
Levelized Cost of Energy (LCOE) Projections
Levelized cost of energy (LCOE) is a summary metric that combines the primary technology cost and performance parameters: CAPEX, O&M, and capacity factor. It is included in the ATB for illustrative purposes. The ATB focuses on defining the primary cost and performance parameters for use in electric sector modeling or other analysis where more sophisticated comparisons among technologies are made. The LCOE accounts for the energy component of electric system planning and operation. The LCOE uses an annual average capacity factor when spreading costs over the anticipated energy generation. This annual capacity factor ignores specific operating behavior such as ramping, start-up, and shutdown that could be relevant for more detailed evaluations of generator cost and value. Electricity generation technologies have different capabilities to provide such services. For example, wind and PV are primarily energy service providers, while the other electricity generation technologies provide capacity and flexibility services in addition to energy. These capacity and flexibility services are difficult to value and depend strongly on the system in which a new generation plant is introduced. These services are represented in electric sector models such as the ReEDS model and corresponding analysis results such as the Standard Scenarios.
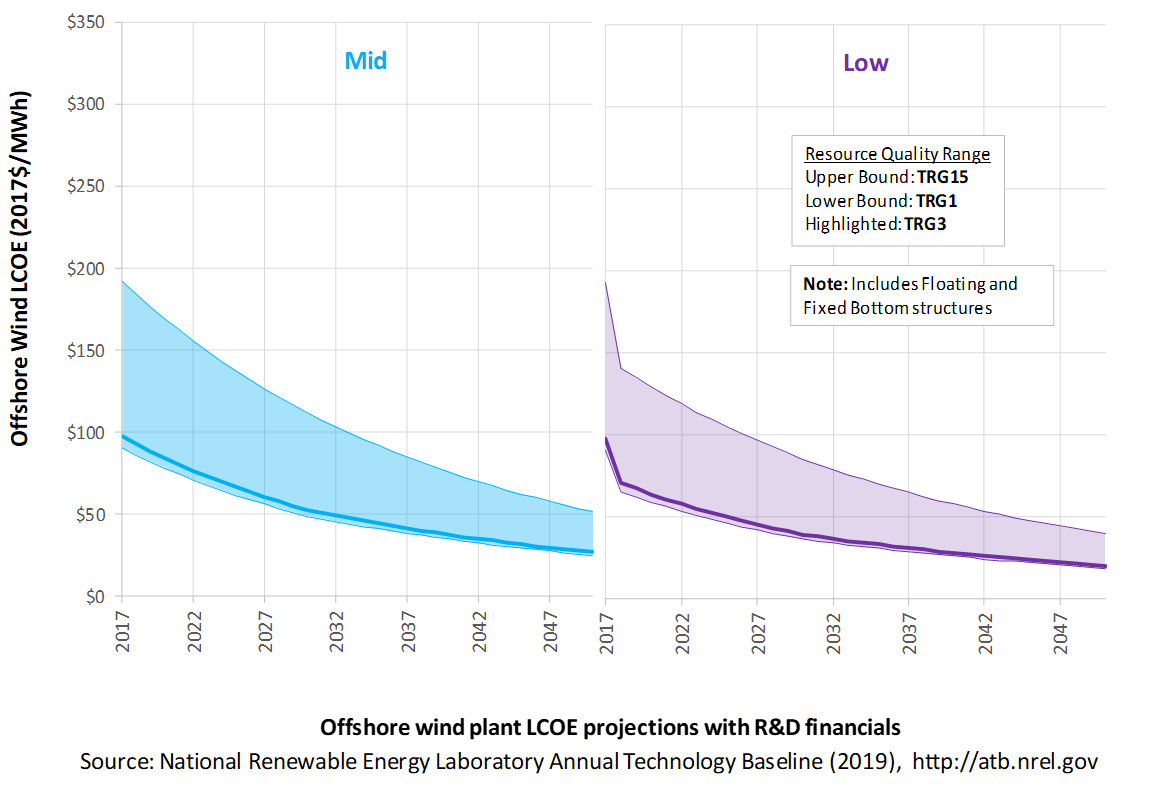
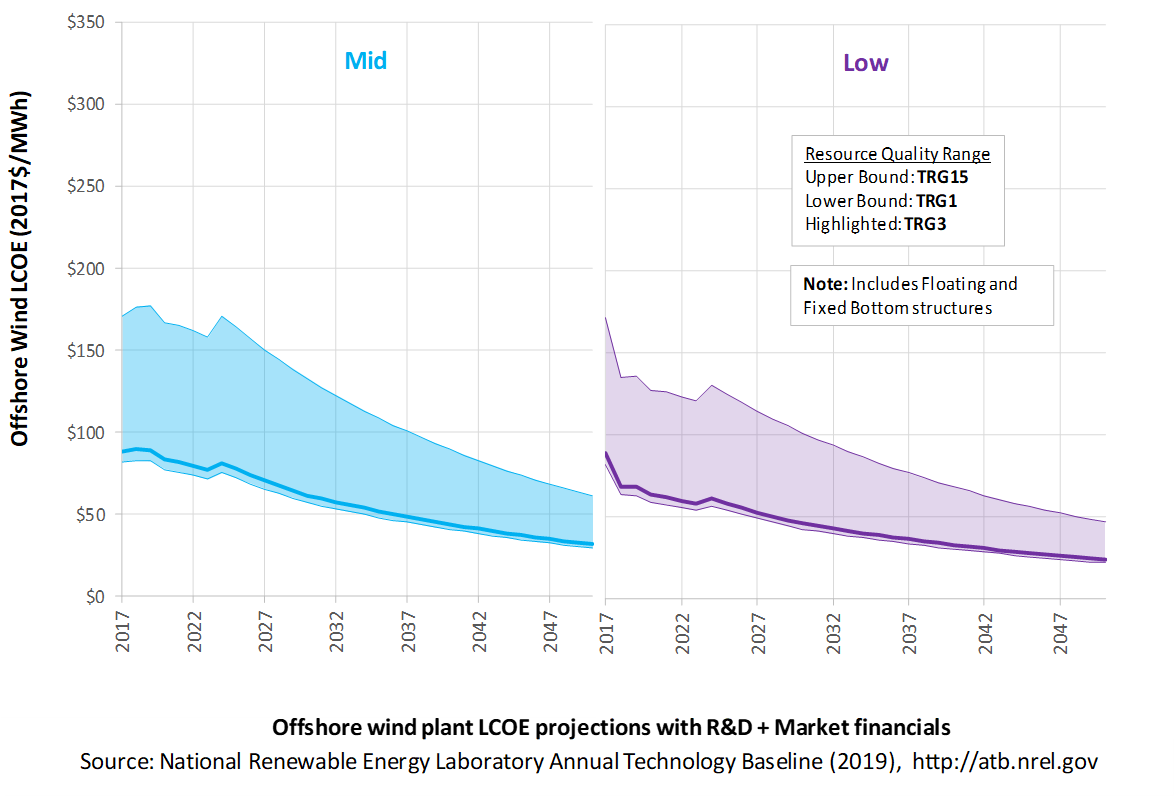
The following three figures illustrate LCOE, which includes the combined impact of CAPEX, O&M, and capacity factor projections for offshore wind across the range of resources present in the contiguous United States. The R&D Only LCOE sensitivity cases present the range of LCOE based on financial conditions that are held constant over time unless R&D affects them, and they reflect different levels of technology risk. This case excludes effects of tax reform, tax credits, and changing interest rates over time. The R&D + Market LCOE case adds to these financial assumptions: (1) the changes over time consistent with projections in the Annual Energy Outlook and (2) the effects of tax reform and tax credits. The ATB representative plant characteristics that best align with those of recently installed or anticipated near-term offshore wind plants are associated with TRG 3. Data for all the resource categories can be found in the ATB Data spreadsheet; for simplicity, not all resource categories are shown in the figures.
R&D Only | R&D + Market
The methodology for representing the CAPEX, O&M, and capacity factor assumptions behind each pathway is discussed in Projections Methodology. In general, the degree of adoption of technology innovation distinguishes the Constant, Mid, and Low technology cost scenarios. These projections represent trends that reduce CAPEX and improve performance. Development of these scenarios involves technology-specific application of the following general definitions:
- Constant Technology: Base Year (or near-term estimates of projects under construction) equivalent through 2050 maintains current relative technology cost differences
- Mid Technology Cost Scenario: Technology advances through continued industry growth, public and private R&D investments, and market conditions relative to current levels that may be characterized as "likely" or "not surprising"
- Low Technology Cost Scenario: Technology advances that may occur with breakthroughs, increased public and private R&D investments, and/or other market conditions that lead to cost and performance levels that may be characterized as the " limit of surprise" but not necessarily the absolute low bound.
To estimate LCOE, assumptions about the cost of capital to finance electricity generation projects are required, and the LCOE calculations are sensitive to these financial assumptions. Two project finance structures are used within the ATB:
- R&D Only Financial Assumptions: This sensitivity case allows technology-specific changes to debt interest rates, return on equity rates, and debt fraction to reflect effects of R&D on technological risk perception, but it holds background rates constant at 2017 values from AEO2019 (EIA 2019) and excludes effects of tax reform and tax credits.
- R&D Only + Market Financial Assumptions: This sensitivity case retains the technology-specific changes to debt interest, return on equity rates, and debt fraction from the R&D Only case and adds in the variation over time consistent with AEO2019 (EIA 2019) as well as effects of tax reform and tax credits. For a detailed discussion of these assumptions, see Project Finance Impact on LCOE.
A constant cost recovery period-over which the initial capital investment is recovered-of 30 years is assumed for all technologies throughout this website, and can be varied in the ATB data spreadsheet.
The equations and variables used to estimate LCOE are defined on the Equations and Variables page. For illustration of the impact of changing financial structures such as WACC, see Project Finance Impact on LCOE. For LCOE estimates for the Constant, Mid, and Low technology cost scenarios for all technologies, see 2019 ATB Cost and Performance Summary.
In general, differences among the technology cost cases reflect different levels of adoption of innovations. Reductions in technology costs reflect the cost reduction opportunities that are listed below:
- The financing conditions assumed for the ATB are applicable to commercial-scale offshore wind projects only. Commercial-scale fixed-bottom offshore wind projects are expected to be installed starting in the early 2020s (Walter Musial et al. forthcoming). Offshore wind projects using floating technology are in a pre-commercial phase currently (i.e., multi-turbine arrays between 12-50 MW in size) for which the ATB financial assumptions are likely too favorable. Once floating technology is deployed at commercial scale, the ATB financial assumptions are expected to appropriately reflect the terms of financing. The use of floating technology for commercial-scale projects is expected by the mid-2020s. Continued turbine scaling to larger-megawatt turbines with larger rotors such that swept area/megawatt capacity decreases resulting in higher capacity factors for a given location
- Greater market competition in the production of primary components (e.g., turbines, support structure), and installation services
- Economy-of-scale and productivity improvements in manufacturing, including mass production of substructure component and optimized installation strategies
- Improved plant siting and operation to reduce plant-level energy losses, resulting in higher capacity factors
- More efficient O&M procedures combined with more reliable components to reduce annual average FOM costs
- Adoption of a wide range of innovative control, design, and material concepts that facilitate the high-level trends described above.
References
The following references are specific to this page; for all references in this ATB, see References.Beiter, P., Musial, W., Smith, A., Kilcher, L., Damiani, R., Maness, M., … Scott, G. (2016). A Spatial-Economic Cost-Reduction Pathway Analysis for U.S. Offshore Wind Energy Development from 2015-2030 (Technical Report No. NREL/TP-6A20-66579). https://doi.org/10.2172/1324526
DOE, & NREL. (2015). Wind Vision: A New Era for Wind Power in the United States (Technical Report No. DOE/GO-102015-4557). Retrieved from U.S. Department of Energy website: https://www.nrel.gov/docs/fy15osti/63197-2.pdf
EIA. (2013). Updated Capital Cost Estimates for Utility Scale Electricity Generating Plants. Retrieved from U.S. Energy Information Administration website: https://www.eia.gov/analysis/studies/powerplants/capitalcost/archive/2013/pdf/updated_capcost.pdf
EIA. (2019a). Annual Energy Outlook 2019 with Projections to 2050. Retrieved from U.S. Energy Information Administration website: https://www.eia.gov/outlooks/aeo/pdf/AEO2019.pdf
Hundleby, G., Freeman, K., Logan, A., & Frost, C. (2017). Floating Offshore: 55 Technology Innovations that will have greater impact on reducing the cost of electricity from European floating offshore wind farms. Retrieved from KiC InnoEnergy and BVG Associates website.
Moné, C., Smith, A., Maples, B., & Hand, M. (2015). 2013 Cost of Wind Energy Review (No. NREL/TP-5000-63267). https://doi.org/10.2172/1172936
Musial, Walt, Heimiller, D., Beiter, P., Scott, G., & Draxl, C. (2016). 2016 Offshore Wind Energy Resource Assessment for the United States (No. NREL/TP-5000-66599). https://doi.org/10.2172/1324533
Musial, Walter, Beiter, P., Spitsen, P., & Nunemaker, J. (2018). 2018 Offshore Wind Technologies Market Report. https://www.energy.gov/sites/prod/files/2019/08/f65/2018%20Offshore%20Wind%20Market%20Report.pdf
Valpy, B., Hundleby, G., Freeman, K., Roberts, A., & Logan, A. (2017). Future renewable energy costs: Offshore wind. Retrieved from KiC InnoEnergy and BVG Associates website: http://www.innoenergy.com/wp-content/uploads/2014/09/InnoEnergy-Offshore-Wind-anticipated-innovations-impact-2017_A4.pdf