
Residential PV Systems
Capital Expenditures (CAPEX): Historical Trends, Current Estimates, and Future Projections
Capital expenditures (CAPEX) are expenditures required to achieve commercial operation in a given year. These expenditures include the hardware, the balance of system (e.g., site preparation, installation, and electrical infrastructure), and financial costs (e.g., development costs, onsite electrical equipment, and interest during construction) and are detailed in CAPEX Definition. In the ATB, CAPEX reflects typical plants and does not include differences in regional costs associated with labor, materials, taxes, or system requirements. The related Standard Scenarios product uses Regional CAPEX Adjustments. The range of CAPEX demonstrates variation with resource in the contiguous United States.
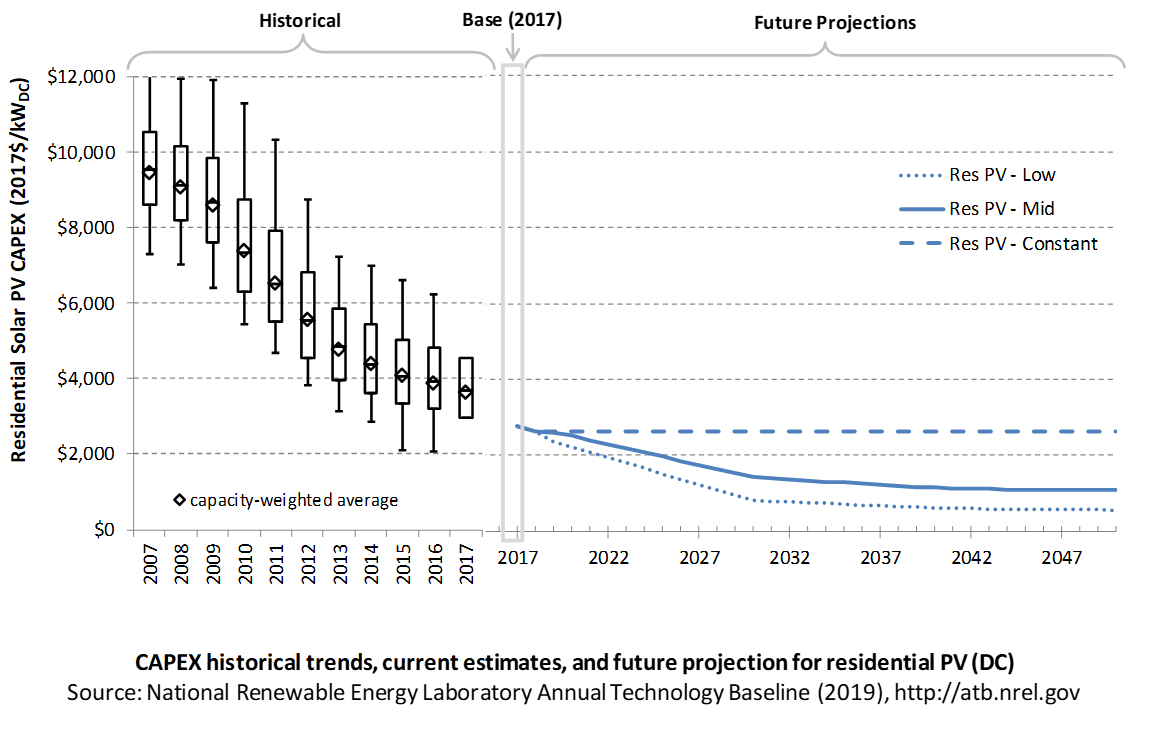
The following figure shows the Base Year estimate and future year projections for CAPEX costs. Three cost scenarios are represented: Constant, Mid, and Low technology cost. Historical data from residential PV installed in the United States are shown for comparison to the ATB Base Year estimates. The estimate for a given year represents CAPEX of a new plant that reaches commercial operation in that year.
Recent Trends
Reported residential PV installation CAPEX (Barbose and Dargouth 2018) is shown in box-and-whiskers format for comparison to historical residential PV benchmark overnight capital cost (Fu, Feldman, and Margolis 2018) and the ATB estimates of future CAPEX projections. The data in Barbose and Dargouth (2018) represent 81% of all U.S. residential and commercial PV capacity installed through 2016 and 75% of capacity installed in 2017.
The difference in each year's price between the market and benchmark data reflects differences in methodologies. There are a variety of reasons reported and benchmark prices can differ, as enumerated by Barbose and Dargouth (2018) and Bolinger and Seel (2018), including:
- Timing-related issues: For instance, the time between contract completion date and project placed in service may vary.
- Variations over time in the size, technology, installer margin, and design of systems installed in a given year
- Which cost categories are included in CAPEX (e.g., financing costs and initial O&M expenses).
Due to the investment tax credit, projects are encouraged to include as many costs incurred in the upfront CAPEX to receive a higher tax credit, which may have otherwise been reported as operating costs. The bottom-up benchmarks are more reflective of an overnight capital cost, which is in line with the ATB methodology of inputting overnight capital cost and calculating construction financing to derive CAPEX.
PV pricing and capacities are quoted in kWDC (i.e., module rated capacity) unlike other generation technologies, which are quoted in kWAC. For PV, this would correspond to the combined rated capacity of all inverters. This is done because kWDC is the unit that the majority of the PV industry uses. Although costs are reported in kWDC, the total CAPEX includes the cost of the inverter, which has a capacity measured in kWAC.
CAPEX estimates for 2018 reflect a continued rapid decline in pricing supported by analysis of recent system cost and pricing for projects that became operational in 2018 (Feldman and Margolis 2018).
Base Year Estimates
For illustration in the ATB, a representative residential-scale PV installation is shown. Although the PV technologies vary, typical installation costs are represented with a single estimate because the CAPEX does not vary with solar resource.
Although the technology market share may shift over time with new developments, the typical installation cost is represented with the projections above.
A system price of $2.77/WDC in 2017 and $2.64/WDC in 2018 are based on bottom-up benchmark analysis reported in U.S. Solar Photovoltaic System Cost Benchmark Q1 2018 (adjusted for inflation) (Fu, Feldman, and Margolis 2018). These figures are in line with other estimated system prices reported in Q2/Q3 2018 Solar Industry Update (Feldman and Margolis 2018).
The Base Year CAPEX estimates should tend toward the low end of observed cost because no regional impacts are included. These effects are represented in the historical market data.
Future Year Projections
Projections of future residential PV installation CAPEX are based on seven system price projections from six separate institutions made in the last two years. We adjusted the "min," "median," and "max" projections in a few different ways. All 2017 and 2018 pricing are based on the bottom-up benchmark analysis reported in U.S. Solar Photovoltaic System Cost Benchmark Q1 2018 (adjusted for inflation) (Fu, Feldman, and Margolis 2018). These figures are in line with other estimated system prices reported in Q2/Q3 2018 Solar Industry Update (Feldman and Margolis 2018).
We adjusted the Mid and Low cost projections for 2019-2050 to remove distortions caused by the combination of forecasts with different time horizons and based on internal judgment of price trends. The Constant technology cost scenario is kept constant at the 2018 CAPEX value, assuming no improvements beyond 2018.
A detailed description of the methodology for developing future year projections is found in Projections Methodology.
Technology innovations that could impact future O&M costs are summarized in LCOE Projections.
References
The following references are specific to this page; for all references in this ATB, see References.Barbose, G., & Darghouth, N. (2018). Tracking the Sun XI: The Installed Price of Residential and Non-Residential Photovoltaic Systems in the United States (No. LBNL-2001062). https://doi.org/10.2172/1477384
Bolinger, M., & Seel, J. (2018). Utility-Scale Solar: An Empirical Trends in Project Technology, Cost, Performance, and PPA Pricing in the United States (2018 Edition). Retrieved from Lawrence Berkeley National Laboratory website: https://emp.lbl.gov/sites/default/files/lbnl_utility_scale_solar_2018_edition_report.pdf
Feldman, D., & Margolis, R. (2018, November). Q2/Q3 2018 Solar Industry Update. Retrieved from https://www.nrel.gov/docs/fy19osti/72810.pdf
Fu, R., Feldman, D., & Margolis, R. (2018). U.S. Solar Photovoltaic System Cost Benchmark: Q1 2018. https://doi.org/10.2172/1484344