
Utility-Scale PV
Capital Expenditures (CAPEX): Historical Trends, Current Estimates, and Future Projections
Capital expenditures (CAPEX) are expenditures required to achieve commercial operation in a given year. These expenditures include the hardware, the balance of system (e.g., site preparation, installation, and electrical infrastructure), and financial costs (e.g., development costs, onsite electrical equipment, and interest during construction) and are detailed in CAPEX Definition. In the ATB, CAPEX reflects typical plants and does not include differences in regional costs associated with labor, materials, taxes, or system requirements. The related Standard Scenarios product uses Regional CAPEX Adjustments. The range of CAPEX demonstrates variation with resource in the contiguous United States.
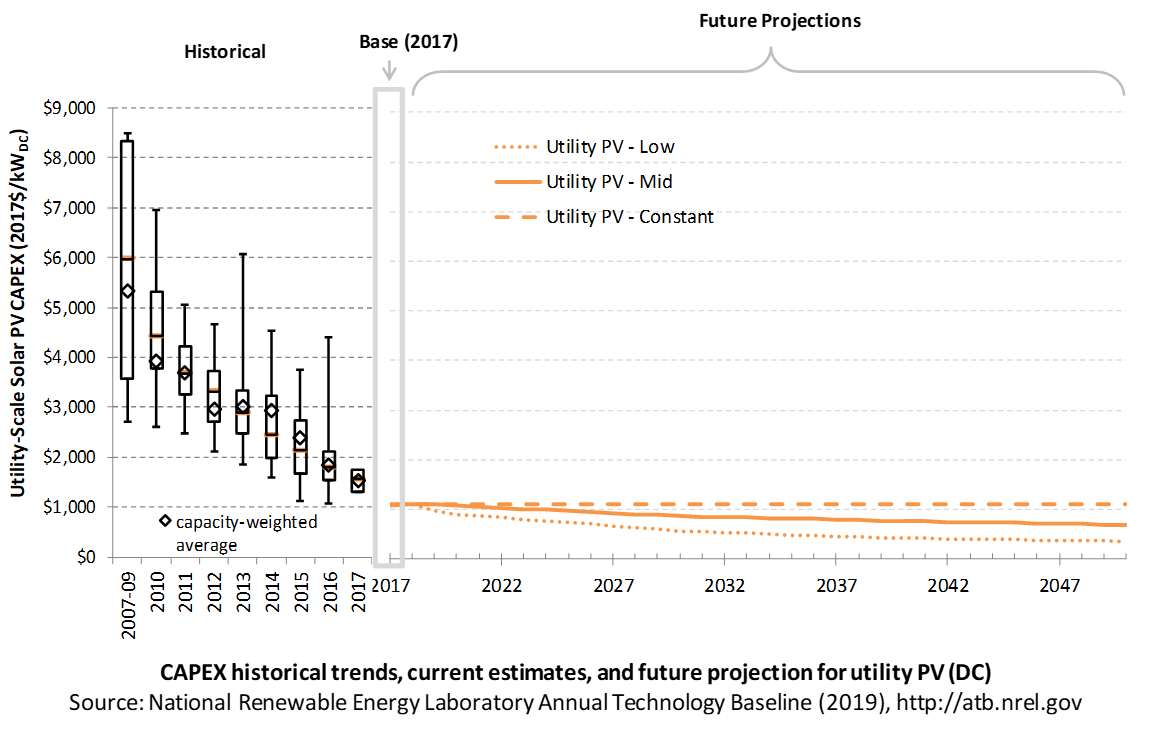
The following figures show the Base Year estimate and future year projections for CAPEX costs in terms of $/kWDC or $/kWAC. Three cost scenarios are represented: Constant, Mid, and Low technology cost. Historical data from utility-scale PV plants installed in the United States are shown for comparison to the ATB Base Year estimates. The estimate for a given year represents CAPEX of a new plant that reaches commercial operation in that year.
The PV industry typically refers to PV CAPEX in terms of $/kWDC based on the aggregated module capacity. The electric utility industry typically refers to PV CAPEX in terms of $/kWAC based on the aggregated inverter capacity. See Solar PV AC-DC Translation for details. The figures illustrate the CAPEX historical trends, current estimates, and future projections in terms of $/kWDC or $/kWAC; current estimates and future projections assume an inverter loading ratio of 1.3 while historical numbers represent reported values.
Recent Trends
Reported historical utility-scale PV plant CAPEX (Bolinger and Seel 2018) is shown in box-and-whiskers format for comparison to the historical benchmarked utility-scale PV plant overnight capital cost (Fu, Feldman, and Margolis 2018) and future CAPEX projections. Bolinger and Seel (2018) provide statistical representation of CAPEX for 88% of all utility-scale PV capacity.
The difference in each year's price between the market and benchmark data reflects differences in methodologies. There are a variety of reasons reported and benchmark prices can differ, as enumerated by Barbose and Dargouth (2018) and Bolinger and Seel (2018) , including:
- Timing-related issues: For instance, the time between PPA contract completion date and project placed in service may vary, and a system can be reported as installed in separate sections over time or when an entire complex is complete. For example, in 2014, the reported capacity-weighted average system price was higher than 80% of system prices in 2014 due to very large systems, with multiyear construction schedules, installed in that year. Developers of these large systems negotiated contracts and installed portions of their systems when module and other costs were higher.
- Variations over time in the size, technology, installer margin, and design of systems installed in a given year
- Which cost categories are included in CAPEX (e.g., financing costs and initial O&M expenses).
Due to the investment tax credit, projects are encouraged to include as many costs incurred in the upfront CAPEX to receive a higher tax credit, which may have otherwise been reported as operating costs. The bottom-up benchmarks are more reflective of an overnight capital cost, which is in line with the ATB methodology of inputting overnight capital cost and calculating construction financing to derive CAPEX.
PV pricing and capacities are quoted in kWDC (i.e., module rated capacity) unlike other generation technologies, which are quoted in kWAC. For PV, this would correspond to the combined rated capacity of all inverters. This is done because kWDC is the unit that most of the PV industry uses. Although costs are reported in kWDC, the total CAPEX includes the cost of the inverter, which has a capacity measured in kWAC.
CAPEX estimates for 2019 reflect continued rapid decline supported by analysis of recent power purchase agreement pricing (Bolinger and Seel 2018) for projects that will become operational in 2019 and beyond.
Base Year Estimates
For illustration in the ATB, a representative utility-scale PV plant is shown. Although the PV technologies vary, typical plant costs are represented with a single estimate because the CAPEX does not vary with solar resource.
Although the technology market share may shift over time with new developments, the typical plant cost is represented with the projections above.
A system price of $1.10/WDC in 2017 is based on modeled pricing for a 100-MWDC, one-axis tracking systems quoted in Q1 2018 as reported by Fu, Feldman, and Margolis (2018) , adjusted for inflation. The $1.10/WDC price in 2018 is based on modeled pricing for a 100-MWDC, one-axis tracking systems quoted in Q1 2018 as reported by Fu, Feldman, and Margolis (2018) , adjusted for inflation. The 2017 and 2018 bottom-up benchmarks are reflective of an overnight capital cost, which is in line with the ATB methodology of inputting overnight capital cost and calculating construction financing to derive CAPEX. We focus on larger systems for the 2017 and 2018 values to better align with the current trends in utility-scale installations. EIA (2019) reported that 94 PV installations totaling 4.3 GWAC were placed in service in 2018 in the United States. While this represents an average of approximately 46 MWAC, 78% of the installed capacity in 2018 came from systems greater than 50 MWAC, and 38% from systems greater than 100 MWAC. Regardless, both 2017 and 2018 figures are in line with other estimated system prices reported by Feldman and Margolis (2018) .
Future Year Projections
Projections of future utility-scale PV plant CAPEX are based on 11 system price projections from 9 separate institutions. Projections include:
- Short-term projections made in the past two years: (Avista 2017), (BNEF 2018), (E3 2017), (GTM Research 2018), and (IEA 2018)
- Long-term projections made in the last three years: (ABB 2017), (BNEF 2017), (EIA 2019b), (EIA 2018), (IEA 2018c), (IRENA 2016), and (Lam, Branstetter, and Azevedo 2018) .
We adjusted the "min," "median," and "max" projections in a few
different ways. All 2017 and 2018 pricing are based on the bottom-up
benchmark analysis reported in U.S. Solar Photovoltaic System
Cost Benchmark Q1 2018
We adjusted the Mid and Low projections for 2019-2050 to remove distortions caused by the combination of forecasts with different time horizons and based on internal judgment of price trends. Without such adjustments, the Mid and Low projections would have increased over time in certain years, or they would have decreased dramatically due to the end of a projection's timeline. The Constant cost scenario is kept constant at the 2018 CAPEX value and assumes no improvements beyond 2018.
The largest annual reductions in CAPEX for the Low projection occur from 2018 to 2019, dropping 14%, which is on par with the average reduction in reported price of 14% between 2010 and 2017 (Bolinger and Seel 2018) . Initial reported pricing for utility-scale power purchase agreements (PPAs) placed in service in 2018 fell to approximately $42/MWh (Real $2018), which is consistent in price with PPAs executed in 2015 and 2016, representing a two- to three-year lag from execution to installation. Looking forward, the capacity average executed PPA price for a provisional set of U.S. projects in 2018 was approximately $23/MWh (Real $2018). If PPAs executed in 2018 follow a similar two-year lag, we would expect those systems to be installed in 2020-2021; therefore, we could see the capacity-weighted average PPA price for systems installed in the year fall from $42/MWh in 2018 to $23/MWh in 2020, or 46% less. The capacity average executed PPA price in 2017 was 15% lower than the capacity-weighted average PPA price for a system installed in 2017. PPA pricing and CAPEX are not perfectly correlated-annual reductions of PPA and CAPEX only have a correlation coefficient of 0.17 from 2010 to 2017; however, the correlation coefficient for reduction over a four-year period in PPA and CAPEX during that time (i.e., PPA or CAPEX reduction from 2010 to 2014, 2011 to 2015, 2012 to 2016, and 2013 to 2017) was 0.95 – from 2010 to 2017, the capacity-weighted average PPA price and CAPEX for systems installed in that year fell 69% and 61% respectively (Bolinger and Seel 2018) .
Looking to 2030 and beyond, various technical, market, and business improvements could significantly reduce PV system costs further, in line with the low and mid CAPEX projections. Many manufacturers have near-term road maps that will greatly exceed the 18.1% module efficiency assumed in the 2018 utility-scale overnight capital cost benchmark; for example, Canadian Solar reported that its mass produced cells will increase 20%-22% in 2018 (depending on cell line) to 22%-24% by 2021 (Canadian Solar 2019) . However, greater efficiencies can still be achieved if the industry can translate gains in the laboratory to mass production, as the current monocrystalline cell efficiency record in a laboratory is 26.1% (EIA 2016a) and (NREL: "Best Research-Cell Efficiency Chart"). Additionally, the industry also has the potential to significantly increase cell efficiencies by using double junction cell technology; for example, perovskite on top of c-Si has a theoretical maximum efficiency of 44% (Fuscher and Bruno 2016) .
Other factors are also expected to significantly decrease PV system
prices. For example, at the end of 2018, the global module price was
approximately $0.22/W
(Feldman and Margolis 2018)
compared to the 2018 utility-scale CAPEX benchmark, which assumes a
module price of $0.47/W
A detailed description of the methodology for developing future year projections is found in Projections Methodology.
Technology innovations that could impact future CAPEX costs are summarized in LCOE Projections.
References
The following references are specific to this page; for all references in this ATB, see References.ABB. (2017). Spring 2017 Power Reference Case: Preview of key changes and potential impacts. ABB Enterprise Software.
Avista. (2017). 2017 Electric Integrated Resource Plan. Retrieved from https://www.myavista.com/-/media/myavista/content-documents/about-us/our-company/irp-documents/2017-electric-irp-final.pdf?la=en
Barbose, G., & Darghouth, N. (2018). Tracking the Sun XI: The Installed Price of Residential and Non-Residential Photovoltaic Systems in the United States (No. LBNL-2001062). https://doi.org/10.2172/1477384
BNEF. (2017b). H2 2017 U.S. PV Market Outlook. New York, NY: BNEF (Bloomberg New Energy Finance).
BNEF. (2018a). 2H 2018 US PV Market Outlook. Bloomberg New Energy Finance (BNEF).
Bolinger, M., & Seel, J. (2018). Utility-Scale Solar: An Empirical Trends in Project Technology, Cost, Performance, and PPA Pricing in the United States (2018 Edition). Retrieved from Lawrence Berkeley National Laboratory website: https://emp.lbl.gov/sites/default/files/lbnl_utility_scale_solar_2018_edition_report.pdf
Canadian Solar. (2019a, March). Investor Presentation: Fourth Quarter 2018 Update. Retrieved from https://investors.canadiansolar.com/static-files/070dc90f-472d-43af-9180-302db9ce8744
E3. (2017). RESOLVE Documentation: CPUC 2017 IRP: Inputs & Assumptions. Retrieved from http://www.cpuc.ca.gov/uploadedFiles/CPUCWebsite/Content/UtilitiesIndustries/Energy/EnergyPrograms/ElectPowerProcurementGeneration/LTPP/2017/RESOLVE_CPUC_IRP_Inputs_Assumptions_2017-05-15.pdf
EIA (last). (2019). Preliminary Monthly Electric Generator Inventory (Based on Form EIA-860M as a Supplement to Form EIA-860). Retrieved from U.S. Energy Information Administration (EIA) website: https://www.eia.gov/electricity/data/eia860m/
EIA. (2016a). Annual Energy Outlook 2016 Early Release: Annotated Summary of Two Cases (No. AEO2016). Retrieved from U.S. Energy Information Administration website: https://www.eia.gov/outlooks/aeo/er/pdf/0383er(2016).pdf
EIA. (2018). Annual Energy Outlook 2018 with Projections to 2050 (No. AEO2018). Retrieved from U.S. Energy Information Administration website: https://www.eia.gov/outlooks/archive/aeo18/
EIA. (2019a). Annual Energy Outlook 2019 with Projections to 2050. Retrieved from U.S. Energy Information Administration website: https://www.eia.gov/outlooks/aeo/pdf/AEO2019.pdf
Feldman, D., & Margolis, R. (2018, November). Q2/Q3 2018 Solar Industry Update. Retrieved from https://www.nrel.gov/docs/fy19osti/72810.pdf
Fu, R., Feldman, D., & Margolis, R. (2018). U.S. Solar Photovoltaic System Cost Benchmark: Q1 2018. https://doi.org/10.2172/1484344
Fuscher, M., & Bruno, E. (2016). Efficiency Limit of Perovskite/Si Tandem Solar Cells. ACS Energy Lett., 1(4), 863–868. Retrieved from http://dx.doi.org/10.1021/acsenergylett.6b00405
GTM Research. (2018). U.S. PV System Pricing H2 2018: System Pricing, Breakdowns and Forecasts. Boston, MA: GTM Research.
IEA. (2018b). Renewables 2018: Analysis and Forecasts to 2O23. Retrieved from International Energy Agency website: https://www.iea.org/renewables2018/
IEA. (2018c). World Energy Outlook 2018. Paris, France: International Energy Agency.
IRENA. (2016b). The Power to Change: Solar and Wind Cost Reduction Potential to 2025. Retrieved from International Renewable Energy Agency website: https://www.irena.org/DocumentDownloads/Publications/IRENA_Power_to_Change_2016.pdf
Lam, L. T., Branstetter, L., & Azevedo, I. L. (2018). A Sunny Future: Expert Elicitation of China's Solar Photovoltaic Technologies. Environmental Research Letters: IOP Publishing Ltd, 13(3). Retrieved from https://iopscience.iop.org/article/10.1088/1748-9326/aaab70/meta