
Utility-Scale PV
Plant Cost and Performance Projections Methodology
Currently, CAPEX – not LCOE – is the most common metric for PV cost. Due to differing assumptions in long-term incentives, system location and production characteristics, and cost of capital, LCOE can be confusing and often incomparable between differing estimates. While CAPEX also has many assumptions and interpretations, it involves fewer variables to manage. Therefore, PV projections in the ATB are driven primarily by CAPEX cost improvements, along with minor improvements in operational cost and cost of capital.
The Constant, Mid, and Low technology cost cases explore the range of possible outcomes of future PV cost improvements:
- Constant Technology Cost Scenario: no improvements made beyond today
- Mid Technology Cost Scenario: current expectations of price reductions in a "business-as-usual" scenario
- Low Technology Cost Scenario: expectations of potential cost reductions given improved R&D funding, favorable financing, and more aggressive global deployment targets.
While CAPEX is one of the drivers to lower costs, R&D efforts continue to focus on other areas to lower the cost of energy from utility-scale PV, such as longer system lifetime and improved performance.
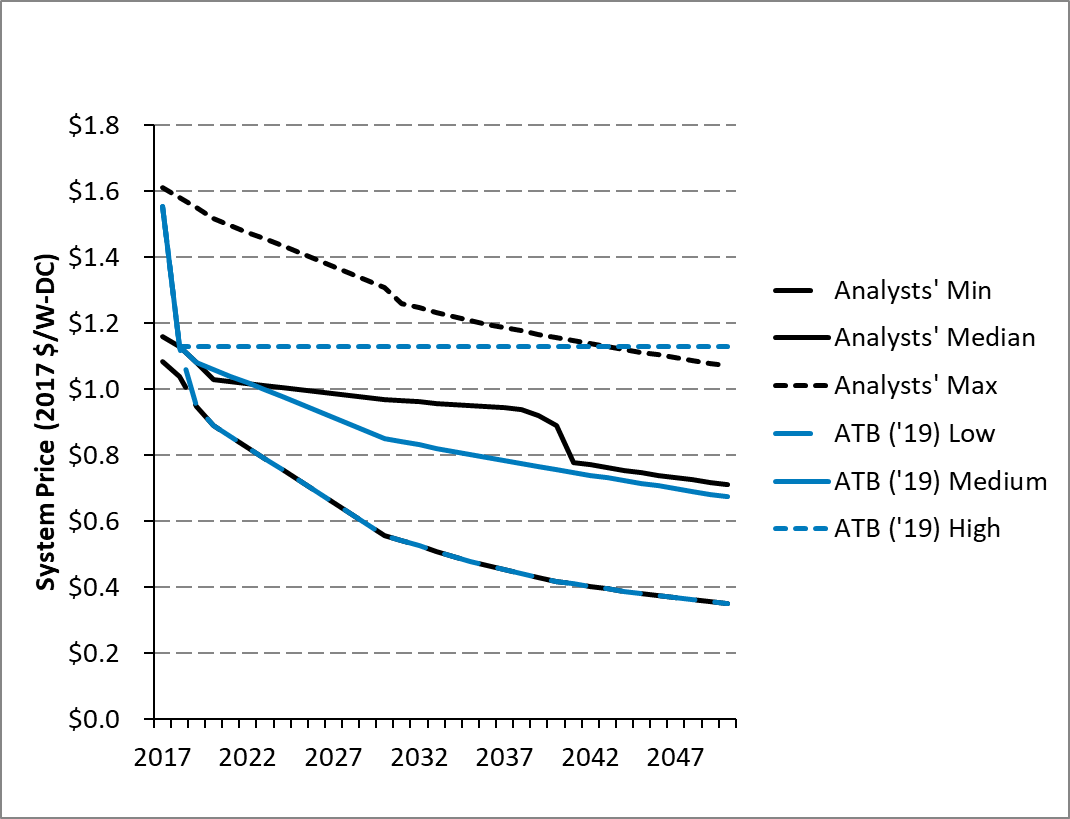
Projections of future utility-scale PV plant CAPEX are based on 11 system price projections from 9 separate institutions. The short-term forecasts were primarily provided by market analysis firms with expertise in the PV industry, through a subscription service with NREL. The long-term forecasts primarily represent the collection of publicly available, unique forecasts with either a long-term perspective of solar trends or through capacity expansion models with assumed learning by doing. Short-term U.S. price forecasts made in the past two years include: (Avista 2017), (BNEF 2018), (E3 2017), (GTM Research 2018), and (IEA 2018b). Long-term projections made in the past three years include (ABB 2017), (BNEF 2017), (EIA 2019b), (IEA 2018a), (IRENA 2016), and (Lam, Branstetter, and Azevedo 2018).
- Short-Term Forecast Institutions: Avista, Bloomberg New Energy Finance, CAISO, GTM Research, International Energy Agency
- Long-Term Forecast Institutions: ABB; Bloomberg New Energy Finance; International Energy Agency; IRENA; Lam, Branstetter, and Azevedo (2018); U.S. Energy Information Administration.
To adjust all projections to the ATB's assumption of single-axis tracking systems, 7% was added to all price projections that assumed fixed-tilt tracking technology, and 3.5% was added for all price projections that did not list whether the technology was fixed-tilt or single-axis tracking. All price projections quoted in $/WAC were converted to $/WDC using a 1.3 ILR. In instances in which literature projections did not include all years, a straight-line change in price was assumed between any two projected values. To generate Mid and Low technology cost scenarios, we took the "median" and "min" of the data sets; however, we only included short-term U.S. forecasts until 2030 as they focus on near-term pricing trends within the industry. Starting in 2030, we include long-term global and U.S. forecasts in the data set, as they focus more on long-term trends within the industry. It is also assumed that after 2025, U.S. prices will be on par with global averages; the federal tax credit for solar assets reverts down to 10% for all projects placed in service after 2023, which has the potential to lower upfront financing costs and remove any distortions in reported pricing, compared to other global markets. Additionally, a larger portion of the United States will have a more mature PV market, which should result in a narrower price range. Changes in price for the Mid and Low technology cost scenarios between 2020 and 2030 are interpolated on a straight-line basis.
We adjusted the "median" and "min" projections in a few different ways. All 2017 and 2018 pricing are based on the bottom-up benchmark analysis reported in U.S. Solar Photovoltaic System Cost Benchmark Q1 2018 (adjusted for inflation)(Fu, Feldman, and Margolis 2018). These figures are in line with other estimated system prices reported in Q2/Q3 2018 Solar Industry Update (Feldman and Margolis 2018).
We adjusted the Mid and Low projections for 2019-2050 to remove distortions caused by the combination of forecasts with different time horizons and based on internal judgment of price trends. The Constant technology cost scenario is kept constant at the 2018 CAPEX value, assuming no improvements beyond 2018.

We derive future FOM based on the historical average ratio of O&M costs ($/kW-yr) to CAPEX costs ($/kW), 1.2:100, as reported by Fu, Feldman, and Margolis (Fu, Feldman, and Margolis 2018). Historically reported data suggest O&M and CAPEX cost reductions are correlated; from 2011 to 2017 fleetwide average O&M and CAPEX costs fell 50% and 58% respectively, as reported by Bolinger and Seel (2018).
O&M cost reductions are likely to be achieved over the next decade by a transition from manual and reactive O&M to semi-automated and fully automated O&M where possible. While many of these tasks are very site and region specific, emerging technologies have the potential to reduce the total O&M costs across all systems. For example, automated processes of sensors, monitors, remote-controlled resets, and drones to perform operations have the potential to allow O&M on PV systems to operate more efficiently at lower cost. Not all tasks have a clear path of automation due to complexity, safety, and some policy. This is one reason some level of manual interventions will likely exist for quite some time. Also, as systems age, O&M tasks that rely strictly on manpower are likely to increase in cost over the system lifetime.
Projections of capacity factors for plants installed in future years are unchanged from 2018 for the Constant cost scenario. Capacity factors for Mid and Low cost scenarios are projected to increase over time, caused by a straight-line reduction in PV plant capacity degradation rates, reaching 0.5%/year and 0.2%/year by 2050 for the Mid and Low cost scenarios respectively.
References
The following references are specific to this page; for all references in this ATB, see References.ABB. (2017). Spring 2017 Power Reference Case: Preview of key changes and potential impacts. ABB Enterprise Software.
Avista. (2017). 2017 Electric Integrated Resource Plan. Retrieved from https://www.myavista.com/-/media/myavista/content-documents/about-us/our-company/irp-documents/2017-electric-irp-final.pdf?la=en
BNEF. (2017b). H2 2017 U.S. PV Market Outlook. New York, NY: BNEF (Bloomberg New Energy Finance).
BNEF. (2018a). 2H 2018 US PV Market Outlook. Bloomberg New Energy Finance (BNEF).
Bolinger, M., & Seel, J. (2018). Utility-Scale Solar: An Empirical Trends in Project Technology, Cost, Performance, and PPA Pricing in the United States (2018 Edition). Retrieved from Lawrence Berkeley National Laboratory website: https://emp.lbl.gov/sites/default/files/lbnl_utility_scale_solar_2018_edition_report.pdf
E3. (2017). RESOLVE Documentation: CPUC 2017 IRP: Inputs & Assumptions. Retrieved from http://www.cpuc.ca.gov/uploadedFiles/CPUCWebsite/Content/UtilitiesIndustries/Energy/EnergyPrograms/ElectPowerProcurementGeneration/LTPP/2017/RESOLVE_CPUC_IRP_Inputs_Assumptions_2017-05-15.pdf
EIA. (2019a). Annual Energy Outlook 2019 with Projections to 2050. Retrieved from U.S. Energy Information Administration website: https://www.eia.gov/outlooks/aeo/pdf/AEO2019.pdf
Feldman, D., & Margolis, R. (2018, November). Q2/Q3 2018 Solar Industry Update. Retrieved from https://www.nrel.gov/docs/fy19osti/72810.pdf
Fu, R., Feldman, D., & Margolis, R. (2018). U.S. Solar Photovoltaic System Cost Benchmark: Q1 2018. https://doi.org/10.2172/1484344
GTM Research. (2018). U.S. PV System Pricing H2 2018: System Pricing, Breakdowns and Forecasts. Boston, MA: GTM Research.
IEA. (2018a). Renewables 2018. Retrieved from IEA (International Energy Agency) website: https://www.iea.org/renewables2018/
IEA. (2018b). Renewables 2018: Analysis and Forecasts to 2O23. Retrieved from International Energy Agency website: https://www.iea.org/renewables2018/
IRENA. (2016b). The Power to Change: Solar and Wind Cost Reduction Potential to 2025. Retrieved from International Renewable Energy Agency website: https://www.irena.org/DocumentDownloads/Publications/IRENA_Power_to_Change_2016.pdf
Lam, L. T., Branstetter, L., & Azevedo, I. L. (2018). A Sunny Future: Expert Elicitation of China's Solar Photovoltaic Technologies. Environmental Research Letters: IOP Publishing Ltd, 13(3). Retrieved from https://iopscience.iop.org/article/10.1088/1748-9326/aaab70/meta