Annual Technology Baseline 2018
National Renewable Energy Laboratory
Recommended Citation:
NREL (National Renewable Energy Laboratory). 2018. 2018 Annual Technology Baseline. Golden, CO: National Renewable Energy Laboratory. http://atb.nrel.gov/.
Please consult Guidelines for Using ATB Data:
https://atb.nrel.gov/electricity/user-guidance.html
Concentrating Solar Power
Representative Technology
Concentrating solar power (CSP) technology is assumed to be molten-salt power towers. Thermal energy storage (TES) is accomplished by storing hot molten salt in a two-tank system, which includes a hot-salt tank and a cold-salt tank. Stored hot salt can be dispatched to the power block as needed, regardless of solar conditions, to continue power generation and allow for electricity generation after sunlight hours. In the ATB, CSP plants with 10 hours of TES are illustrated. Ten hours is the amount of storage at the Crescent Dunes CSP plant in Nevada, which is representative of most new molten-salt power tower projects.
Molten-salt power towers (with 10 hours of storage) were selected as the representative technology over the parabolic trough with synthetic oil-heat transfer fluid for two main reasons. First, most new global capacity of CSP plants in development or under construction are molten-salt power towers. From 2015, 3.7 GWe of molten-salt power towers were in development or under construction (IRENA 2018 and SolarReserve 2018), compared to 1.3 GWe of parabolic trough (IRENA 2018). Second, current indications are that molten-salt power towers have the greatest cost reduction potential, in terms of both CAPEX and LCOE, and they are part of the U.S. DOE Generation 3 (Gen3) roadmap for the next generation of commercial CSP plants (Mehos et al. (2017)).
The first large molten-salt power tower plant in the United States, Crescent Dunes (110 MWe with 10 hours of storage) was commissioned in 2015 with a reported installed CAPEX of $8.96/WAC (Danko (2015); Taylor (2016)). No new molten salt storage CSP plants were commissioned in the United States in 2017 or 2018. Molten-salt power tower plants are being bid and built in Australia, Chile, and Dubai (NREL n.d.). The United States currently has only one announced project; for the Sandstone project, it has been announced that up to 2 GWe consisting of up to 10 molten-salt power tower systems could be built, each with approximately 10 hours of storage (SolarReserve 2018).
Resource Potential
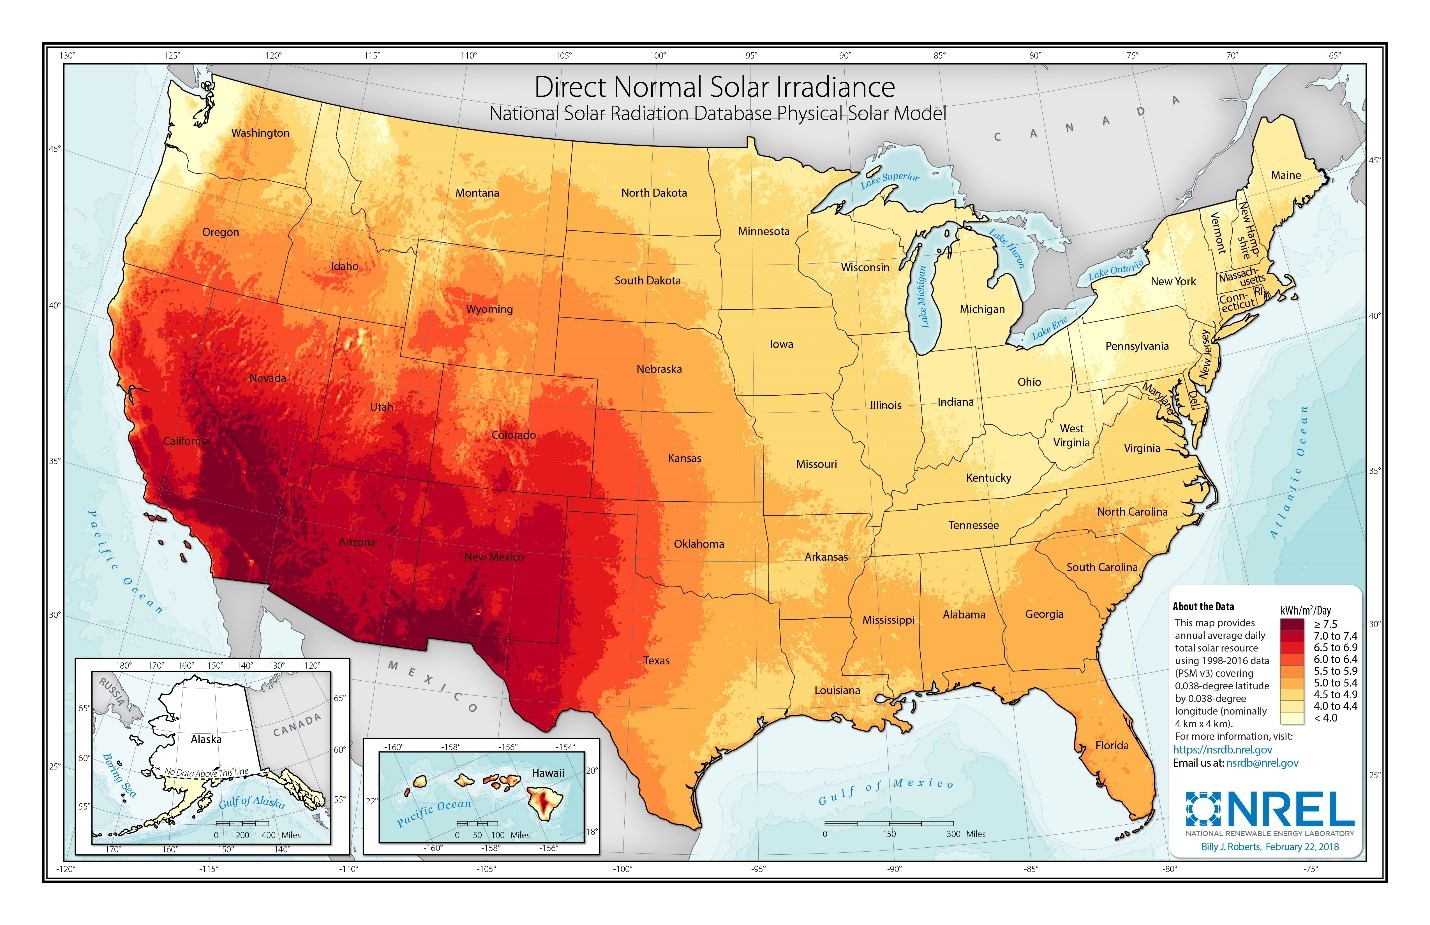
Solar resource is prevalent throughout the United States, but the Southwest is particularly suited to CSP plants. The direct normal irradiance (DNI) resource across the Southwest, which is some of the best in the world, ranges from 6.0 to over 7.5 kWh/m2/day (NREL 2018). The raw resource technical potential of seven western states (Arizona, California, Colorado, Nevada, New Mexico, Utah, and Texas) exceeds 11,000 GW-which is almost tenfold current total U.S. electricity generation capacity-considering regions in these states with an annual average resource > 6.0 kWh/m2/day and after accounting for exclusions such as land slope (> 1%), urban areas, water features, and parks, preserves, and wilderness areas (Mehos, Kabel, and Smithers (2009)).
Renewable energy technical potential, as defined by Lopez et al. 2012, represents the achievable energy generation of a particular technology given system performance, topographic limitations, and environmental and land-use constraints. The primary benefit of assessing technical potential is that it establishes an upper-boundary estimate of development potential. It is important to understand that there are multiple types of potential-resource, technical, economic, and market (Lopez at al. 2012; NREL, Renewable Energy Technical Potential").
The Solar Programmatic Environmental Impact Statement identified 17 solar energy zones for priority development of utility-scale solar facilities in six western states. These zones total 285,000 acres and are estimated to accommodate up to 24 GW of solar potential. The program also allows development, subject to a more rigorous review, on an additional 19 million acres of public land. Development is prohibited on approximately 79 million acres.
According to NREL's Concentrating Solar Power Projects website and the CSP Today Global Projects Tracker (New Energy Update 2018), 12 of the 14 currently operational CSP plants greater than 5 MWe in the United States use parabolic trough technology, and two are power tower facilities-Ivanpah (392 MWe) and Crescent Dunes (110 MWe).
Base Year and Future Year Projections Overview
For the ATB, three representative sites were chosen based on resource class to demonstrate the range of cost and performance across the United States:
- CAPEX is determined using manufacturing cost models and is benchmarked with industry data. CSP performance and cost are based on the molten-salt power tower technology with dry-cooling to reduce water consumption.
- O&M cost is benchmarked against industry data.
- Capacity factor varies with inclusion of TES and solar irradiance. The listed projects assume power towers with 10 hours of TES at these locations:
- Fair resource (e.g., Abilene Regional Airport, Texas 5.59 kWh/m2/day based on the site TMY3 file)
- Good resource (e.g., Las Vegas, Nevada 7.1 kWh/m2/day based on the site TMY3 file)
- Excellent resource (e.g., Daggett, California 7.46 kWh/m2/day based on the site TMY3 file).
- Representative CSP plant size is net 100 MWe.
The CSP costs originated from a NREL survey leading to updated cost estimates in SAM 2017.09.05. These 2017 costs were deflated to the ATB Base Year of 2016 via the consumer price index. The SAM 2017 costs translate to costs in 2020 in the ATB due to the three-year construction period. (SAM costs are based on the project announcement year, while the ATB is based on the plant commissioning year).
Future year projections are informed by published literature and technology pathway assessments for CAPEX and O&M cost reductions. Three different projections were developed for scenario modeling as bounding levels:
- Constant Technology Cost Scenario: no change in CAPEX, O&M, or capacity factor from current estimates (2020 for CSP) to 2050; consistent across all renewable energy technologies in the ATB
- Mid Technology Cost Scenario: the median of published literature projections for future CAPEX; it is expected based on literature that there could be a 25% CAPEX reduction by 2030 from the 2015 costs (Feldman et al. 2016). From 2030 to 2050, a further 20% reduction in CAPEX is assumed.
- Low Technology Cost Scenario: originates from the lowest CAPEX projections in literature to 2025 (IRENA 2016) and is extended to later years based on DOE research targets.
References
IRENA 2018. Renewable Power Generation Costs in 2017. Abu Dhabi: International Renewable Energy Agency. http://www.irena.org/-/media/Files/IRENA/Agency/Publication/2018/Jan/IRENA_2017_Power_Costs_2018.pdf
The Power to Change: Solar and Wind Cost Reduction Potential to 2025. June 2016. Paris: International Renewable Energy Agency. http://www.irena.org/DocumentDownloads/Publications/IRENA_Power_to_Change_2016.pdf.
Danko, Pete. 2015. "SolarReserve: Crescent Dunes Solar Tower Will Power Up in March: Without Ivanpah's Woes." Breaking Energy. February 10, 2015. http://breakingenergy.com/2015/02/10/solarreserve-crescent-dunes-solar-tower-will-power-up-in-march-without-ivanpahs-woes/.
Details as in the sheet: NREL (National Renewable Energy Laboratory). n.d. "Concentrating Solar Power Projects." https://www.nrel.gov/csp/solarpaces/
Details as in the sheet: SolarReserve. 2018. "Sandstone." Project overview. http://www.solarreserve.com/en/global-projects/csp/sandstone.
Details: NREL. February 2018. "Direct Normal Irradiance 1998 – 2016", forthcoming at https://www.nrel.gov/gis/solar.html
Feldman, David, Robert Margolis, Paul Denholm, and Joseph Stekli. 2016. Exploring the Potential Competitiveness of Utility-Scale Photovoltaics plus Batteries with Concentrating Solar Power, 2015–2030. Golden, CO: National Renewable Energy Laboratory. NREL/TP-6A20-66592. http://www.nrel.gov/docs/fy16osti/66592.pdf.
Lopez, Anthony, Billy Roberts, Donna Heimiller, Nate Blair, and Gian Porro. 2012. U.S. Renewable Energy Technical Potentials: A GIS-Based Analysis. National Renewable Energy Laboratory. NREL/TP-6A20-51946. http://www.nrel.gov/docs/fy12osti/51946.pdf.
Mehos, Mark, Craig Turchi, Craig, Judith Vidal, Michael Wagner, Zhiwen Ma, Clifford Ho, William Kolb, Charles Andraka, and Alan Kruizenga. 2017. Concentrating Solar Power Gen3 Demonstration Roadmap. Golden, CO: National Renewable Energy Laboratory. NREL/TP-5500-67464. January 2017. http://www.nrel.gov/docs/fy17osti/67464.pdf.
Mehos, Mark, Dan Kabel, and Phil Smithers. 2009. "Planting the Seed: Greening the Grid with Concentrating Solar Power." IEEE Power and Energy Magazine 7(3, May/June 2009): 55–62. http://dx.doi.org/10.1109/MPE.2009.932308.
New Energy Update. 2018. "CSP Today Global Tracker." http://tracker.newenergyupdate.com/tracker/projects/.
Taylor, Phil. 2016. "Nev. Plant Solves Quandary of How to Store Sunshine." E&E News. March 29, 2016. http://www.eenews.net/stories/1060034748.