Annual Technology Baseline 2017
National Renewable Energy Laboratory
Recommended Citation:
NREL (National Renewable Energy Laboratory). 2017. 2017 Annual Technology Baseline. Golden, CO: National Renewable Energy Laboratory. http://atb.nrel.gov/.
Please consult Guidelines for Using ATB Data:
https://atb.nrel.gov/electricity/user-guidance.html
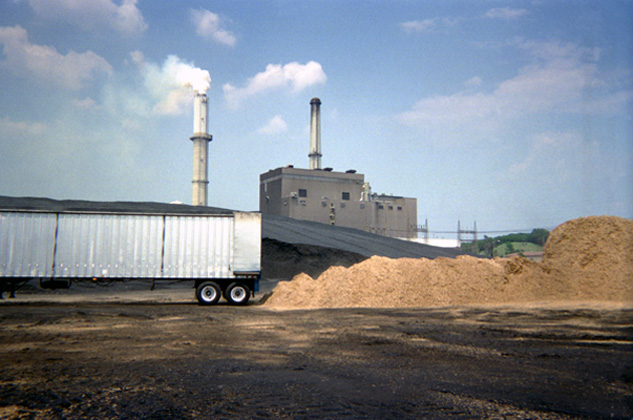
Biopower Plants
In a biopower plant:
- Heat is created: Biomass (sometimes co-fired with coal) is pulverized, mixed with hot air, and burned in suspension.
- Water turns to steam: The heat turns purified water into steam, which is piped to the turbine.
- Steam turns the turbine: The pressure of the steam pushes the turbine blade, turns the shaft in the generator, and creates power.
- Steam is turned back into water: Cool water is drawn into a condenser where the steam turns back into water that can be reused in the plant.
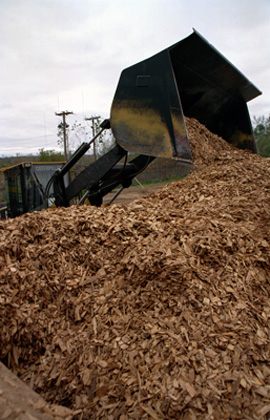
(a biomass gasifier that operates on wood chips)
Renewable energy technical potential, as defined by Lopez et al. (2012), represents the achievable energy generation of a particular technology given system performance, topographic limitations, and environmental and land-use constraints. Technical resource potential for biopower is based on estimated biomass quantities from the Billion Ton Update study (DOE 2011).
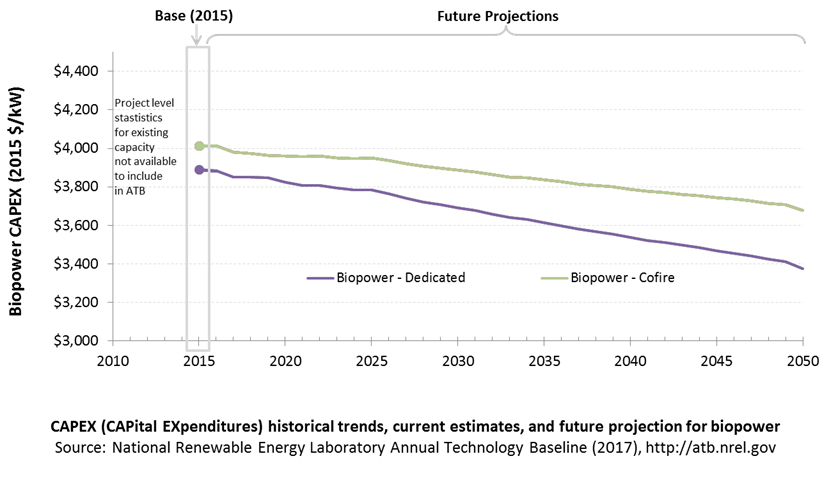
CAPital EXpenditures (CAPEX): Historical Trends, Current Estimates, and Future Projections
Because biopower plants are well-known and perform close to their optimal performance, EIA expects capital expenditures (CAPEX) will incrementally improve over time and slightly more quickly than inflation.
The exception is new biomass cofiring, which is expected to have costs that decline a bit more than existing cofiring project technologies.
CAPEX Definition
Capital expenditures (CAPEX) are expenditures required to achieve commercial operation in a given year.
Overnight capital costs are modified from EIA (2014). Capital costs include overnight capital cost plus defined transmission cost, and it removes a material price index. The overnight capital costs for cofired units are not the cost of upgrading a plant but the total cost of the plant after the upgrade.
Fuel costs are taken from the Billion Ton Update study (DOE 2011).
| Overnight Capital Cost ($/kW) | Construction Financing Factor (ConFinFactor) | CAPEX ($/kW) | |
|---|---|---|---|
| Dedicated: Dedicated biopower plant | $3,737 | 1.041 | $3,889 |
| CofireOld: Pulverized coal with sulfur dioxide (SO2) scrubbers and biomass co-firing | $3,856 | 1.041 | $4,013 |
| CofireNew: Advanced supercritical coal with SO2 and NOx controls and biomass co-firing | $3,856 | 1.041 | $4,013 |
CAPEX can be determined for a plant in a specific geographic location as follows:
CAPEX = ConFinFactor*(OCC*CapRegMult+GCC).
(See the Financial Definitions tab in the ATB data spreadsheet.)
Regional cost variations and geographically specific grid connection costs are not included in the ATB (CapRegMult = 1; GCC = 0). In the ATB, the input value is overnight capital cost (OCC) and details to calculate interest during construction (ConFinFactor).
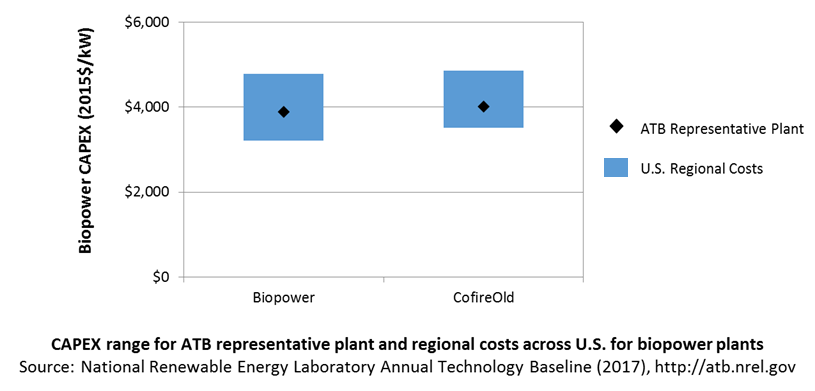
In the ATB, CAPEX represents each type of biopower plant with a unique value. Regional cost effects associated with labor rates, material costs, and other regional effects as defined by EIA (2016a) expand the range of CAPEX. Unique land-based spur line costs based on distance and transmission line costs are not estimated. The following figure illustrates the ATB representative plant relative to the range of CAPEX including regional costs across the contiguous United States. The ATB representative plants are associated with a regional multiplier of 1.0.
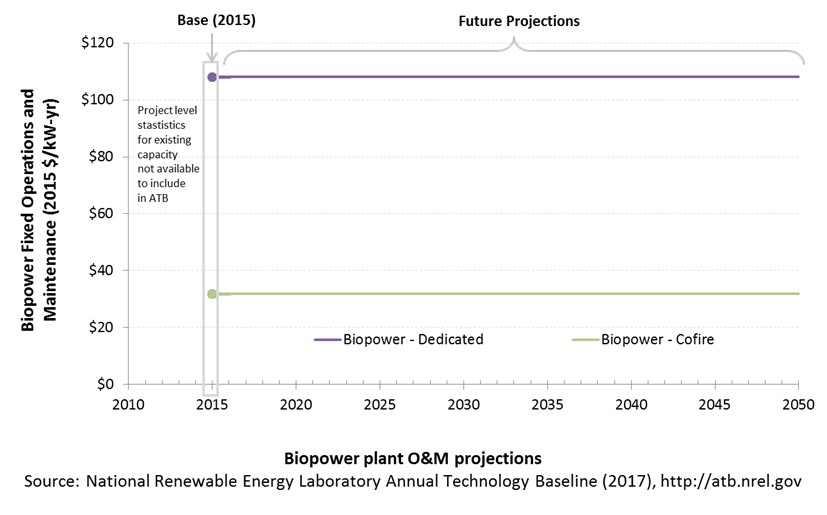
Operation and Maintenance (O&M) Costs
Operations and maintenance (O&M) costs represent the annual expenditures required to operate and maintain a plant over its technical lifetime (the distinction between economic life and technical life is described here), including:
- Insurance, taxes, land lease payments, and other fixed costs
- Present value and annualized large component replacement costs over technical life
- Scheduled and unscheduled maintenance of power plants, transformers, and other components over the technical lifetime of the plant.
Market data for comparison are limited and generally inconsistent in the range of costs covered and the length of the historical record.
Capacity Factor: Expected Annual Average Energy Production Over Lifetime
The capacity factor represents the assumed annual energy production divided by the total possible annual energy production, assuming the plant operates at rated capacity for every hour of the year. For biopower plants, the capacity factors are typically lower than their availability factors. Biopower plant availability factors have a wide range depending on system design, fuel type and availability, and maintenance schedules.
Biopower plants are typically baseload plants with steady capacity factors. For the ATB, the biopower capacity factor is taken as the average capacity factor for biomass plants for 2015, as reported by EIA.
Biopower capacity factors are influenced by technology and feedstock supply, expected downtime, and energy losses.

Levelized Cost of Energy (LCOE) Projections
Levelized cost of energy (LCOE) is a simple metric that combines the primary technology cost and performance parameters, CAPEX, O&M, and capacity factor. It is included in the ATB for illustrative purposes. The focus of the ATB is to define the primary cost and performance parameters for use in electric sector modeling or other analysis where more sophisticated comparisons among technologies are made. LCOE captures the energy component of electric system planning and operation, but the electric system also requires capacity and flexibility services to operate reliably. Electricity generation technologies have different capabilities to provide such services. For example, wind and PV are primarily energy service providers, while the other electricity generation technologies provide capacity and flexibility services in addition to energy. These capacity and flexibility services are difficult to value and depend strongly on the system in which a new generation plant is introduced. These services are represented in electric sector models such as the ReEDS model and corresponding analysis results such as the Standard Scenarios.
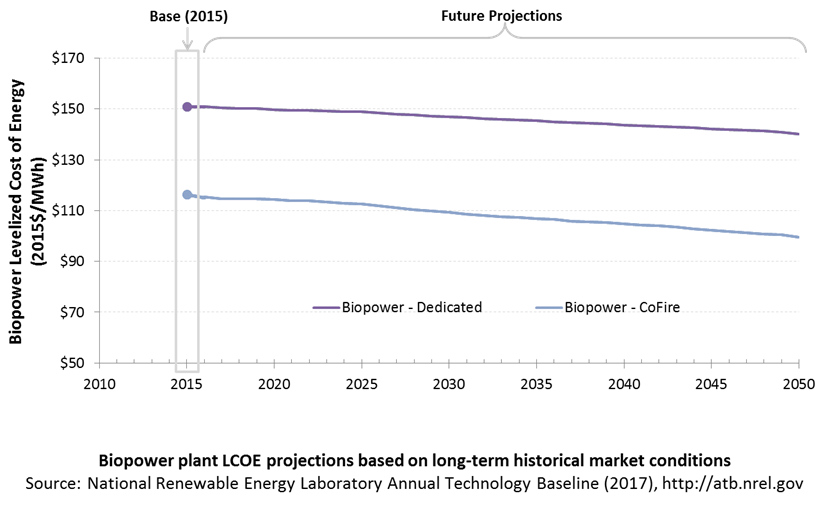
The following three figures illustrate the combined impact of CAPEX, O&M, and capacity factor projections across the range of resources present in the contiguous United States. The Current Market Conditions LCOE demonstrates the range of LCOE based on macroeconomic conditions similar to the present. The Historical Market Conditions LCOE presents the range of LCOE based on macroeconomic conditions consistent with prior ATB editions and Standard Scenarios model results. The Normalized LCOE (all LCOE estimates are normalized with the lowest Base Year LCOE value) emphasizes the relative effect of fuel price and heat rate independent of project finance assumptions. Data for all the resource categories can be found in the ATB data spreadsheet.
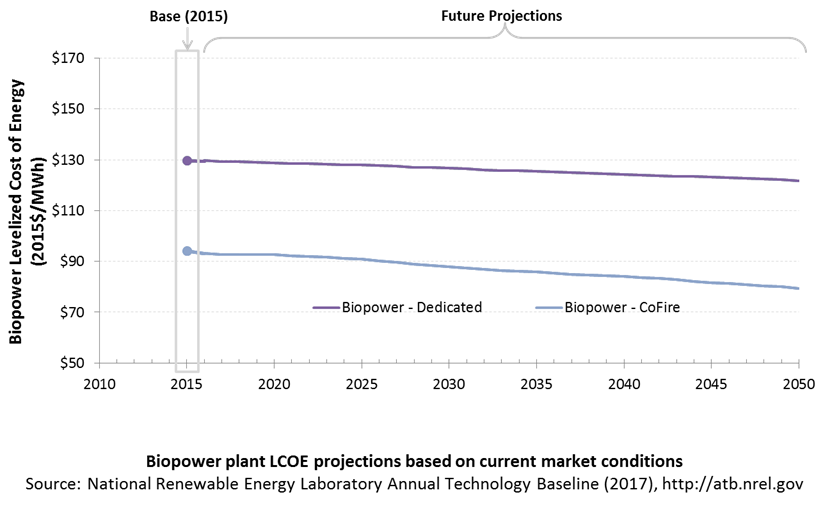
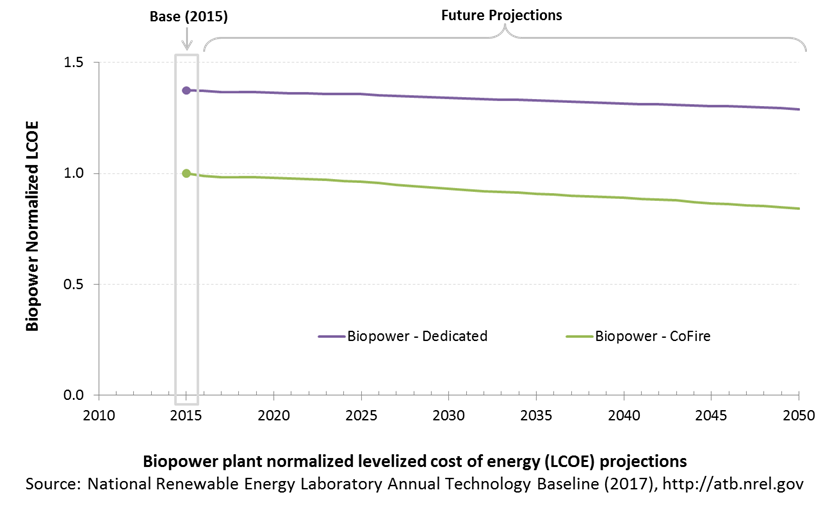
The LCOE of biopower plants is directly impacted by the differences in CAPEX (installed capacity costs) as well as by heat rate differences. For a given year, the LCOE assumes that the fuel prices from that year continue throughout the lifetime of the plant.
Regional variations will ultimately impact biomass feedstock costs, but these are not included in the ATB.
The projections do not include any cost of carbon.
Fuel prices are based on the EIA's Annual Energy Outlook 2017 (EIA 2017).
To estimate LCOE, assumptions about the cost of capital to finance electricity generation projects are required. For comparison in the ATB, two project finance structures are represented.
- Current Market Conditions: The values of the production tax credit (PTC) and investment tax credit (ITC) are ramping down by 2020, at which time wind and solar projects may be financed with debt fractions similar to other technologies. This scenario reflects debt interest (4.4% nominal, 1.9% real) and return on equity rates (9.5% nominal, 6.8% real) to represent 2017 market conditions (AEO 2017) and a debt fraction of 60% for all electricity generation technologies. An economic life, or period over which the initial capital investment is recovered, of 20 years is assumed for all technologies. These assumptions are one of the project finance options in the ATB spreadsheet.
- Long-Term Historical Market Conditions: Historically, debt interest and return on equity were represented with higher values. This scenario reflects debt interest (8% nominal, 5.4% real) and return on equity rates (13% nominal, 10.2% real) implemented in the ReEDS model and reflected in prior versions of the ATB and Standard Scenarios model results. A debt fraction of 60% for all electricity generation technologies is assumed. An economic life, or period over which the initial capital investment is recovered, of 20 years is assumed for all technologies. These assumptions are one of the project finance options in the ATB spreadsheet.
These parameters are held constant for estimates representing the Base Year through 2050. No incentives such as the PTC or ITC are included. The equations and variables used to estimate LCOE are defined on the equations and variables page. For illustration of the impact of changing financial structures such as WACC and economic life, see Project Finance Impact on LCOE. For LCOE estimates for High, Mid, and Low scenarios for all technologies, see 2017 ATB Cost and Performance Summary.
References
DOE (U.S. Department of Energy). 2011. U.S. Billion-Ton Update: Biomass Supply for a Bioenergy and Bioproducts Industry. Perlack, R.D., and B.J. Stokes, eds. Oak Ridge, TN: Oak Ridge National Laboratory. ORNL/TM-2011/224. August 2011. https://www.osti.gov/scitech/biblio/1023318.
EIA (U.S. Energy Information Administration). 2014. Annual Energy Outlook 2014 with Projections to 2040. Washington, D.C.: U.S. Department of Energy. DOE/EIA-0383(2014). April 2014. http://www.eia.gov/forecasts/aeo/pdf/0383(2014).pdf.
EIA (U.S. Energy Information Administration). 2016a. Capital Cost Estimates for Utility Scale Electricity Generating Plants. Washington, D.C.: U.S. Department of Energy. November 2016. https://www.eia.gov/analysis/studies/powerplants/capitalcost/pdf/capcost_assumption.pdf.
EIA (U.S. Energy Information Administration). 2017. Annual Energy Outlook 2017 with Projections to 2050. Washington, D.C.: U.S. Department of Energy. January 5, 2017. http://www.eia.gov/outlooks/aeo/pdf/0383(2017).pdf.
Lopez, Anthony, Billy Roberts, Donna Heimiller, Nate Blair, and Gian Porro. 2012. U.S. Renewable Energy Technical Potentials: A GIS-Based Analysis. National Renewable Energy Laboratory. NREL/TP-6A20-51946. http://www.nrel.gov/docs/fy12osti/51946.pdf.