Annual Technology Baseline 2017
National Renewable Energy Laboratory
Recommended Citation:
NREL (National Renewable Energy Laboratory). 2017. 2017 Annual Technology Baseline. Golden, CO: National Renewable Energy Laboratory. http://atb.nrel.gov/.
Please consult Guidelines for Using ATB Data:
https://atb.nrel.gov/electricity/user-guidance.html
Land-Based Wind Power Plants
Representative Technology
Most land-based wind plants in the United States range in capacity from 50 MW to 100 MW (Wiser and Bolinger 2015). Wind turbines installed in the United States in 2015 were, on average, 2-MW turbines with rotor diameters of 102 m and hub heights of 82 m (Moné et al. 2017).
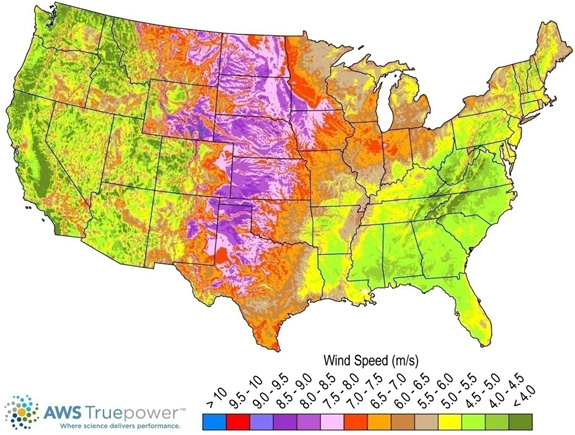
Resource Potential
Wind resource is prevalent throughout the United States but is concentrated in the central states. Total land-based wind technical potential exceeds 10,000 GW (almost tenfold current total U.S. electricity generation capacity), which corresponds to over 3.5 million km2 of potential land area after accounting for standard exclusions such as federally protected areas, urban areas, and water. Resource potential has been expanded from approximately 6,000 GW (DOE 2015) by including locations with lower wind speeds to provide more comprehensive coverage of U.S. land areas where future technology may improve economic potential.
Renewable energy technical potential, as defined by Lopez et al. (2012), represents the achievable energy generation of a particular technology given system performance, topographic limitations and environmental and land-use constraints. The primary benefit of assessing technical potential is that it establishes an upper-boundary estimate of development potential. It is important to understand that there are multiple types of potential-resource, technical, economic, and market (Lopez et al. 2012; NREL, "Renewable Energy Technical Potential").
The resource potential is calculated by using over 130,000 distinct areas for wind plant deployment that cover over 3.5 million km2. The potential capacity is estimated to total over 10,000 GW if a packing density of 3MW/km2 is assumed.
Base Year and Future Year Projections Overview
For each of the 130,000 distinct areas, an LCOE is estimated taking into consideration site-specific hourly wind profiles. Five different wind turbines are associated with a range of average annual wind speed based on actual wind plant installations in 2015. This method is described in Moné et al, (2017) and summarized below.
- The capital expenditures (CAPEX) associated with wind plants installed in 2015 in the interior of the country are used to represent wind plants associated with average annual wind speeds that correspond with the median wind speed for projects installed in 2015. A range of CAPEX across the range of wind speeds is developed using engineering models and assumed differences in rotor diameter. Wind turbines at lower wind speed sites have larger rotors and, therefore, higher CAPEX.
- The capacity factor is determined for each unique geographic location using the site-specific hourly wind profile and a power curve that corresponds with the five wind turbines defined to represent the range of wind technology installed in the United States in 2015.
- Average annual operations and maintenance (O&M) costs are assumed equivalent at all geographic locations.
- LCOE is calculated for each area based on the CAPEX and capacity factor estimated for each area.
For illustration in the ATB, the full resource potential, represented by 130,000 areas, was divided into 10 techno-resource groups (TRGs). The capacity-weighted average CAPEX, O&M, and capacity factor for each group is presented in the ATB.
Future year projections are derived from estimated cost reduction potential for land-based wind technologies based on elicitation of over 160 wind industry experts (Wiser et al. 2016). This study produced three different cost reduction pathways, and the median and low estimates for LCOE reduction are used for ATB Mid and ATB Low cost scenarios. Because the overall LCOE reduction was used as the basis for the ATB projections, all three cost elements - CAPEX, O&M, and capacity factor - should be considered together. The individual component projections are illustrative. Three different projections were developed for scenario modeling as bounding levels:
- High cost: no change in CAPEX, O&M, or capacity factor from 2015 to 2050; consistent across all renewable energy technologies in the ATB
- Mid cost: LCOE percent reduction from the Base Year equivalent to that corresponding to the Median Scenario (50% probability) in expert survey (Wiser et al. 2016)
- Low Cost: LCOE percent reduction from the Base Year equivalent to that corresponding to the Low Scenario (10% probability) in expert survey (Wiser et al. 2016).
References
DOE (U.S. Department of Energy). 2015. Wind Vision: A New Era for Wind Power in the United States. U.S. Department of Energy. DOE/GO-102015-4557. March 2015. http://energy.gov/sites/prod/files/2015/03/f20/wv_full_report.pdf.
Lopez, Anthony, Billy Roberts, Donna Heimiller, Nate Blair, and Gian Porro. 2012. U.S. Renewable Energy Technical Potentials: A GIS-Based Analysis. National Renewable Energy Laboratory. NREL/TP-6A20-51946. http://www.nrel.gov/docs/fy12osti/51946.pdf.
Moné, Christopher, Maureen Hand, Mark Bolinger, Joseph Rand, Donna Heimiller, and Jonathan Ho. 2017. 2015 Cost of Wind Energy Review. Golden, CO: National Renewable Energy Laboratory. NREL/TP-6A20-66861. http://www.nrel.gov/docs/fy17osti/66861.pdf.
Wiser, Ryan, and Mark Bolinger. 2016. 2015 Wind Technologies Market Report. August 2016. https://emp.lbl.gov/sites/default/files/2015-windtechreport.final_.pdf.
Wiser, Ryan, Karen Jenni, Joachim Seel, Erin Baker, Maureen Hand, Eric Lantz, and Aaron Smith. 2016. Forecasting Wind Energy Costs and Cost Drivers: The Views of the World's Leading Experts. Berkeley, CA: Lawrence Berkeley National Laboratory. LBNL-1005717. June 2016. https://emp.lbl.gov/publications/forecasting-wind-energy-costs-and.