Annual Technology Baseline 2017
National Renewable Energy Laboratory
Recommended Citation:
NREL (National Renewable Energy Laboratory). 2017. 2017 Annual Technology Baseline. Golden, CO: National Renewable Energy Laboratory. http://atb.nrel.gov/.
Please consult Guidelines for Using ATB Data:
https://atb.nrel.gov/electricity/user-guidance.html
Offshore Wind Power Plants
Representative Technology
In 2016, the first offshore wind plant commenced commercial operation in the United States near Block Island (Rhode Island). This demonstration project is 30 MW in capacity; in the ATB, cost and performance estimates are made for commercial-scale projects 600 MW in capacity. The ATB Base Year offshore wind plant technology reflects a machine rating of 3.4 MW with a rotor diameter of 115 m and hub height of 85 m, which is typical of European projects installed in 2015.
Resource Potential
Wind resource is prevalent throughout major U.S. coastal areas, including the Great Lakes. The resource potential exceeds 2,000 GW (Musial et al. 2016), excluding Alaska. Prior estimates of offshore wind resource potential (Schwartz et al. 2010) were updated in 2016 to extend domain boundaries from 50 nautical miles (nm) to 200 nm, consider turbine hub heights of 100 m (previously 90 m), and assume a capacity array power density of 3 MW/km2 (Musial et al. 2016). A range of technology exclusions were applied based on maximum water depth for deployment, minimum wind speed, and limits to floating technology in freshwater surface ice. Resource potential was represented by over 7,000 areas for offshore wind plant deployment after accounting for competing use and environmental exclusions, such as marine protected areas, shipping lanes, pipelines, and others.
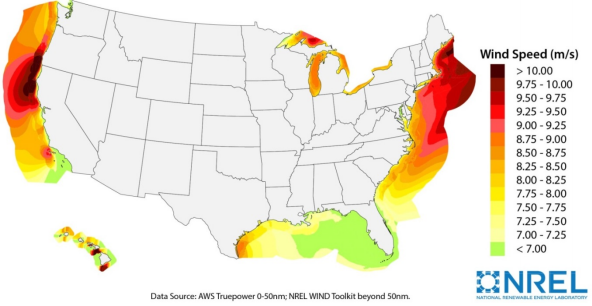
Source: Musial et al. 2016
Renewable energy technical potential, as defined by Lopez et al. (2012), represents the achievable energy generation of a particular technology given system performance, topographic limitations, and environmental and land-use constraints. The primary benefit of assessing technical potential is that it establishes an upper-boundary estimate of development potential. It is important to understand that there are multiple types of potential - resource, technical, economic, and market (Lopez at al. 2012; NREL, "Renewable Energy Technical Potential").
Base Year and Future Year Projections Overview
Based on the Musial et al. (2016) resource assessment, LCOE was estimated at more than 7,000 areas (with a total capacity of approximately 2,000 GW) in Beiter et al. (2016), taking into consideration a variety of spatial parameters, such as wind speeds, water depth, distance from shore, distance to ports, and wave height. CAPEX, O&M, and capacity factor are calculated for each geographic location using engineering models, hourly wind resource profiles, and representative sea states. The spatial LCOE assessment served as the basis for estimating the ATB baseline LCOE in the Base Year 2015, weighted by the available capacity, for fixed-bottom and floating offshore wind technology.
The Base Year LCOE assumes a 3.4-MW turbine size and long-term average hourly wind profiles and it reflects the least-cost choice among three sub-structure types (Beiter et al. 2016):
- Monopile (fixed-bottom)
- Jacket (fixed-bottom)
- Semi-submersible (floating)
The representative offshore wind plant size is assumed to be 600 MW (Beiter et al. 2016). For illustration in the ATB, the full resource potential, represented by 7,000 areas, was divided into 15 techno-resource groups (TRGs). The capacity-weighted average CAPEX, O&M, and capacity factor for each group is presented in the ATB.
Future year projections are derived from estimated cost reduction potential for offshore wind technologies based on elicitation of over 160 wind industry experts (Wiser et al. 2016). This study produced three different cost reduction pathways, and the median and low estimates are used for ATB Mid and ATB Low cost scenarios. Three different projections were developed for scenario modeling as bounding levels:
- High cost: no change in CAPEX, O&M, or capacity factor from 2015 to 2050; consistent across all renewable energy technologies in the ATB
- Mid cost: LCOE percent reduction from the Base Year equivalent to that corresponding to the Median Scenario (50% probability) in expert survey (Wiser et al. 2016)
- Low Cost: LCOE percent reduction from the Base Year equivalent to that corresponding to the Low Scenario (10% probability) in expert survey (Wiser et al. 2016).
References
Beiter, Philipp, Walter Musial, Aaron Smith, Levi Kilcher, Rick Damiani, Michael Maness, Senu Sirnivas, Tyler Stehly, Vahan Gevorgian, Meghan Mooney, and George Scott. 2016. A Spatial-Economic Cost-Reduction Pathway Analysis for U.S. Offshore Wind Energy Development from 2015-2030. Golden, CO: National Renewable Energy Laboratory. NREL/TP-6A20-66579. September 2016. http://www.nrel.gov/docs/fy16osti/66579.pdf.
Lopez, Anthony, Billy Roberts, Donna Heimiller, Nate Blair, and Gian Porro. 2012. U.S. Renewable Energy Technical Potentials: A GIS-Based Analysis. National Renewable Energy Laboratory. NREL/TP-6A20-51946. http://www.nrel.gov/docs/fy12osti/51946.pdf.
Musial, Walt, Donna Heimiller, Philipp Beiter, George Scott, and Caroline Draxl. 2016. 2016 Offshore Wind Energy Resource Assessment for the United States. Golden, CO: National Renewable Energy Laboratory. NREL/TP-5000-66599. September 2016. http://www.nrel.gov/docs/fy16osti/66599.pdf.
Wiser, Ryan, Karen Jenni, Joachim Seel, Erin Baker, Maureen Hand, Eric Lantz, and Aaron Smith. 2016. Forecasting Wind Energy Costs and Cost Drivers: The Views of the World's Leading Experts. Berkeley, CA: Lawrence Berkeley National Laboratory. LBNL-1005717. June 2016. https://emp.lbl.gov/publications/forecasting-wind-energy-costs-and.