Annual Technology Baseline 2017
National Renewable Energy Laboratory
Recommended Citation:
NREL (National Renewable Energy Laboratory). 2017. 2017 Annual Technology Baseline. Golden, CO: National Renewable Energy Laboratory. http://atb.nrel.gov/.
Please consult Guidelines for Using ATB Data:
https://atb.nrel.gov/electricity/user-guidance.html
Concentrating Solar Power
Plant Cost and Performance Projections Methodology
When comparing the ATB projections with other projections, note that there are major differences in technology assumptions, radiation conditions, field sizes, storage configurations, and other factors.
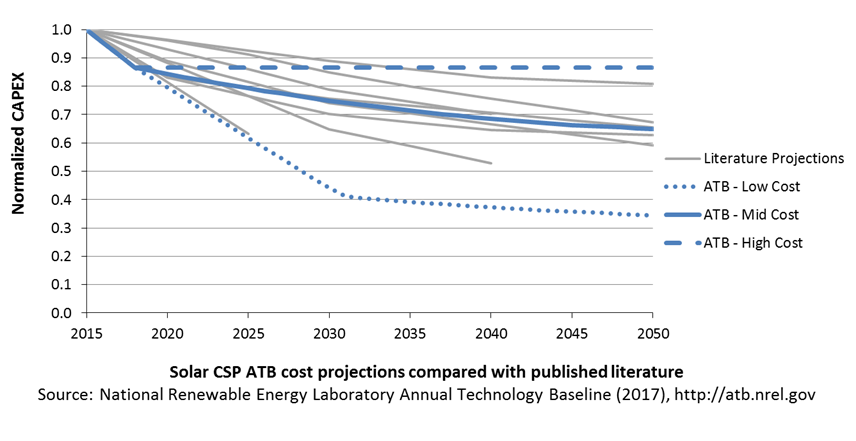
The Low ATB projection is based on the SunShot Vision Study (DOE 2012; Mehos et al. 2016 ) and has been vetted with solar industry representatives.
Attempts have been made to clarify the specifics of the other published CSP projections (e.g., number of hours of storage and solar multiple). As yet, this has not been possible in detail for the ATB 2017.
Projections of future utility-scale CSP plant CAPEX and O&M are based on three different projections developed for scenario modeling as bounding levels:
- High
- Modeled as molten-salt (sodium nitrate/potassium nitrate, aka, solar salt) power tower with direct two-tank TES combined with a steam-Rankine power cycle running at 574°C and 41.2% gross efficiency in 2015
- Costs stay the same from the 2018 estimate through 2050, consistent with ATB renewable energy technologies
- Mid
- Based on published projections that highlight an overall CSP CAPEX reduction by 25% by 2030 and which represent a potential median compared to other published CSP projections until 2050 (Feldman et al. 2016; IRENA 2016)
- Gradual reductions in heliostat and power system cost due to greater deployment volume depicted for 2018 based on current state of industry
- CAPEX and O&M both drop by 25% by 2030
- Low
- Significant reductions in heliostat and power system cost due to greater deployment volume and R&D depicted for 2018; modeled as an advanced molten-salt power tower with direct two-tank TES combined with a power cycle running at 700°C and 55% gross efficiency in 2030 (Mehos et al. 2016)
- Learning rate applied: 9.9% for the solar field and 12% for the turbine based on global projected CSP deployment are applied after 2030
- SunShot CAPEX and O&M targets are met in 2030, including new, high-efficiency power cycles and low-cost heliostats.
References
DOE (U.S. Department of Energy). 2012. SunShot Vision Study. DOE/GO-102012-3037. February 2012. https://www1.eere.energy.gov/solar/pdfs/47927.pdf.
Feldman, David, Robert Margolis, Paul Denholm, and Joseph Stekli. 2016. Exploring the Potential Competitiveness of Utility-Scale Photovoltaics plus Batteries with Concentrating Solar Power, 2015–2030. Golden, CO: National Renewable Energy Laboratory. NREL/TP-6A20-66592. August 2016. http://www.nrel.gov/docs/fy16osti/66592.pdf.
IRENA (International Renewable Energy Agency). 2016. The Power to Change: Solar and Wind Cost Reduction Potential to 2025. June 2016. Paris: International Renewable Energy Agency. http://www.irena.org/DocumentDownloads/Publications/IRENA_Power_to_Change_2016.pdf.
Mehos, Mark, Craig Turchi, Jennie Jorgenson, Paul Denholm, Clifford Ho, and Kenneth Armijo. 2016. On the Path to SunShot: Advancing Concentrating Solar Power Technology, Performance, and Dispatchability. Golden, CO: National Renewable Energy Laboratory. NREL/TP-5500-65688. May 2016. http://www.nrel.gov/docs/fy16osti/65688.pdf.