Annual Technology Baseline 2017
National Renewable Energy Laboratory
Recommended Citation:
NREL (National Renewable Energy Laboratory). 2017. 2017 Annual Technology Baseline. Golden, CO: National Renewable Energy Laboratory. http://atb.nrel.gov/.
Please consult Guidelines for Using ATB Data:
https://atb.nrel.gov/electricity/user-guidance.html
Residential PV Systems
Plant Cost and Performance Projections Methodology
Currently, CAPEX - not LCOE - is the most common metric for PV cost. Due to differing assumptions in long-term incentives, system location and production characteristics, and cost of capital, LCOE can be confusing and often incomparable between differing estimates. While CAPEX also has many assumptions and interpretations, it involves fewer variables to manage. Therefore, PV projections in the ATB are driven entirely by plant and operational cost improvements.
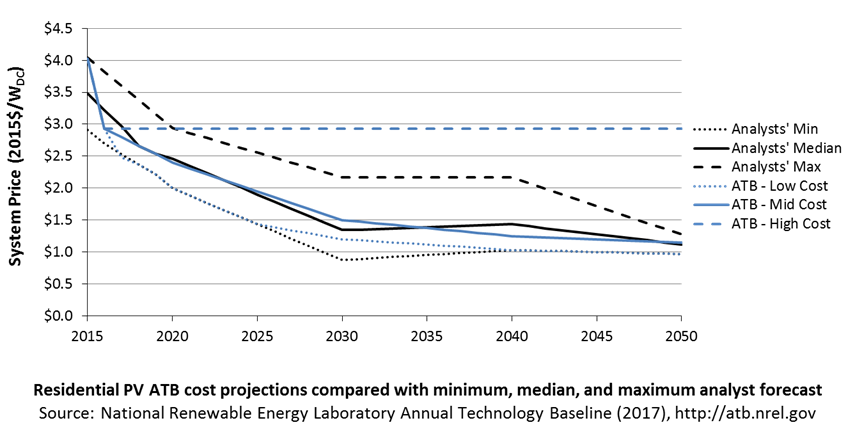
We created High, Mid, and Low CAPEX cases to explore the range of possible outcomes of future PV cost improvements. The High case represents no CAPEX improvements made beyond today, the Mid case represents current expectations of price reductions in a "business-as-usual" scenario, and the Low case represents current expectations of potential cost reductions given improved R&D funding and more aggressive global deployment targets.
While CAPEX is one of the drivers to lower costs, R&D efforts continue to focus on other areas to lower the cost of energy from residential PV. While these are not incorporated in the ATB, they include: longer system lifetime, improved performance and reliability, and lower cost of capital.
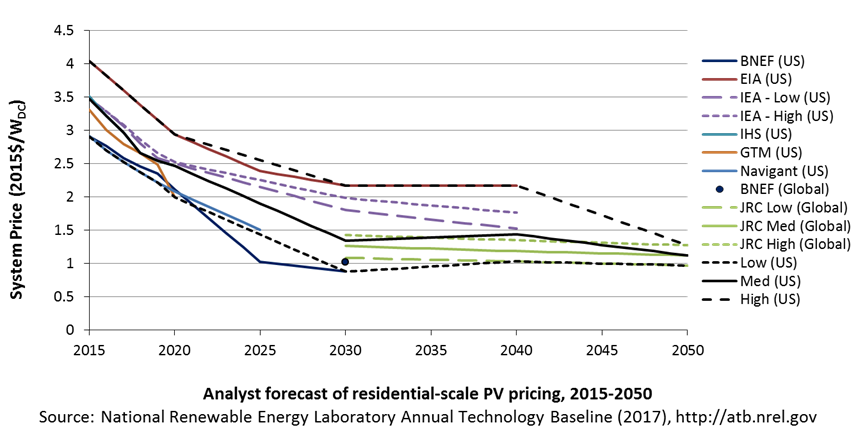
Projections of future residential PV installation CAPEX are based on 11 system price projections from 7 separate institutions. Projections include short-term U.S. price forecasts made in the past six months and long-term global and U.S. price forecasts made in the past three years. The short-term forecasts were primarily provided by market analysis firms with expertise in the PV industry, through a subscription service with NREL. The long-term forecasts primarily represent the collection of publicly available, unique forecasts with either a long-term perspective of solar trends or through capacity expansion models with assumed learning by doing.
- Short-term forecast institutions: Bloomberg New Energy Finance, GTM Research, IHS Technology, International Energy Agency, Navigant Research, U.S. Energy Information Administration
- Long-term forecast institutions: Bloomberg New Energy Finance, European Commission's Joint Research Centre, International Energy Agency, U.S. Energy Information Administration.
In instances in which literature projections did not include all years, a straight-line change in price was assumed between any two projected values. To generate a High, Mid, and Low cost forecast we took the "min," "median," and "max" of the data sets; however, we only included short-term U.S. forecasts until 2030 as they focus on near-term pricing trends within the industry. Starting in 2030, we include long-term global and U.S. forecasts in the data set, as they focus more on long-term trends within the industry. It is also assumed after 2025 U.S. prices will be on par with global averages. Many of the global projections are weighted heavily toward western countries (e.g., European countries, Japan, and the United States), and in the long-term, the United States should follow global trends. The U.S. federal tax credit for solar assets reverts down to 10% for all projects placed in service after 2023, which has the potential to lower upfront financing costs and remove any distortions in reported pricing, compared to other global markets. Additionally, a larger portion of the United States will have a more mature PV market, which should result in a narrower price range. Many institutions used one system price for all countries. Changes in price for the High, Mid, and Low cost forecast between 2020 and 2030 are interpolated on a straight-line basis.
We adjusted the "min," "median," and "max" analyst forecasts in a few different ways. All 2015 pricing is based on the median reported residential system price reported in Tracking the Sun IX (Barbose and Dargouth 2016). All 2016 pricing is based on the bottom-up benchmark analysis reported in U.S. Solar Photovoltaic System Cost Benchmark Q1 2016 (adjusted for inflation) (Fu et al. 2016). These figures are in line with other estimated system prices reported in Feldman et al. (2016).
We adjusted the Mid and Low cost projections for 2017-2050 to remove distortions caused by the combination of forecasts with different time horizons and based on internal judgment of price trends. The High projection case is kept constant at the 2016 CAPEX value, assuming no improvements beyond 2016.
All prices quoted in WAC are converted to WDC (1 WAC=1.2 WDC).
Future FOM is assumed to decline to $10/kWDC-yr by 2020 in the Low case and by 2025 in the Mid case through improvements in system operation and more durable, better performing capital equipment, as per Woodhouse et al. 2016.
Capacity factors are assumed to not increase over time. All PV system efficiency improvements are assumed to result in capital cost reductions rather than capacity factor improvements.
References
Barbose, Galen, and Naïm Dargouth. 2016. Tracking the Sun IX: The Installed Price of Residential and Non-Residential Photovoltaic Systems in the United States. Berkeley, CA: Lawrence Berkeley National Laboratory. LBNL-1006036. August 2016. https://emp.lbl.gov/sites/default/files/tracking_the_sun_ix_report.pdf.
Feldman, David, Robert Margolis, Paul Denholm, and Joseph Stekli. 2016. Exploring the Potential Competitiveness of Utility-Scale Photovoltaics plus Batteries with Concentrating Solar Power, 2015–2030. Golden, CO: National Renewable Energy Laboratory. NREL/TP-6A20-66592. August 2016. http://www.nrel.gov/docs/fy16osti/66592.pdf.
Fu, Ran, Donald Chung, Travis Lowder, David Feldman, Kristen Ardani, and Robert Margolis. 2016. U.S. Photovoltaic (PV) Prices and Cost Breakdowns: Q1 2016 Benchmarks for Residential, Commercial, and Utility-Scale Systems. Golden, CO: National Renewable Energy Laboratory. NREL/PR-6A20-67142. September 2016. http://www.nrel.gov/docs/fy16osti/67142.pdf.
Woodhouse, Michael, Rebecca Jones-Albertus, David Feldman, Ran Fu, Kelsey Horowitz, Donald Chung, Dirk Jordan, and Sarah Kurtz. 2016. On the Path to SunShot: The Role of Advancements in Solar Photovoltaic Efficiency, Reliability, and Costs. Golden, CO: National Renewable Energy Laboratory. NREL/TP-6A20-65464. May 2016. http://www.nrel.gov/docs/fy16osti/65872.pdf.