
Geothermal
Geothermal technology cost and performance projections have been updated with analysis and results from the GeoVision: Harnessing the Heat Beneath our Feet report (DOE, 2019). The GeoVision report is a collaborative multiyear effort with contributors from industry, academia, national laboratories, and federal agencies. The analysis in the report updates resource potential estimates as well as current and projected capital and O&M costs based on rigorous, bottom-up modeling.
Representative Technology
Hydrothermal geothermal technologies encompass technologies for exploring for the resource, drilling to access the resource, and building power plants to convert geothermal energy to electricity. Technology costs depend heavily on the hydrothermal resource temperature and well productivity and depth, so much so that project costs are site-specific and applying a "typical" cost to any given site would be inaccurate. The 2019 ATB uses scenarios developed by the DOE Geothermal Technology Office (Mines, 2013) for representative binary and flash hydrothermal power plant technologies. The first scenario assumes a 175°C resource at a depth of 1.5 km with wells producing an average of 110 kg/s of geothermal brine supplied to a 30-MWe binary (organic Rankine cycle) power plant. The second scenario assumes a 225°C resource at a depth of 2.5 km with wells producing 80 kg/s of geothermal brine supplied to a 40-MWe dual-flash plant. These are mid-grade or "typical" temperatures and depths for binary and flash hydrothermal projects. The ReEDS model uses the full hydrothermal supply curve. The 2019 ATB representative technologies fall in the middle or near the end of the hydrothermal resources typically deployed in ReEDS model runs.
Resource Potential
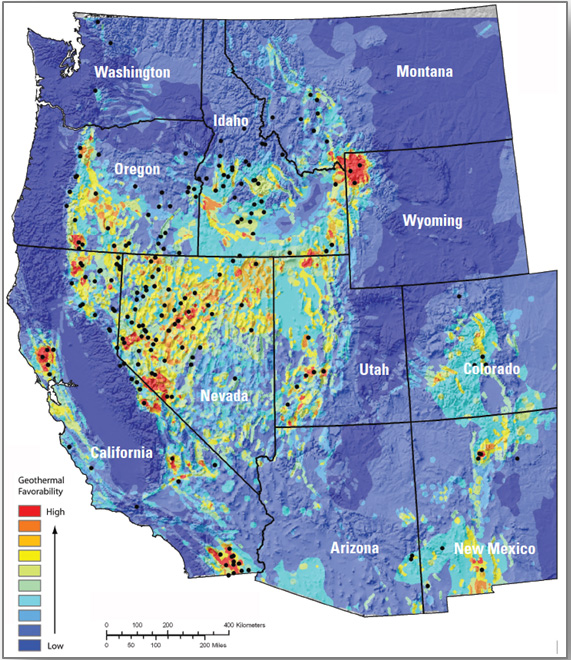
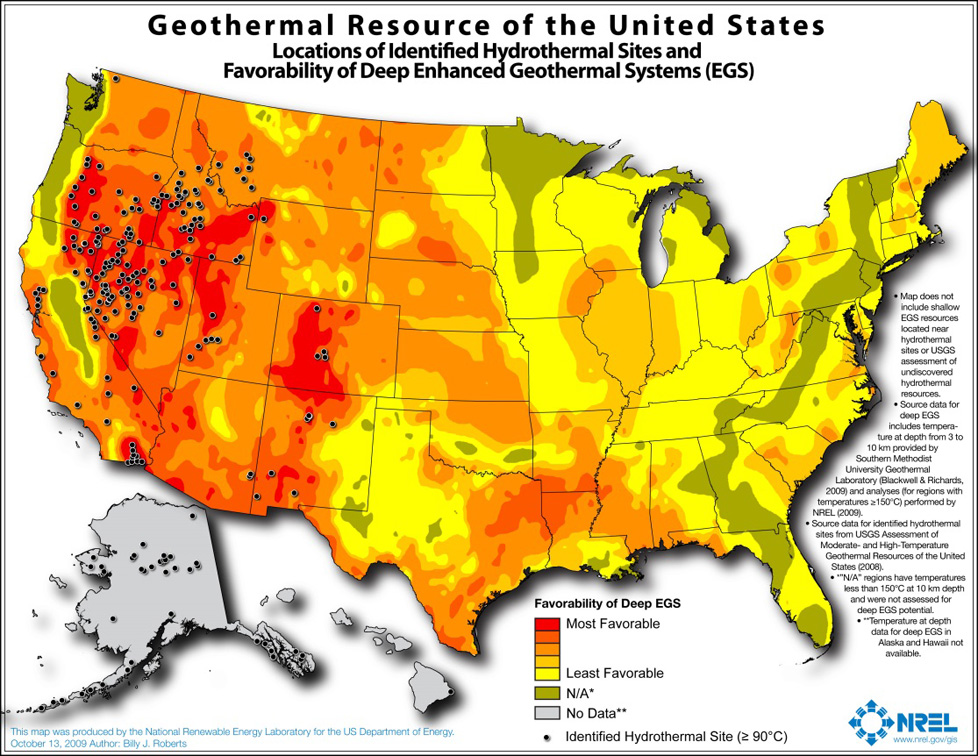
The hydrothermal geothermal resource is concentrated in the western United States. The total mean potential is 39,090 MW: 9,057 MW identified and 30,033 MW undiscovered (USGS, 2008). The resource potential identified by the U.S. Geological Survey (USGS, 2008) at each site is based on available reservoir thermal energy information from studies conducted at the site. The undiscovered hydrothermal technical potential estimate is based on a series of GIS statistical models for the spatial correlation of geological factors that facilitate the formation of geothermal systems.
The U.S. Geological Survey resource potential estimates for hydrothermal were used with the following modifications:
- Installed capacity of about 3 GW in 2016 is excluded from the resource potential.
- Resources on federally protected and U.S. Department of Defense (DOD) lands, where development is highly restricted are excluded from the resource potential, as are resources on lands where significant barriers that prevent or inhibit development of geothermal projects were identified by Augustine, Ho, and Blair (2019).
Renewable energy technical potential, as defined by Lopez et al. (2012), represents the achievable energy generation of a particular technology given system performance, topographic limitations, and environmental and land-use constraints. The primary benefit of assessing technical potential is that it establishes an upper-boundary estimate of development potential. It is important to understand that there are multiple types of potential-resource, technical, economic, and market (see NREL: "Renewable Energy Technical Potential").
Base Year and Future Year Projections Overview
The Base Year cost and performance estimates are calculated using Geothermal Electricity Technology Evaluation Model (GETEM), a bottom-up cost analysis tool that accounts for each phase of development of a geothermal plant (DOE "Geothermal Electricity Technology Evaluation Model").
- Cost and performance data for hydrothermal generation plants are estimated for each potential site using GETEM. Model results are based on resource attributes (e.g., estimated reservoir temperature, depth, and potential) of each site. GETEM inputs are derived from the Business-as-Usual (BAU) scenario from GeoVision ( (DOE, 2019), (Augustine, Ho, & Blair, 2019)).
- Site attribute values are from (USGS, 2008) for identified resource potential and from capacity-weighted averages of site attribute values of nearby identified resources for undiscovered resource potential.
- GETEM is used to estimate CAPEX, O&M, and parasitic plant losses that affect net energy production.
Capacity factor and O&M costs for plants installed in future years are unchanged from the Base Year. Projections for hydrothermal and EGS technologies are equivalent.
- Constant Technology Cost Scenario: no change in CAPEX, O&M, or capacity factor from 2015 to 2050; consistent across all renewable energy technologies in the ATB
- Mid Technology Cost Scenario: CAPEX cost reduction based on assumed minimum learning as implemented in AEO (EIA, 2015): 10% by 2035; this corresponds to a 0.5% annual improvement in CAPEX, which is assumed to continue on through 2050
- Low Technology Cost Scenario: CAPEX based on the Technology Improvement scenario from GeoVision Study ( (DOE, 2019); (Augustine, Ho, & Blair, 2019)); cost and technology improvements change linearly from present values and are fully achieved by 2030.
Representative Technology
As with cost for projects that use hydrothermal resources, EGS resource project costs depend so heavily on the hydrothermal resource temperature and well productivity and depth that project costs are site-specific. The 2019 ATB uses scenarios developed by the DOE Geothermal Technology Office (Mines, 2013) for representative binary and flash EGS power plants assuming current (immature) EGS technology performance metrics. The first scenario assumes a 175°C resource at a depth of 3 km with wells producing an average of 40 kg/s of geothermal brine supplied to a 25-MWe binary (organic Rankine cycle) power plant. The second scenario assumes a 250°C resource at a depth of 3.5 km with wells producing 40 kg/s of geothermal brine supplied to a 30-MWe dual-flash plant. These temperatures and depths are at the low-cost end of the EGS supply curve and would be some of the first developed. The ReEDS model uses the full EGS supply curve. Neither of these technologies is typically used.
Resource Potential
The enhanced geothermal system (EGS) resource is concentrated in the western United States. The total potential is greater than 100,000 MW: 1,493 MW of near-hydrothermal field EGS (NF-EGS) and the remaining potential comes from deep EGS.
Renewable energy technical potential as defined by Lopez et al. (2012) represents the achievable energy generation of a particular technology given system performance, topographic limitations, environmental, and land-use constraints. The primary benefit of assessing technical potential is that it establishes an upper-boundary estimate of development potential. It is important to understand there are multiple types of potential-resource, technical, economic, and market (see NREL: "Renewable Energy Technical Potential").
Base Year and Future Year Projections Overview
The Base Year cost and performance estimates are calculated using the Geothermal Electricity Technology Evaluation Model (GETEM), a bottom-up cost analysis tool that accounts for each phase of development of a geothermal plant (DOE "Geothermal Electricity Technology Evaluation Model").
- Cost and performance data for EGS generation plants are estimated for each potential site using GETEM. Model results based on resource attributes (e.g., estimated reservoir temperature, depth, and potential) of each site. GETEM inputs are derived from the GeoVision BAU scenario ( (DOE, 2019), (Augustine, Ho, & Blair, 2019)).
- Approaches to restrict resource potential to about 500 GW based on USGS analysis may be implemented in the future.
- GETEM is used to estimate CAPEX and O&M and parasitic plant losses that affect net energy production.
Capacity factor and O&M costs for plants installed in future years are unchanged from the Base Year. Projections for hydrothermal and enhanced geothermal system technologies are equivalent.
- Constant Technology Cost Scenario: no change in CAPEX, O&M, or capacity factor from 2015 to 2050, consistent across all renewable energy technologies in the ATB
- Mid Technology Cost Scenario: CAPEX cost reduction based on assumed minimum learning as implemented in AEO (EIA, 2015): 10% by 2035; this corresponds to a 0.5% annual improvement in CAPEX, which is assumed to continue on through 2050.
- Low Technology Cost Scenario: CAPEX based on the GeoVision Technology Improvement scenario ( (DOE, 2019), (Augustine, Ho, & Blair, 2019)). Cost and technology improvements decrease linearly from present values and are fully achieved by 2030.
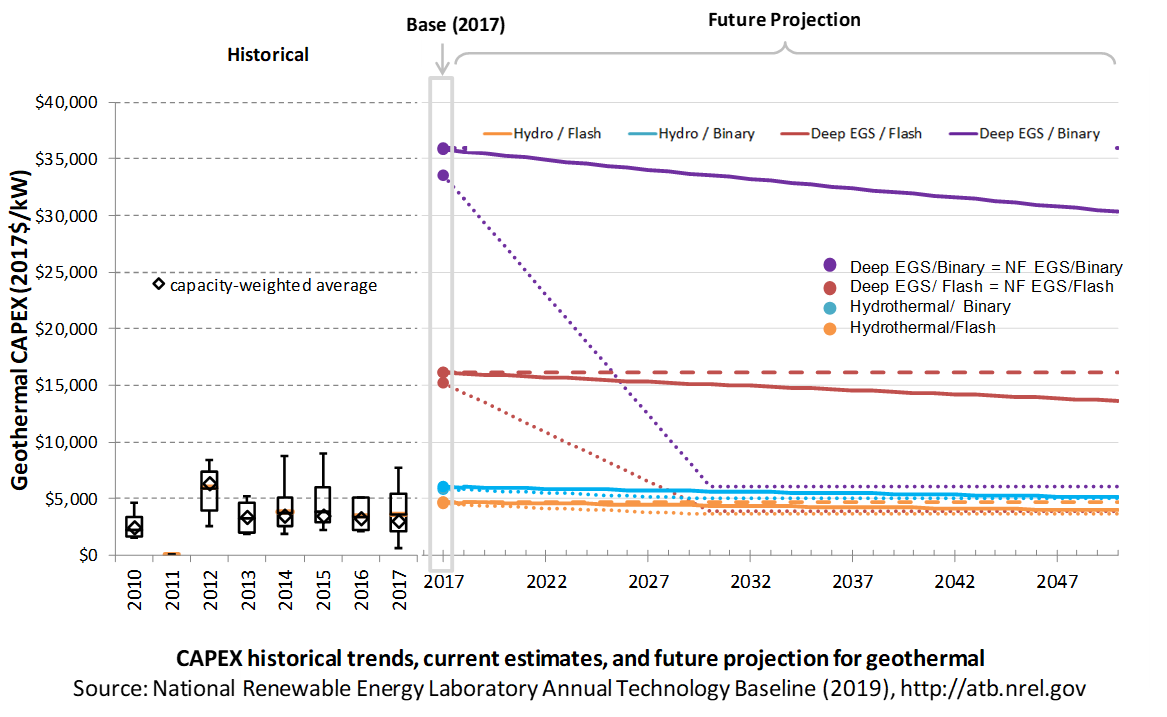
Capital expenditures (CAPEX) are expenditures required to achieve commercial operation in a given year. These expenditures include the geothermal generation plant, the balance of system (e.g., site preparation, installation, and electrical infrastructure), and financial costs (e.g., development costs, onsite electrical equipment, and interest during construction) and are detailed in CAPEX Definition. In the ATB, CAPEX reflects typical plants and does not include differences in regional costs associated with labor, materials, taxes, or system requirements. The related Standard Scenarios product uses Regional CAPEX Adjustments. The range of CAPEX demonstrates variation with resource in the contiguous United States.
The following figure shows the Base Year estimate and future year projections for CAPEX costs. Three cost scenarios are represented: Constant, Mid, and Low technology cost. The estimate for a given year represents CAPEX of a new plant that reaches commercial operation in that year.
Base Year Estimates
For illustration in the ATB, six representative geothermal plants are shown. Two energy conversion processes are common: binary organic Rankine cycle and flash.
- Binary plants use a heat exchanger to transfer geothermal energy to an organic Rankine cycle. This technology generally applies to lower-temperature systems. These systems have higher CAPEX than flash systems because of the increased number of components, their lower-temperature operation, and a general requirement that a number of wells be drilled for a given power output.
- Flash plants create steam directly from the thermal fluid through a pressure change. This technology generally applies to higher-temperature systems. Due to the reduced number of components and higher-temperature operation, these systems generally produce more power per well, thus reducing drilling costs. These systems generally have lower CAPEX than binary systems.
Examples using each of these plant types in each of the three resource types (hydrothermal, NF-EGS, and deep EGS) are shown in the ATB.
Costs are for new or greenfield hydrothermal projects, not for re-drilling or additional development/capacity additions at an existing site.
Characteristics for the six examples of plants representing current technology were developed based on discussion with industry stakeholders. The CAPEX estimates were generated using GETEM. CAPEX for NF-EGS and EGS are equivalent.
The following table shows the range of OCC associated with the resource characteristics for potential sites throughout the United States.
| Temp (°C) | >=200C | 150-200 | 135-150 | <135 | |
| Hydrothermal | Number of identified sites | 21 | 23 | 17 | 59 |
| Total capacity (MW) | 15,338 | 2,991 | 820 | 4,632 | |
| Average OCC ($/kW) | 3,906 | 7,720 | 8,794 | 16,248 | |
| Min OCC ($/kW) | 3,000 | 4,140 | 7,004 | 10,950 | |
| Max OCC ($/kW) | 5,491 | 29,135 | 11,027 | 21,349 | |
| Example of plant OCC ($/kW) | 4,229 | 5,455 | |||
| NF-EGS | Number of sites | 12 | 20 | ||
| Total capacity (MW) | 787 | 596 | |||
| Average OCC ($/kW) | 11,041 | 26,077 | |||
| Min OCC ($/kW) | 8,778 | 18,172 | |||
| Max OCC ($/kW) | 18,009 | 39,987 | |||
| Example of plant OCC ($/kW) | 14,512 | 32,268 | |||
| Deep EGS (3-6 km) | Number of sites | n/a | n/a | ||
| Total capacity (MW) | 100,000+ | ||||
| Average OCC ($/kW) | 28,418 | 60,170 | |||
| Min OCC ($/kW) | 18,320 | 39,329 | |||
| Max OCC ($/kW) | 54,047 | 77,983 | |||
| Example of plant OCC ($/kW) | 14,512 | 32,268 | |||
Future Year Projections
Projection of future geothermal plant CAPEX for the Low case is based on the GeoVision Technology Improvement scenario (DOE, 2019).
A detailed description of the methodology for developing future year projections is found in Projections Methodology.
Technology innovations that could impact future O&M costs are summarized in LCOE Projections.
References
The following references are specific to this page; for all references in this ATB, see References.Augustine, Chad, Ho, J., & Blair, N. (2019). GeoVision Analysis Supporting Task Force Report: Electric Sector Potential to Penetration (No. NREL/ TP-6A20-71833). Retrieved from National Renewable Energy Laboratory website: https://www.nrel.gov/docs/fy19osti/71833.pdf
Augustine, Chad. (2016). Updates to Enhanced Geothermal System Resource Potential Estimate. GRC Transactions, 40, 673–677. Retrieved from http://pubs.geothermal-library.org/lib/grc/1032382.pdf
DOE. (2019). GeoVision: Harnessing the Heat Beneath Our Feet (No. DOE/EE-1306). Retrieved from U.S. Department of Energy website: https://www.energy.gov/eere/geothermal/geovision
EIA. (2015). Annual Energy Outlook 2015 with Projections to 2040 (No. AEO2015). Retrieved from U.S. Energy Information Administration website: https://www.eia.gov/outlooks/aeo/pdf/0383(2015).pdf
Lopez, A., Roberts, B., Heimiller, D., Blair, N., & Porro, G. (2012). U.S. Renewable Energy Technical Potentials: A GIS-Based Analysis (Technical Report No. NREL/TP-6A20-51946). https://doi.org/10.2172/1219777
Mines, G. (2013, April). Geothermal Electricity Technology Evaluation Model (GETEM). Presented at the Geothermal Technologies Office 2013 Peer Review, Washington, D.C. Retrieved from https://energy.gov/sites/prod/files/2014/02/f7/mines_getem_peer2013.pdf
Roberts, B. J. (2009). Geothermal Resource of the United States: Locations of Identified Hydrothermal Sites and Favorability of Deep Enhanced Geothermal Systems (EGS). Retrieved from https://www.nrel.gov/gis/images/geothermal_resource2009-final.jpg
Tester, J. W., & et al. (2006). The Future of Geothermal Energy: Impact of Enhanced Geothermal Systems (EGS) on the United States in the 21st Century. Cambridge, MA: Massachusetts Institute of Technology.
USGS. (2008). Assessment of Moderate- and High-Temperature Geothermal Resources of the United States (No. Fact Sheet 2008-3082). Retrieved from U.S. Geological Survey website: https://pubs.usgs.gov/fs/2008/3082/pdf/fs2008-3082.pdf