
Offshore Wind
Representative Technology
In 2016, the first offshore wind plant (30 MW) commenced commercial operation in the United States near Block Island (Rhode Island). In 2018, Vineyard Wind LLC and Massachusetts electric distribution companies submitted a 20-year power purchase agreement (PPA) for 800 MW of offshore wind generation and renewable energy certificates to the Massachusetts Department of Public Utilities for review and approval. In the ATB, cost and performance estimates are made for commercial-scale projects with 600 MW in capacity. The ATB Base Year offshore wind plant technology reflects a machine rating of 6 MW with a rotor diameter of 155 m and hub height of 100 m, which is typical of European projects installed in 2016 and 2017 and the turbine rating installed at the Block Island Wind Farm (GE Haliade 150-6MW).
Resource Potential
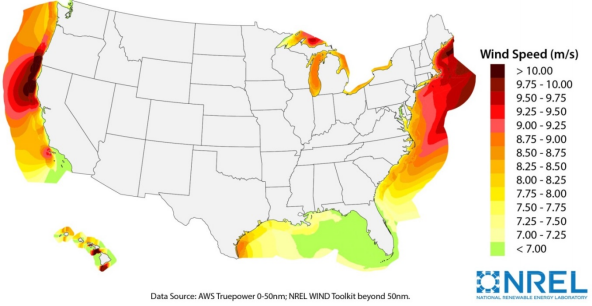
Wind resource is prevalent throughout major U.S. coastal areas, including the Great Lakes. The resource potential exceeds 2,000 GW, excluding Alaska, based on domain boundaries from 50 nautical miles (nm) to 200 nm, turbine hub heights of 100 m (previously 90 m), and a capacity array power density of 3 MW/km2(Walt Musial et al. 2016). A range of technology exclusions were applied based on maximum water depth for deployment, minimum wind speed, and limits to floating technology in freshwater surface ice. Resource potential was represented by more than 7,000 areas for offshore wind plant deployment after accounting for competing use and environmental exclusions, such as marine protected areas, shipping lanes, pipelines, and others.
Base Year and Future Year Projections Overview
Based on a resource assessment (Walt Musial et al. 2016), LCOE was estimated at more than 7,000 areas (with a total capacity of approximately 2,000 GW). Using an updated version of NREL's Offshore Regional Cost Analyzer (ORCA) (Beiter et al. 2016), a variety of spatial parameters were considered, such as wind speeds, water depth, distance from shore, distance to ports, and wave height. CAPEX, O&M, and capacity factor are calculated for each geographic location using engineering models, hourly wind resource profiles, and representative sea states. ORCA was calibrated to the latest cost and technology trends observed in the U.S. and European offshore wind markets, including:
- Turbine CAPEX: $1,300/kW were assumed for the Base Year to account for decreases in Turbine CAPEX that were observed in global offshore wind markets.
- Turbine Rating: A turbine technology trend of 6 MW (Base Year), 8 MW (2022 commercial operation date [COD]), 10 MW (2027 COD), and 10 MW (2032 COD) was assumed to correspond to recent technology trends. While higher turbine ratings may be commercially available during this period (e.g., up to 15-MW turbine ratings are expected to be commercially available by the early 2030s), the selected turbine ratings are intended to reflect the average turbine rating of the operating U.S. offshore wind fleet.
- Export System Cable Costs: A reduction of 25% in comparison to an earlier version of ORCA (Beiter et al. 2016) was assumed for the Base Year to account for increased competition within the supply chain in recent years and for changes in material use and commodity prices.
- Cost Reduction Trajectory: Recent literature was surveyed to identify the most up-to-date cost reduction trends expected for U.S. and European offshore wind projects; the version of ORCA used to estimate cost reduction trajectories are derived from Valpy et al. (2017)(fixed bottom) and Hundleby et al. (2017)(floating).
- Contingency Levels: A markup of 25% above of European contingency levels was assumed to account for the higher risk of installing and operating early offshore wind farms in the United States.
- Lease Area Price: This cost to projects was included to account for the recent increase in the tendered U.S. lease area prices.
The spatial LCOE assessment served as the basis for estimating the ATB baseline LCOE in the Base Year 2017, weighted by the available capacity, for fixed-bottom and floating offshore wind technology. Only sites that exceed a distance to cable landfall of 20 kilometers (km) and a water depth of 10 meters (m) were included in the spatial assessment for the ATB to represent those sites only that are likely to be developed in the near-to-medium term. Long-term average hourly wind profiles are assumed and estimated LCOE reflects the least-cost choice among four substructure types (Beiter et al. 2016):
- Monopile (fixed-bottom)
- Jacket (fixed-bottom)
- Semi-submersible (floating)
- Spar (floating).
The representative offshore wind plant size is assumed to be 600 MW (Beiter et al. 2016). For illustration in the ATB, the full resource potential, represented by 7,000 areas, was divided into 15 techno-resource groups (TRGs), of which TRGs 1-5 are representative of fixed-bottom wind technology and TRGs 6-15 are representative of floating offshore wind technology. The capacity-weighted average CAPEX, O&M, grid connection costs, and capacity factor for each group are presented in the ATB.
For illustration in the ATB, all potential offshore wind plant areas were represented in 15 TRGs with TRGs 1-5 representing fixed-bottom offshore technology and TRGs 6-15 representing floating offshore wind technology. These were defined by resource potential (GW) and have higher resolution on the least-cost TRGs, as these are the most likely sites to be deployed, based on their economics. The following table summarizes the capacity-weighted average water depth, distance to cable landfall, and cost and performance parameters for each TRG. The table includes the relative resource potential. Typical offshore wind installations in 2017 that have spatial and economic conditions that may lend themselves well to near-term deployment are associated with TRG 3.
TRG Definitions for Offshore Wind
| TRG | Weighted Water Depth (m) | Weighted Distance Site to Cable Landfall (km) | Weighted Average CAPEX ($/kW) | Weighted Average OPEX ($/kW/yr) | Weighted Average Net CF (%) | Potential Wind Plant Capacity of Fixed-Bottom/Floating Total (%) | |
| Fixed-Bottom | TRG 1 | 18 | 27 | 3,361 | 105 | 45 | 2 |
| TRG 2 | 22 | 29 | 3,475 | 106 | 44 | 3 | |
| TRG 3 | 24 | 33 | 3,660 | 109 | 44 | 7 | |
| TRG 4 | 29 | 57 | 4,001 | 112 | 41 | 44 | |
| TRG 5 | 31 | 65 | 4,633 | 107 | 30 | 44 | |
| Floating | TRG 6 | 144 | 38 | 4,602 | 77 | 52 | 1 |
| TRG 7 | 159 | 45 | 4,661 | 78 | 51 | 2 | |
| TRG 8 | 157 | 46 | 4,710 | 78 | 49 | 4 | |
| TRG 9 | 148 | 64 | 4,936 | 84 | 49 | 8 | |
| TRG 10 | 107 | 101 | 5,209 | 91 | 47 | 15 | |
| TRG 11 | 375 | 116 | 5,320 | 98 | 43 | 15 | |
| TRG 12 | 467 | 116 | 5,331 | 97 | 36 | 15 | |
| TRG 13 | 663 | 166 | 5,785 | 92 | 34 | 15 | |
| TRG 14 | 432 | 147 | 6,145 | 87 | 30 | 15 | |
| TRG 15 | 468 | 133 | 6,599 | 83 | 28 | 11 | |
Future year projections for CAPEX, O&M, and capacity factor in the "Mid Technology Cost" Scenario are derived from the estimated cost reduction potential for offshore wind technologies based on assessments by BVG Associates ((Valpy et al. 2017), (Hundleby et al. 2017)) for 2017-2032. Based on the modeled data between 2017-2032, an (exponential) trend fit is derived for CAPEX, O&M in the "Mid Technology Cost" Scenario, and capacity factor to extrapolate ATB data for years 2033-2050. The specific scenarios are:
- Constant Technology Cost Scenario: no change in CAPEX, O&M, or capacity factor from 2015 to 2050; consistent across all renewable energy technologies in the ATB.
- Mid Technology Cost Scenario: LCOE percentage reduction estimated from BVG ((Valpy et al. 2017), (Hundleby et al. 2017)) from the Base Year, which is intended to correspond to a 50% probability of exceedance.
- Low Technology Cost Scenario: LCOE deviation from the Mid Technology Cost Scenario in CAPEX, O&M, or capacity factor from 2017 to 2050 informed by analysts' bottom-up technology and cost modeling. This scenario is intended to correspond to a 10%-30% probability of exceedance.
References
The following references are specific to this page; for all references in this ATB, see References.Beiter, P., Musial, W., Smith, A., Kilcher, L., Damiani, R., Maness, M., … Scott, G. (2016). A Spatial-Economic Cost-Reduction Pathway Analysis for U.S. Offshore Wind Energy Development from 2015-2030 (Technical Report No. NREL/TP-6A20-66579). https://doi.org/10.2172/1324526
Hundleby, G., Freeman, K., Logan, A., & Frost, C. (2017). Floating Offshore: 55 Technology Innovations that will have greater impact on reducing the cost of electricity from European floating offshore wind farms. Retrieved from KiC InnoEnergy and BVG Associates website.
Musial, Walt, Heimiller, D., Beiter, P., Scott, G., & Draxl, C. (2016). 2016 Offshore Wind Energy Resource Assessment for the United States (No. NREL/TP-5000-66599). https://doi.org/10.2172/1324533
Valpy, B., Hundleby, G., Freeman, K., Roberts, A., & Logan, A. (2017). Future renewable energy costs: Offshore wind. Retrieved from KiC InnoEnergy and BVG Associates website: http://www.innoenergy.com/wp-content/uploads/2014/09/InnoEnergy-Offshore-Wind-anticipated-innovations-impact-2017_A4.pdf