
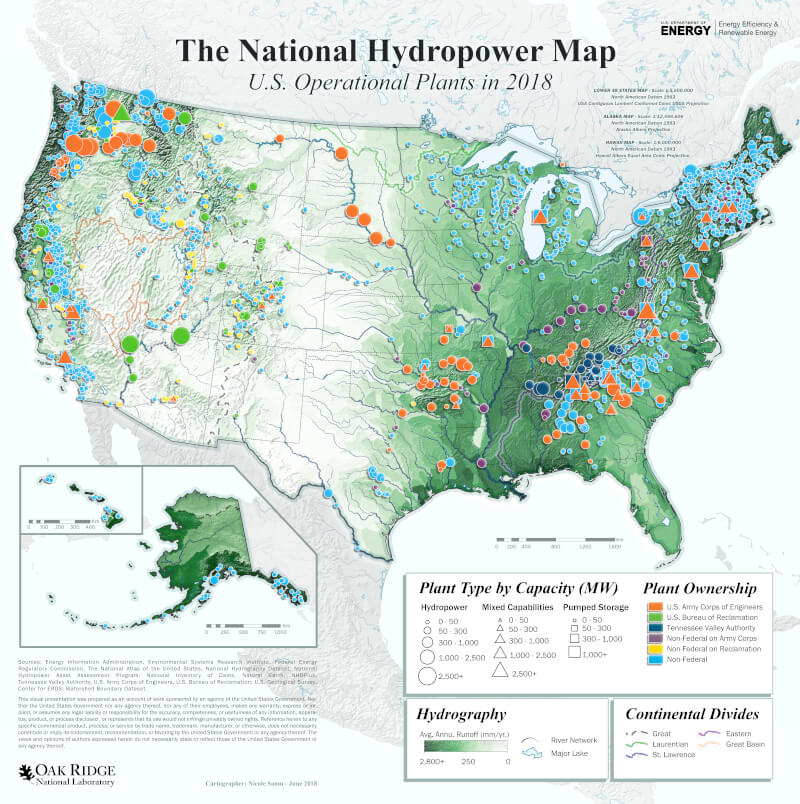
Hydropower
Renewable energy technical potential, as defined by Lopez et al. (2012) , represents the achievable energy generation of a particular technology given system performance, topographic limitations, and environmental and land-use constraints. The primary benefit of assessing technical potential is that it establishes an upper-boundary estimate of development potential. It is important to understand that there are multiple types of potential-resource, technical, economic, and market (see NREL: "Renewable Energy Technical Potential").
Note: Pumped-storage hydropower is considered a storage technology in the ATB and will be addressed in future years. It and other storage technologies are represented in Standard Scenarios Model Results from the ReEDS model, and battery storage technologies are shown in the associated portion of the ATB.
Representative Technology
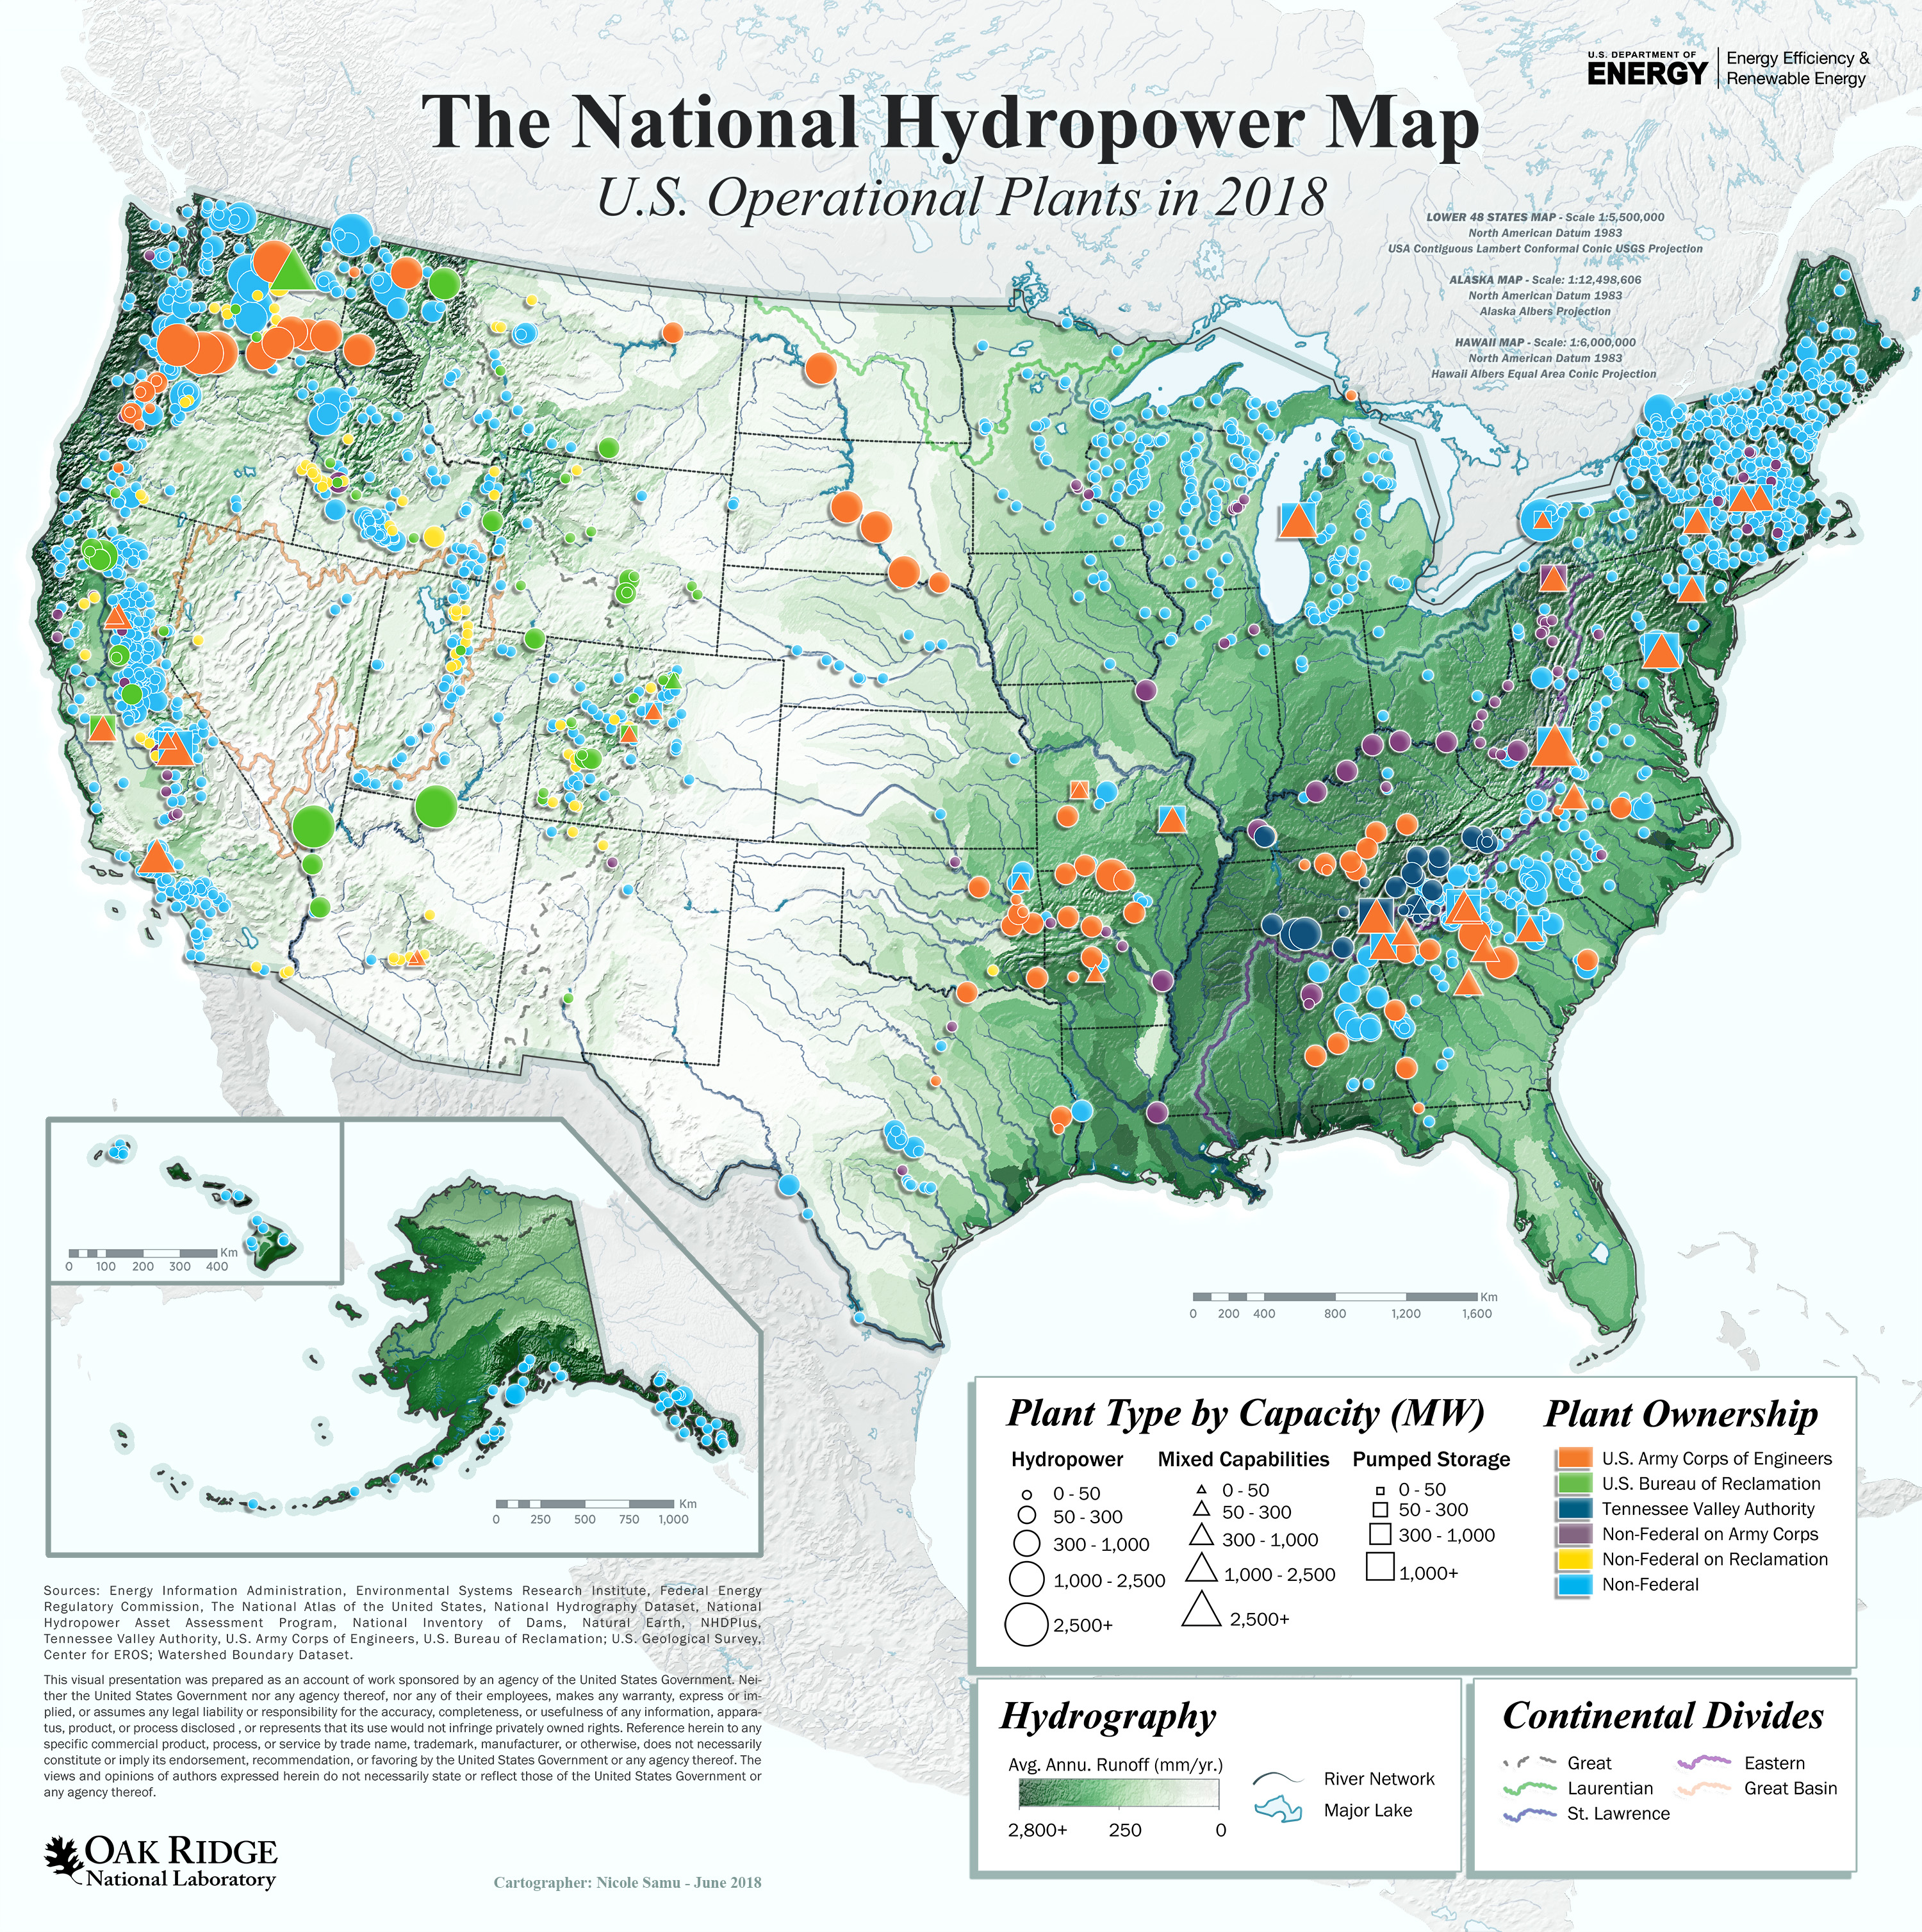
Hydropower technologies have produced electricity in the United States for over a century. Many of these infrastructure investments have potential to continue providing electricity in the future through upgrades of existing facilities (DOE, 2016) . At individual facilities, investments can be made to improve the efficiency of existing generating units through overhauls, generator rewinds, or turbine replacements. Such investments are known collectively as "upgrades," and they are reflected as increases to plant capacity. As plants reach a license renewal period, upgrades to existing facilities to increase capacity or energy output are typically considered. While the smallest projects in the United States can be as small as 10-100 kW, the bulk of upgrade potential is from large, multi-megawatt facilities.
Resource Potential
The estimated total upgrade potential of 6.9 GW/24 terawattt-hours (TWh) (at about 1,800 facilities) is based on generalizable information drawn from a series of case studies or owner-specific assessments (DOE, 2016) . Information available to inform the representation of improvements to the existing fleet includes:
- A systematic, full-fleet assessment of expansion potential at Reclamation projects performed under the Reclamation Hydropower Modernization Initiative (see U.S. Bureau of Reclamation, "Hydropower Resource Assessment at Existing Reclamation Facilities")
- Case study reports from the U.S. Army Corps of Engineers (Corps) performed under its Hydropower Modernization Initiative (MWH, Watson, & Harza, 2009)
- Case study reports combining assessments of upgrade and unit and plant optimization potential from the U.S. Department of Energy/Oak Ridge National Laboratory Hydropower Advancement Project.
Base Year and Future Year Projections Overview
Upgrades are often among the lowest-cost new capacity resource, with the modeled costs for individual projects ranging from $800/kW to nearly $20,000/kW. This differential results from significant economies of scale from project size, wherein larger capacity plants are less expensive to upgrade on a dollar-per-kilowatt basis than smaller projects are. The average cost of the upgrade resource is approximately $1,500/kW.
CAPEX for each existing facility is based on direct estimates
The capacity factor is based on actual 10-year average energy production reported in EIA 923 forms. Some hydropower facilities lack flexibility and only produce electricity when river flows are adequate. Others with storage capabilities are operated to meet a balance between electric system, reservoir management, and environmental needs using their dispatch capability.
No future cost and performance projections for hydropower upgrades are assumed.
Upgrade cost and performance are not illustrated in this documentation of the ATB for the sake of simplicity.
Standard Scenarios Model Results
ATB CAPEX, O&M, and capacity factor assumptions for the Base Year and future projections through 2050 for Constant, Mid, and Low technology cost scenarios are used to develop the NREL Standard Scenarios using the ReEDS model. See ATB and Standard Scenarios.
Upgrade potential becomes available in the ReEDS model at the relicensing date, end of plant life (50 years), or both.

Representative Technology
Non-powered dams (NPD) are classified by energy potential in terms of head. Low head facilities have design heads below 20 m and typically exhibit the following characteristics (DOE, 2016) :
- 1 MW to 10 MW
- New/rehabilitated intake structure
- Little, if any, new penstock
- Axial-flow or Kaplan turbines (2-4 units)
- New powerhouse (indoor)
- New/rehabilitated tailrace
- Minimal new transmission (< 5 miles, if required)
- Capacity factor of 35% to 60%.
High head facilities have design heads above 20 m and typically exhibit the following characteristics (DOE, 2016) :
- 5 MW to 30 MW
- New/rehabilitated intake structure
- New penstock (typically < 500 feet of steel penstock, if required)
- Francis turbines (1-3 units)
- New powerhouse (indoor)
- New/rehabilitated tailrace
- Minimal new transmission line (up to 15 MW, if required)
- Capacity factor of 35% to 60%.
Resource Potential
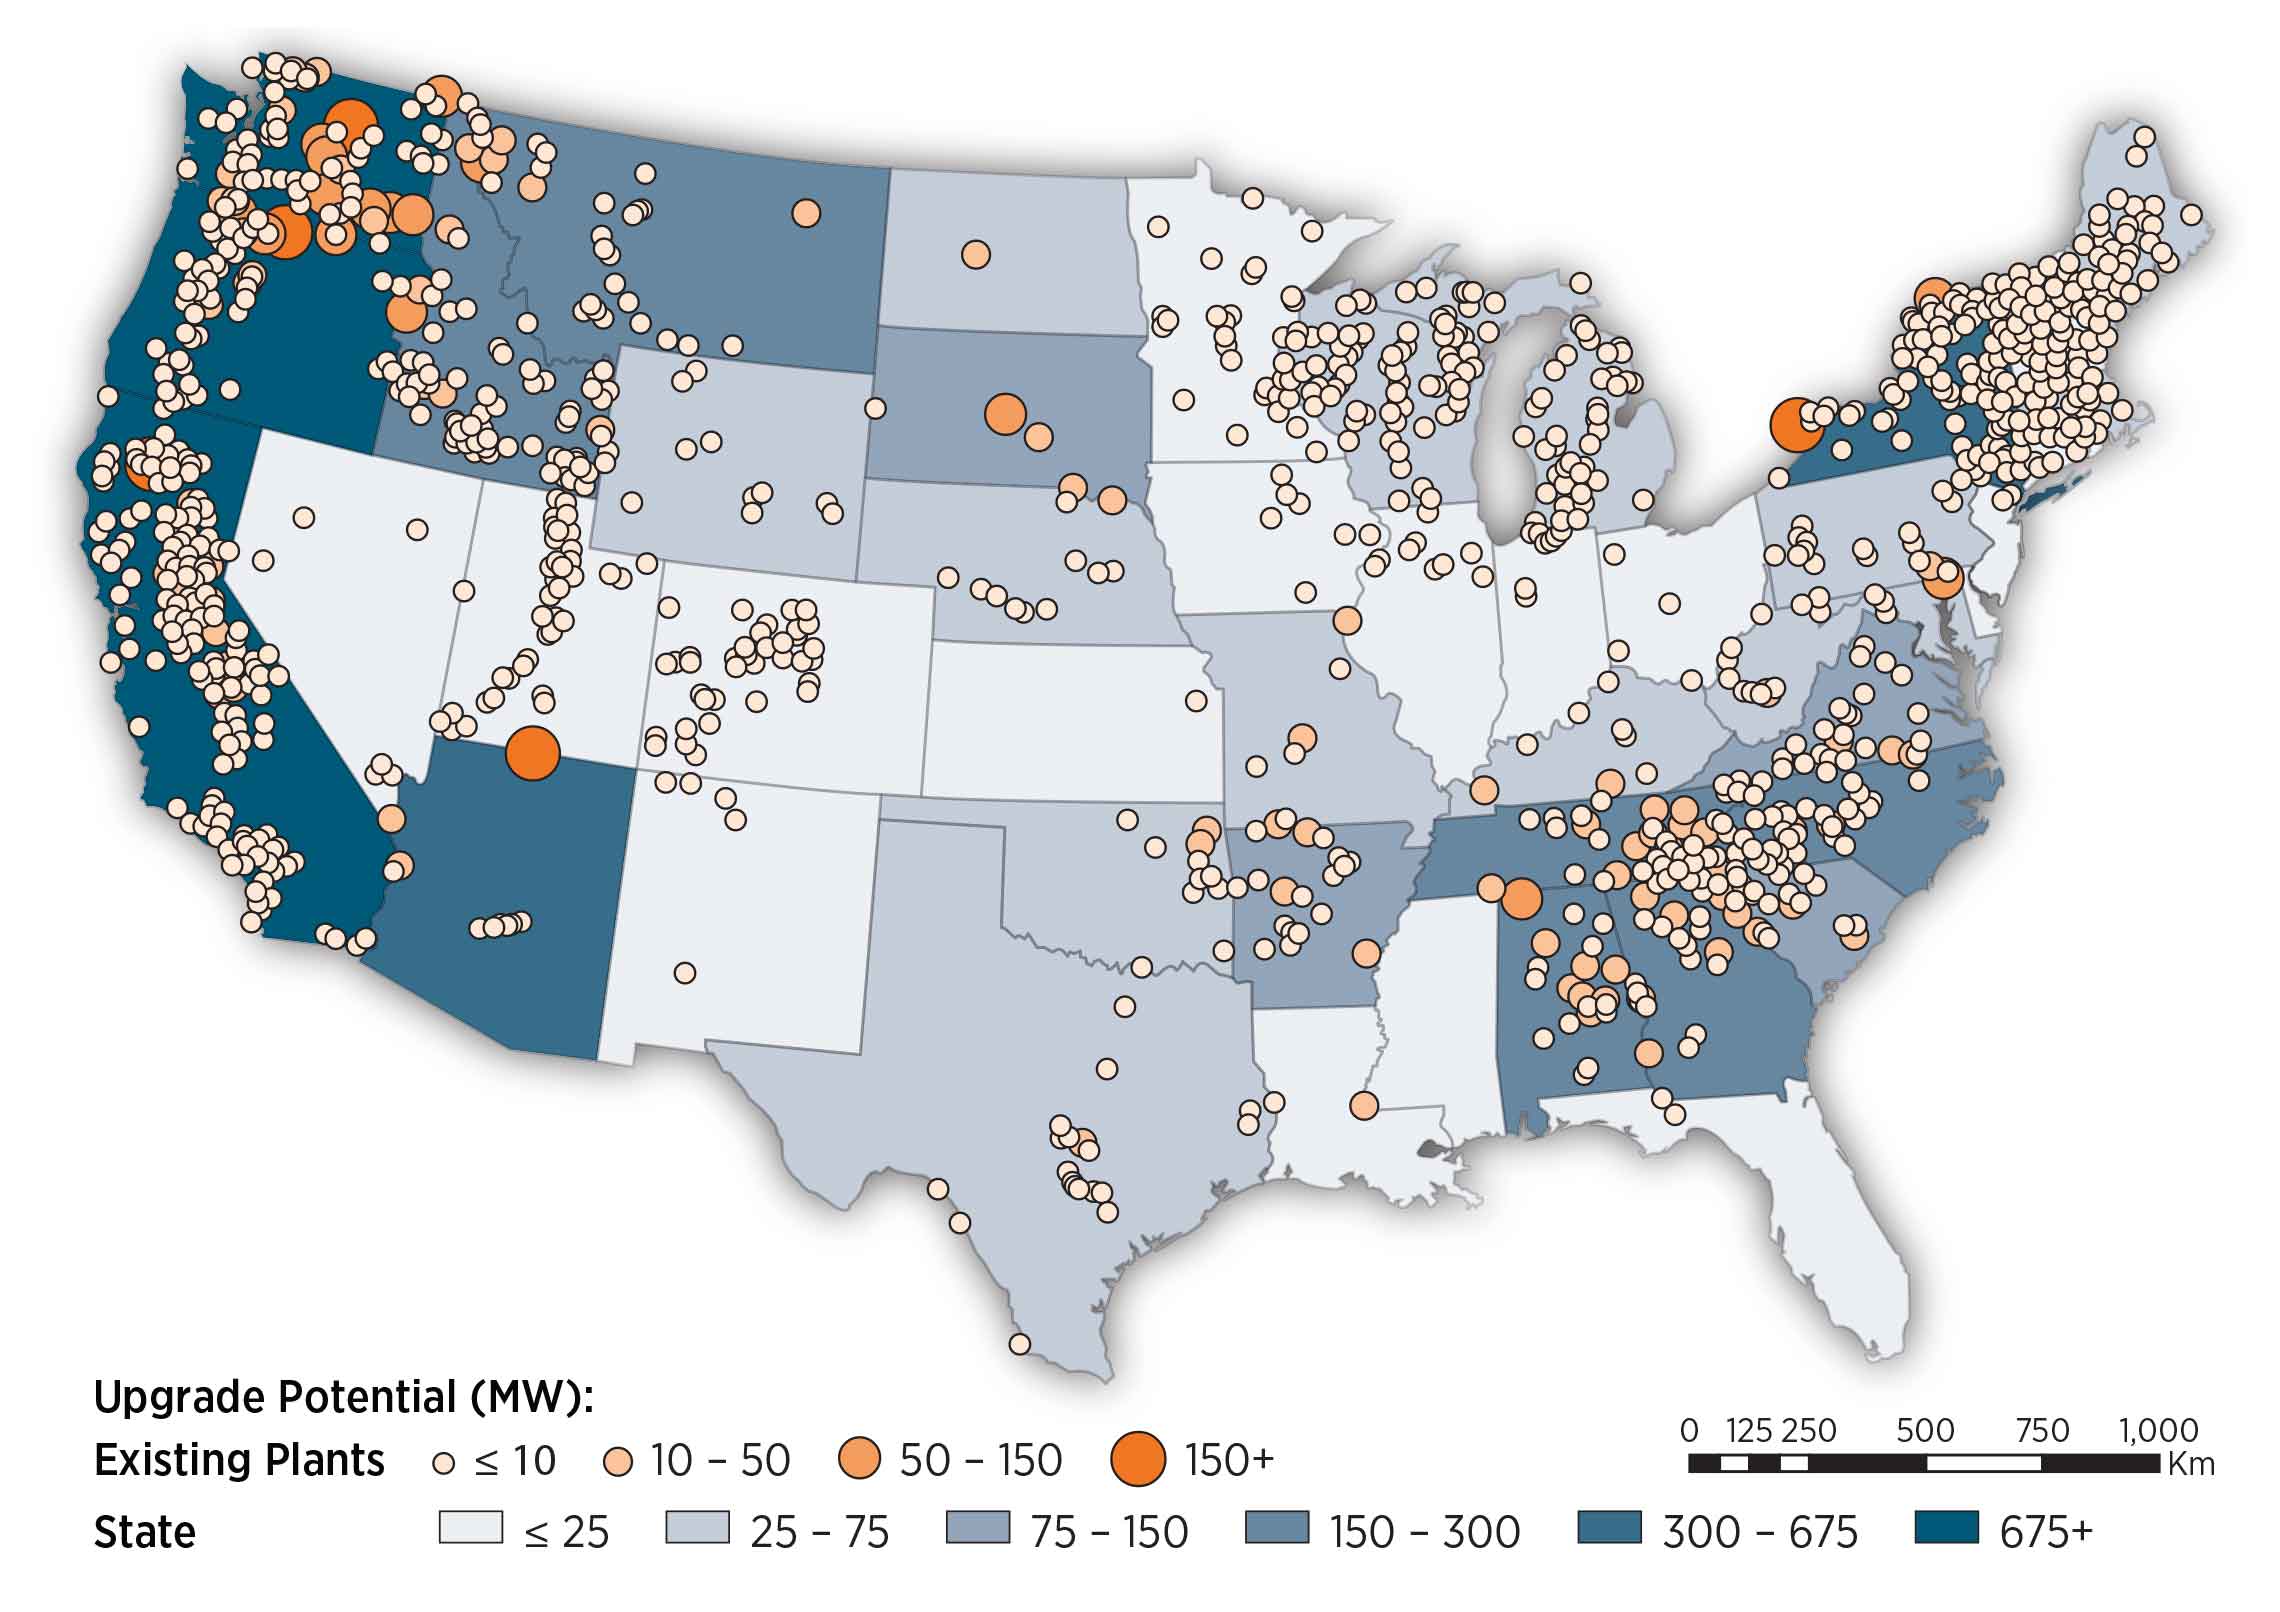
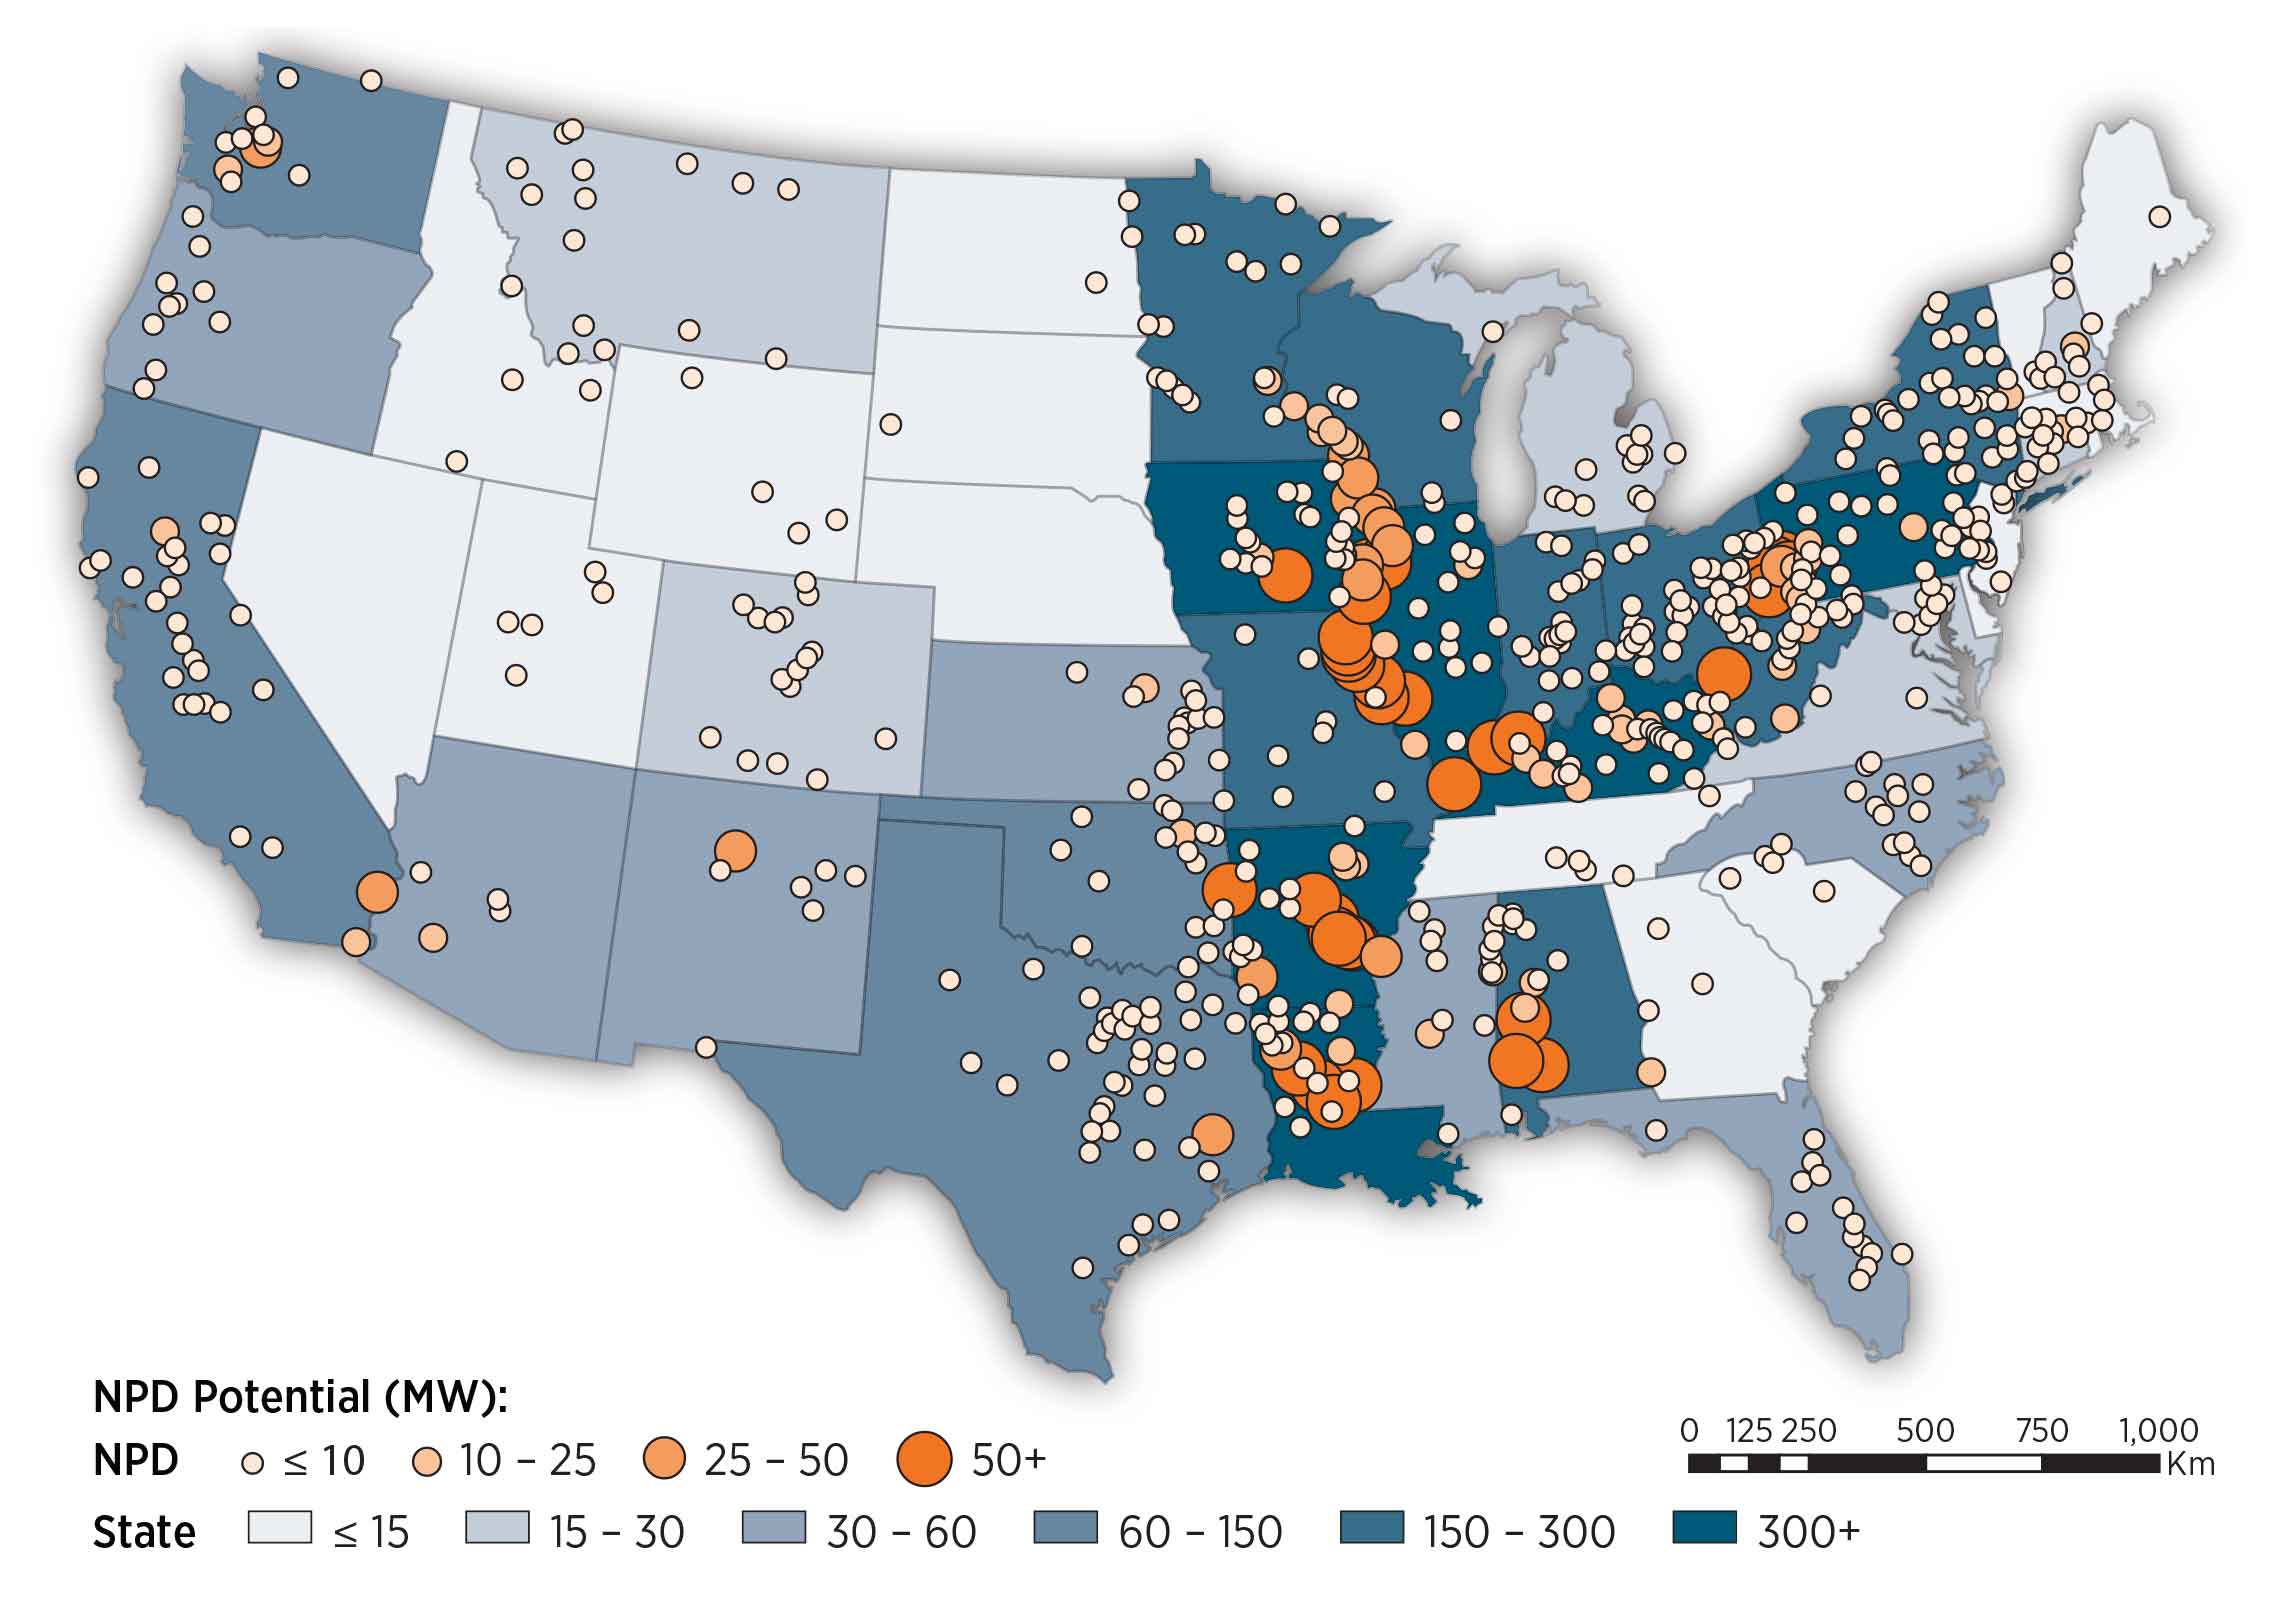
Up to 12 GW of technical potential exists to add power to U.S. NPD. However, based on financial decisions in recent development activity, the economic potential of NPD may be approximately 5.6 GW at more than 54,000 dams in the contiguous United States. Most of this potential (5 GW or 90% of resource capacity) is associated with less than 700 dams. These resource considerations are discussed below:
According to the National
Inventory of Dams, more than 80,000 dams exist that do not produce
power. This data set was filtered to remove dams with erroneous flow
and geographic data and dams whose data could not be resolved to a
satisfactory level of detail
A new methodology for sizing potential hydropower facilities that was developed for the new-stream reach development resource (Kao et al., 2014) was applied to non-powered dams. This resource potential was estimated to be 5.6 GW at more than 54,000 dams. In the development of the Hydropower Vision, the NPD resource available to the ReEDS model was adjusted based on recent development activity and limited to only those projects with power potential of 500 kW or more. As the ATB uses the Hydropower Vision supply curves, this results in a final resource potential of 5 GW/29 TWh from 671 dams.
For each facility, a design capacity, average monthly flow rate over a 30-year period, and a design flow rate exceedance level of 30% are assumed. The exceedance level represents the fraction of time that the design flow is exceeded. This parameter can be varied and results in different capacity and energy generation for a given site. The value of 30% was chosen based on industry rules of thumb. The capacity factor for a given facility is determined by these design criteria.
Design capacity and flow rate dictate capacity and energy generation potential. All facilities are assumed sized for 30% exceedance of flow rate based on long-term, average monthly flow rates.
Base Year and Future Year Projections Overview
Site-specific CAPEX, O&M, and capacity factor estimates are made
for each site in the available resource potential. CAPEX and O&M
estimates are made based on statistical analysis of historical plant
data from 1980 to 2015
Projections developed for the Hydropower Vision study (DOE, 2016) using technological learning assumptions and bottom-up analysis of process and/or technology improvements provide a range of future cost outcomes. Three different projections were developed for scenario modeling as bounding levels:
- Constant Technology Cost Scenario: no change in CAPEX, O&M, or capacity factor from 2017 to 2050; consistent across all renewable energy technologies in the ATB
- Mid Technology Cost Scenario: incremental technology learning, consistent with Reference in Hydropower Vision (DOE, 2016); CAPEX reductions for new stream-reach development (NSD) only
- Low cost: gains that are achievable when pushing to the limits of potential new technologies, such as modularity (in both civil structures and power train design), advanced manufacturing techniques, and materials, consistent with Advanced Technology in Hydropower Vision (DOE, 2016); both CAPEX and O&M cost reductions implemented.
Standard Scenarios Model Results
ATB CAPEX, O&M, and capacity factor assumptions for the Base Year and future projections through 2050 for Constant, Mid, and Low technology cost scenarios are used to develop the NREL Standard Scenarios using the ReEDS model. See ATB and Standard Scenarios.
The ReEDS model includes a sensitivity scenario that restricts the resource potential to sites greater than 500 kW, consistent with the Hydropower Vision, which results in 5 GW/29 TWh at 671 dams.
Representative Technology
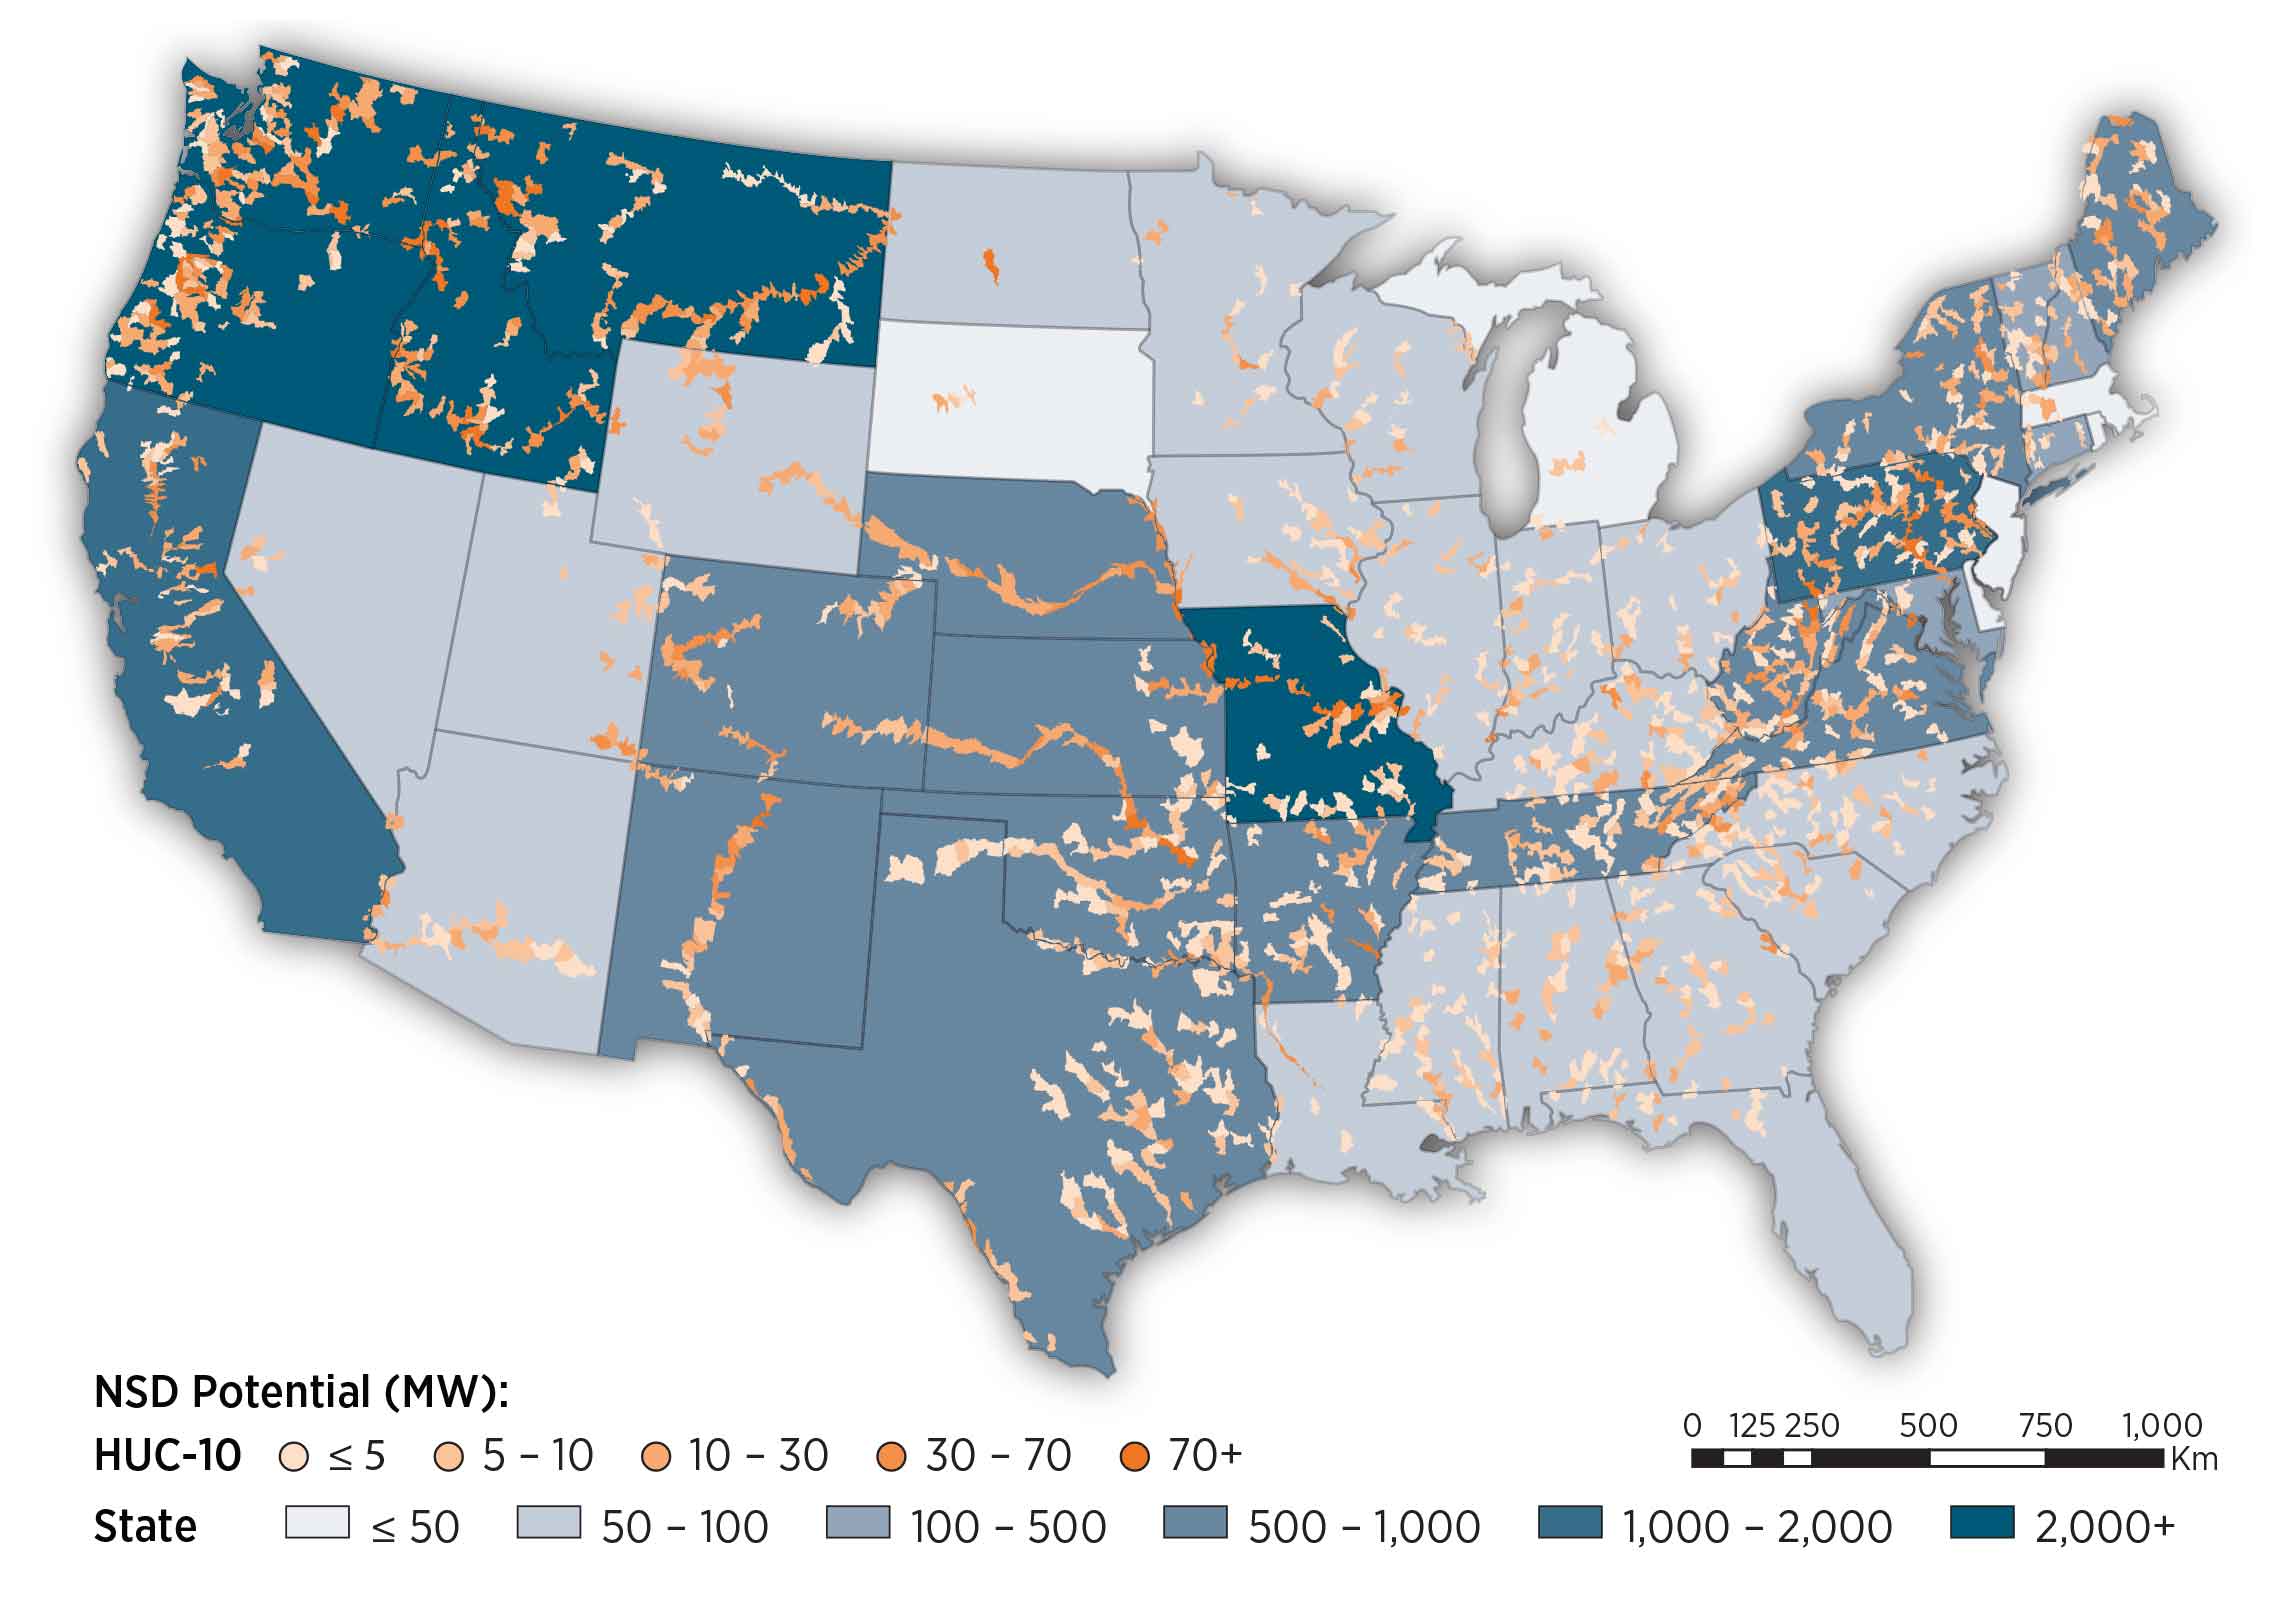
Greenfield or new stream-reach development (NSD) sites are defined as new hydropower developments along previously undeveloped waterways and typically exhibit the following characteristics (DOE, 2016) :
- 1 MW to 100 MW
- New diversion/intake structure
- New penstock
- Steel with length being head/terrain dependent
- Various turbine selections
- Impulse/Francis are common for recently completed projects
- New powerhouse (indoor)
- New tailrace
- New transmission line (up to 15 miles for new projects)
- 30% to 80% capacity factor.
Resource Potential
The resource potential is estimated to be 53.2 GW/301 TWh at nearly 230,000 individual sites (Kao et al., 2014) after accounting for locations statutorily excluded from hydropower development such as national parks, wild and scenic rivers, and wilderness areas.
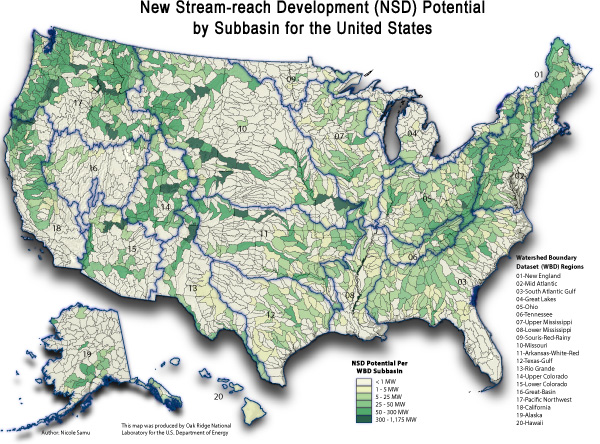
About 8,500 stream reaches were evaluated to assess resource potential (i.e., capacity) and energy generation potential (i.e., capacity factor). For each stream reach, a design capacity, average monthly flow rate over a 30-year period, and design flow rate exceedance level of 30% are assumed. The exceedance level represents the fraction of time that the design flow is exceeded. This parameter can be varied and results in different capacity and energy generation for a given site. The value of 30% was chosen based on industry rules of thumb. The capacity factor for a given facility is determined by these design criteria. Plant sizes range from kilowatt-scale to multi-megawatt scale (Kao et al., 2014) .
The resource assessment approach is designed to minimize the footprint of a hydropower facility by restricting inundation area to the Federal Emergency Management Agency (FEMA) 100-year floodplain.
New hydropower facilities are assumed to apply run-of-river operation strategies. Run-of-river operation means the flow rate into a reservoir is equal to the flow rate out of the facility. These facilities do not have dispatch capability.
Design capacity and flow rate dictate capacity and energy generation potential. All facilities are assumed sized for 30% exceedance of flow rate based on long-term, average monthly flow rates.
Base Year and Future Year Projections Overview
Site-specific CAPEX, O&M, and capacity factor estimates are made
for each site in the available resource potential. CAPEX and O&M
estimates are made based on statistical analysis of historical plant
data from 1980 to 2015
Projections developed for the Hydropower Vision study (DOE, 2016) using technological learning assumptions and bottom-up analysis of process and/or technology improvements provide a range of future cost outcomes. Three different projections were developed for scenario modeling as bounding levels:
- Constant Technology Cost Scenario: no change in CAPEX, O&M, or capacity factor from 2017 to 2050; consistent across all renewable energy technologies in the ATB
- Mid Technology Cost Scenario: incremental technology learning, consistent with Reference in Hydropower Vision (DOE, 2016); CAPEX reductions for NSD only
- Low Technology Cost Scenario: gains that are achievable
when pushing to the limits of potential new technologies, such as
modularity (in both civil structures and power train design), advanced
manufacturing techniques, and materials, consistent with Advanced
Technology in Hydropower Vision
(DOE, 2016) ; both CAPEX and O&M cost reductions implemented.
Standard Scenarios Model Results
ATB CAPEX, O&M, and capacity factor assumptions for the Base Year and future projections through 2050 for Constant, Mid, and Low technology cost scenarios are used to develop the NREL Standard Scenarios using the ReEDS model. See ATB and Standard Scenarios.
The ReEDS model includes a sensitivity scenario that restricts the resource potential to sites greater than 1 MW, which results in 30.1 GW/176 TWh on nearly 8,000 reaches.
References
The following references are specific to this page; for all references in this ATB, see References.DOE. (2016). Hydropower Vision: A New Chapter for America's Renewable Electricity Source (No. DOE/GO-102016-4869). Retrieved from U.S. Department of Energy website: https://www.energy.gov/sites/prod/files/2018/02/f49/Hydropower-Vision-021518.pdf
Kao, S.-C., McManamay, R. A., Stewart, K. M., Samu, N. M., Hadjerioua, B., DeNeale, S. T., … Smith, B. T. (2014). New Stream-Reach Development: A Comprehensive Assessment of Hydropower Energy Potential in the United States (No. ORNL/TM-2013/514). https://doi.org/10.2172/1130425
Lopez, A., Roberts, B., Heimiller, D., Blair, N., & Porro, G. (2012). U.S. Renewable Energy Technical Potentials: A GIS-Based Analysis (Technical Report No. NREL/TP-6A20-51946). https://doi.org/10.2172/1219777
MWH. (2009). Hydropower Modernization Initiative, Phase I, Needs and Opportunities Evaluation and Ranking (No. Contract No. W9127N-08-D-0003. Task Order 001.). Montgomery Watson Harza.