
Utility-Scale PV
Representative Technology
Utility-scale PV systems in the ATB are representative of one-axis tracking systems with performance and pricing characteristics in line with a 1.3 DC-to-AC ratio-or inverter loading ratio (ILR) (Fu, Feldman, and Margolis 2018). PV system performance characteristics in previous ATB versions were designed in the ReEDS model at a time when PV system ILRs were lower than they are in current system designs; performance and pricing in the 2019 ATB incorporates more up-to-date system designs and therefore assumes a higher ILR.
Resource Potential
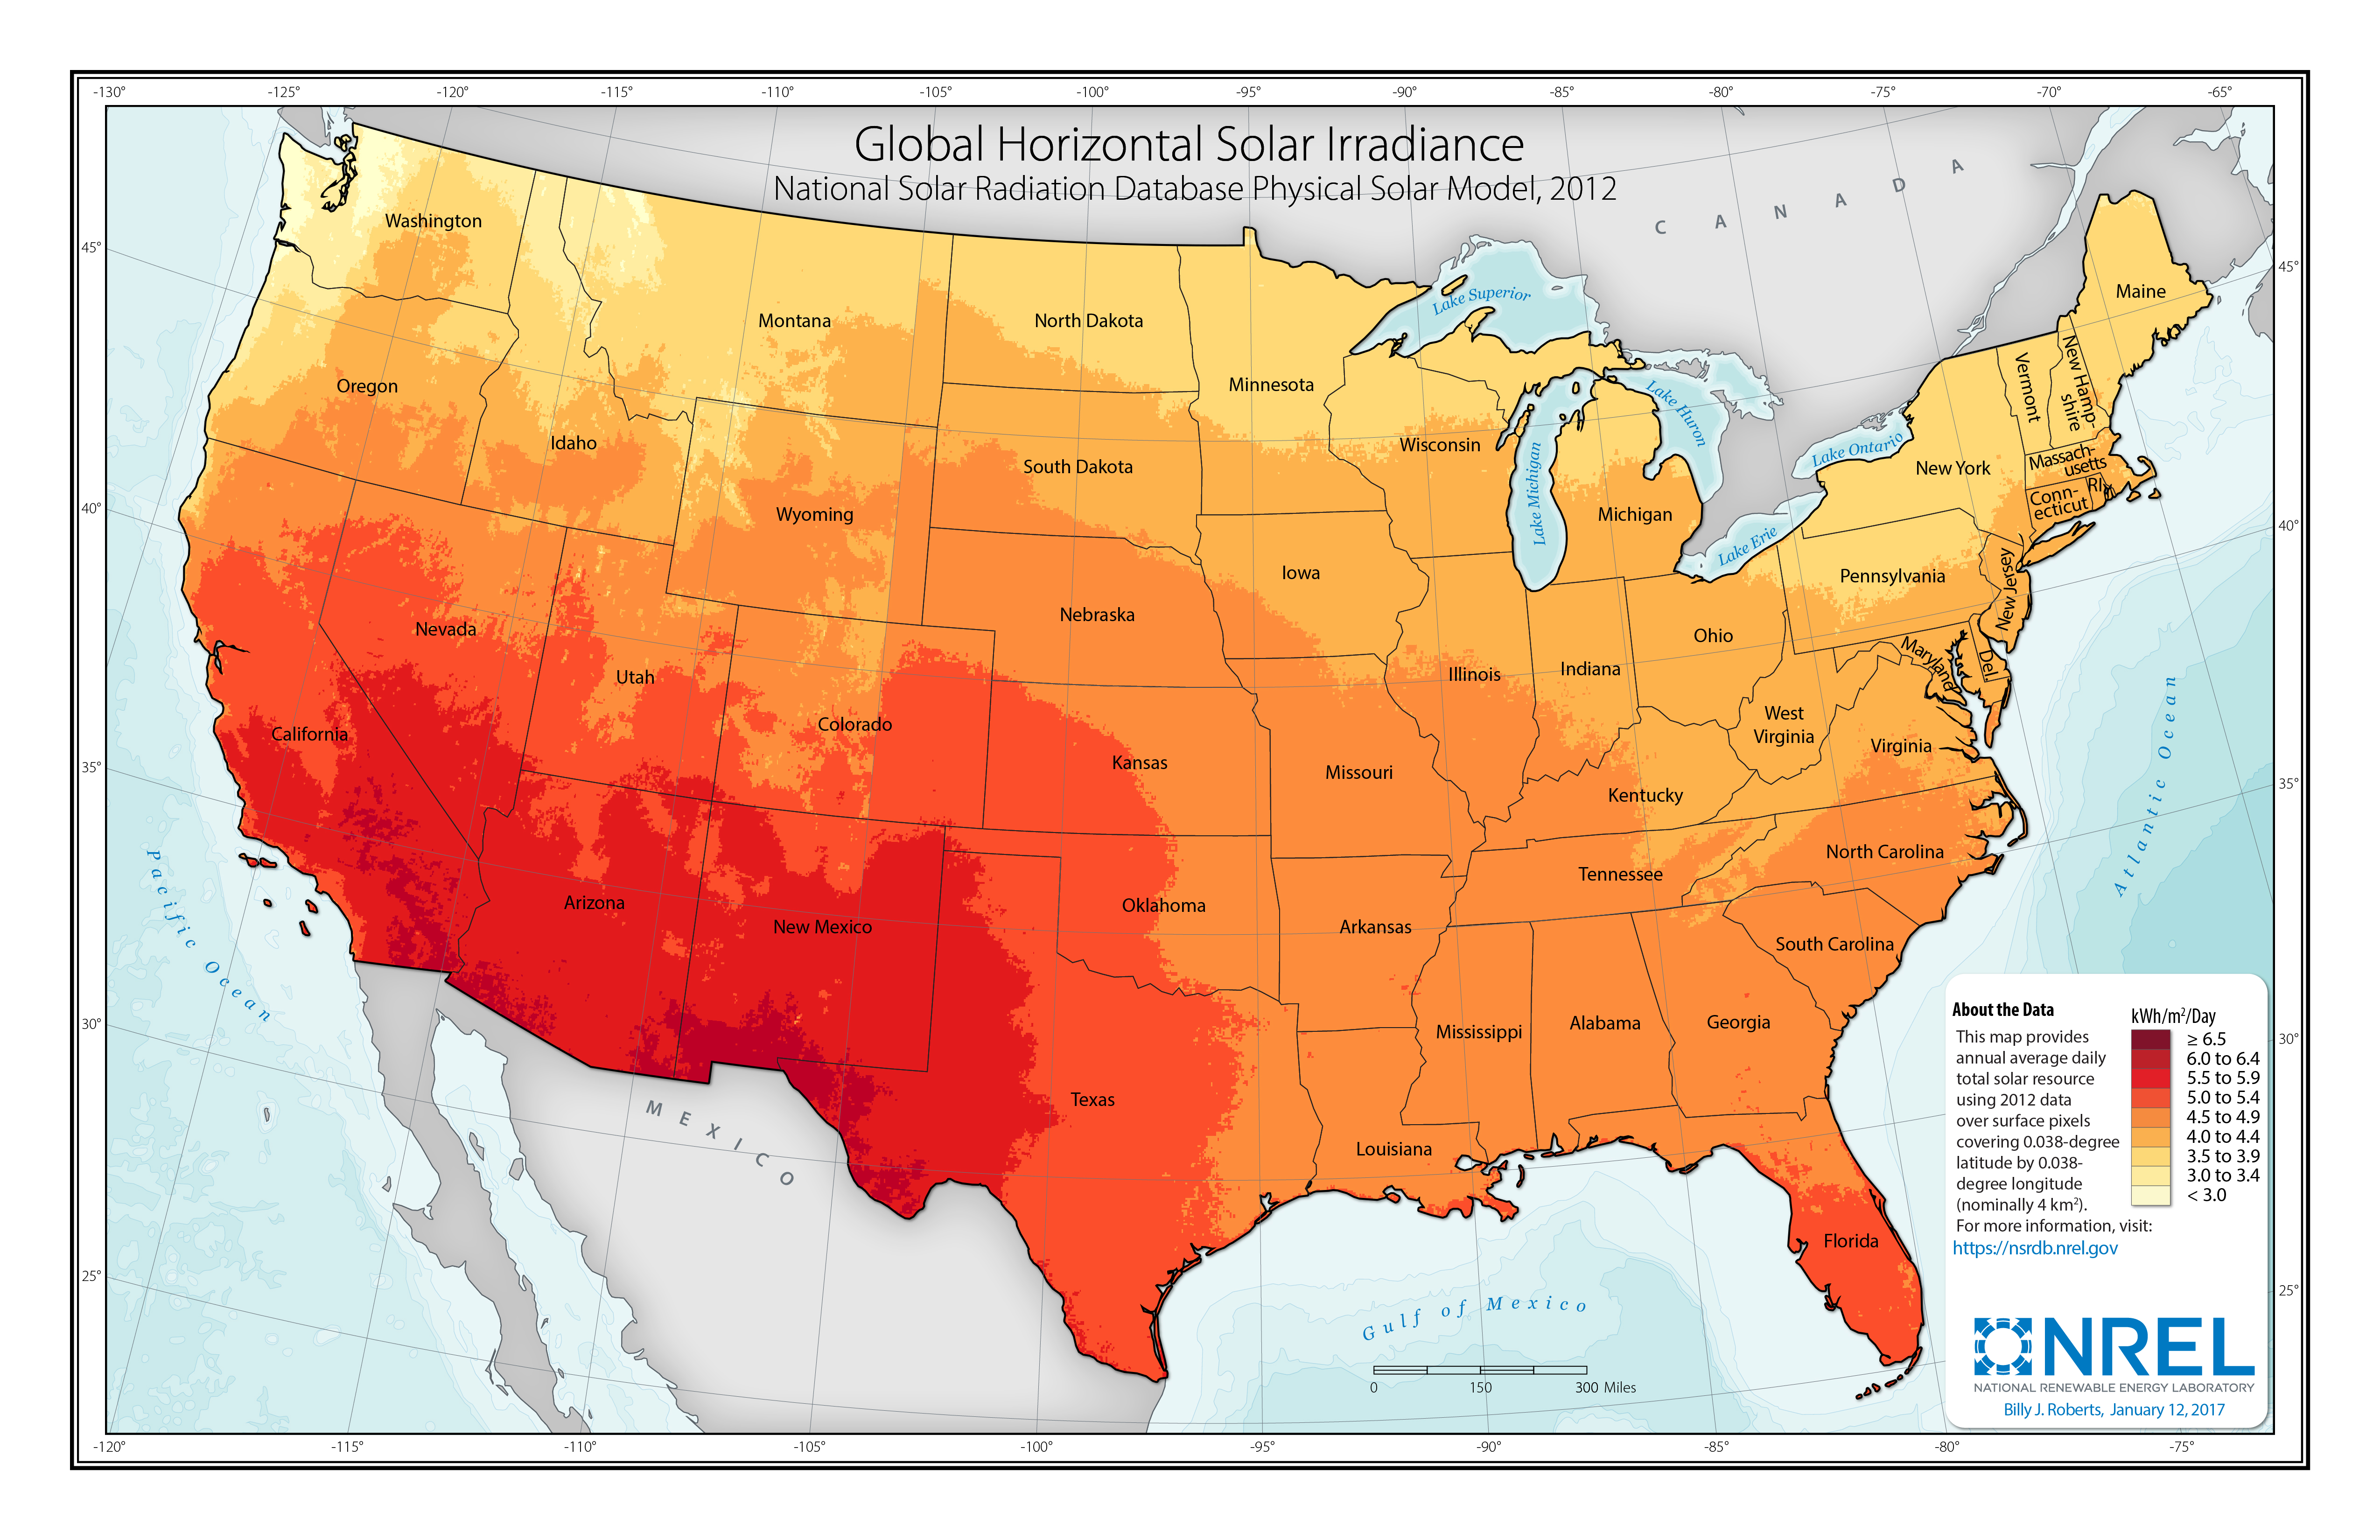
Solar resources across the United States are mostly good to excellent at about 1,000-2,500 kWh/m2/year. The Southwest is at the top of this range, while Alaska and part of Washington are at the low end. The range for the contiguous United States is about 1,350-2,500 kWh/m2/year. Nationwide, solar resource levels vary by about a factor of two.
The total U.S. land area suitable for PV is significant and will not limit PV deployment. One estimate (Denholm and Margolis 2008) suggests the land area required to supply all end-use electricity in the United States using PV is about 5,500,000 hectares (ha) (13,600,000 acres), which is equivalent to 0.6% of the country's land area or about 22% of the "urban area" footprint (this calculation is based on deployment/land in all 50 states).
Renewable energy technical potential, as defined by Lopez et al. (2012), represents the achievable energy generation of a particular technology given system performance, topographic limitations, and environmental and land-use constraints. The primary benefit of assessing technical potential is that it establishes an upper-boundary estimate of development potential. It is important to understand that there are multiple types of potential – resource, technical, economic, and market (see NREL: "Renewable Energy Technical Potential").
Base Year and Future Year Projections Overview
The Base Year estimates rely on modeled CAPEX and O&M estimates benchmarked with industry and historical data. Capacity factor is estimated based on hours of sunlight at latitude for five representative geographic locations in the United States. The ATB presents capacity factor estimates that encompass a range associated with Low, Mid, and Constant technology cost scenarios across the United States.
Future year projections are derived from analysis of published projections of PV CAPEX and bottom-up engineering analysis of O&M costs. Three different projections were developed for scenario modeling as bounding levels:
- Constant Technology Cost Scenario: no change in CAPEX, O&M, or capacity factor from 2017 to 2050; consistent across all renewable energy technologies in the ATB
- Mid Technology Cost Scenario: based on the median of literature projections of future CAPEX; O&M technology pathway analysis
- Low Technology Cost Scenario: based on the low bound of literature projections of future CAPEX and O&M technology pathway analysis.
References
The following references are specific to this page; for all references in this ATB, see References.Denholm, P., & Margolis, R. M. (2008). Land-Use Requirements and the Per-Capita Solar Footprint for Photovoltaic Generation in the United States. Energy Policy, 36(9), 3531–3543. https://doi.org/10.1016/j.enpol.2008.05.035
Fu, R., Feldman, D., & Margolis, R. (2018). U.S. Solar Photovoltaic System Cost Benchmark: Q1 2018. https://doi.org/10.2172/1484344
Lopez, A., Roberts, B., Heimiller, D., Blair, N., & Porro, G. (2012). U.S. Renewable Energy Technical Potentials: A GIS-Based Analysis (Technical Report No. NREL/TP-6A20-51946). https://doi.org/10.2172/1219777