Annual Technology Baseline 2018
National Renewable Energy Laboratory
Recommended Citation:
NREL (National Renewable Energy Laboratory). 2018. 2018 Annual Technology Baseline. Golden, CO: National Renewable Energy Laboratory. http://atb.nrel.gov/.
Please consult Guidelines for Using ATB Data:
https://atb.nrel.gov/electricity/user-guidance.html
Hydropower
CAPital EXpenditures (CAPEX): Historical Trends, Current Estimates, and Future Projections
Capital expenditures (CAPEX) are expenditures required to achieve commercial operation in a given year. These expenditures include the hydropower generation plant, the balance of system (e.g., site preparation, installation, and electrical infrastructure), and financial costs (e.g., development costs, onsite electrical equipment, and interest during construction) and are detailed in CAPEX Definition. In the ATB, CAPEX reflects typical plants and does not include differences in regional costs associated with labor, materials, taxes, or system requirements. The related Standard Scenarios product uses regional CAPEX adjustments. The range of CAPEX demonstrates variation with resource in the contiguous United States.
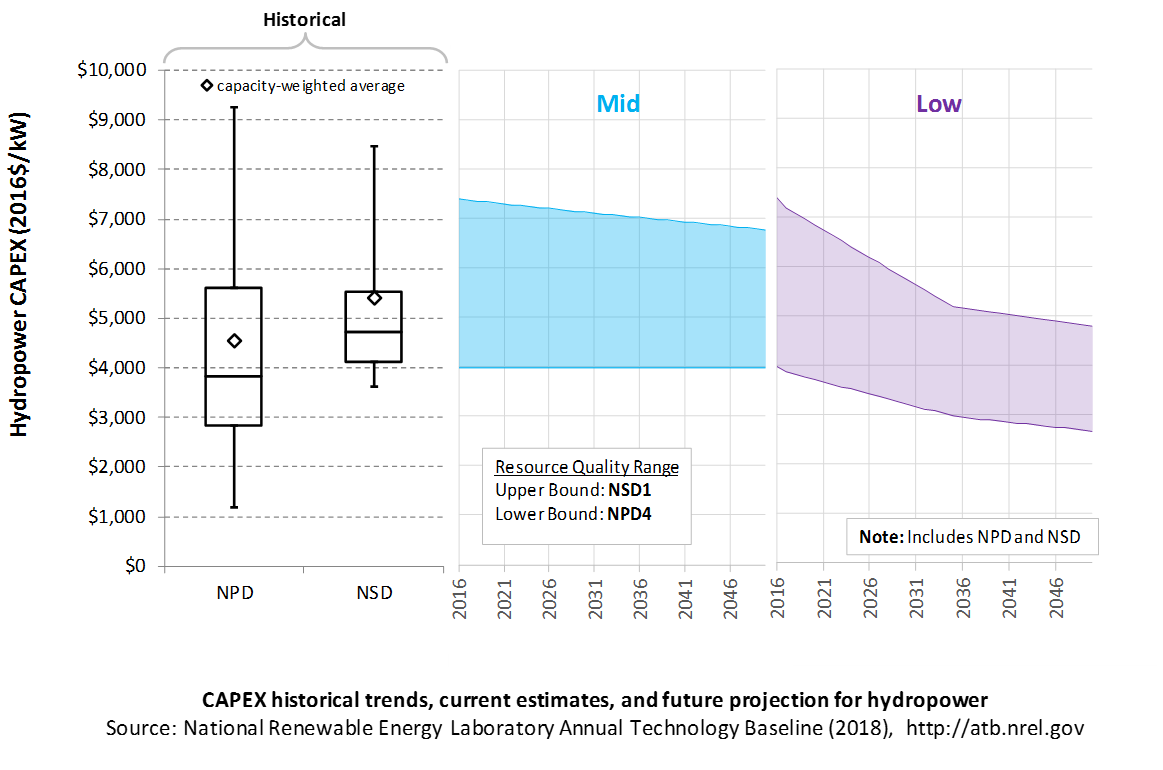
The following figure shows the Base Year estimate and future year projections for CAPEX costs. Three cost scenarios are represented: Constant, Mid, and Low technology cost. Historical data from actual and proposed non-powered dam (NPD) and new stream-reach development (NSD) plants installed in the United States from 1981 to 2014 are shown for comparison to the ATB Base Year. The estimate for a given year represents CAPEX of a new plant that reaches commercial operation in that year.
Recent Trends
Actual and proposed NPD and NSD CAPEX from 1981 to 2014 (from O'Connor et al. (2015a)) are shown in box-and-whiskers format for comparison to the ATB current CAPEX estimates and future projections.
The higher-cost ATB sites generally reflect small-capacity, low head sites that are not comparable to the historical data sample's generally larger-capacity and higher head facilities. These characteristics lead to higher ATB Base Year CAPEX estimates than past data suggest. For example, the NSD projects that became commercially operational in this period are dominated by a few high head projects in the mountains of the Pacific Northwest or Alaska.
The Base Year estimates of CAPEX for NPDs in the ATB range from $3,800/kW to $6,000/kW. These estimates reflect facilities with 3 feet of head to over 60 feet of head and from 0.5 MW to more than 30 MW of capacity. In general, the higher-cost sites reflect much smaller-capacity (< 10 MW), lower head (< 30 ft.) sites that have fewer analogues in the historical data, but these characteristics result in higher CAPEX.
The Base Year estimates of CAPEX for NSD range from $5,500/kW to $7,900/kW. The estimates reflect potential sites with 3 feet of head to over 60 feet head and from 1 MW to more than 30 MW of capacity. In general, NSD potential represents smaller-capacity facilities with lower head than most historical data represent. These characteristics lead to higher CAPEX estimates than past data suggest, as many of the larger, higher head sites in the United States have been previously developed.
Base Year Estimates
For illustration in the ATB, all potential NPD and NSD sites were first binned by both head and capacity. Analysis of these bins provided groupings that represent the most realistic conditions for future hydropower deployment. The design values of these four reference NPD and four reference NSD plants are shown below. The full range of resource and design characteristics is summarized in the ATB data spreadsheet.
Representative Hydropower Plants
| Resource Characteristics Ranges | Weighted Average Values | Calculated Plant Values | |||||
|---|---|---|---|---|---|---|---|
| Plants | Head (feet) | Capacity (MW) | Head (feet) | Capacity (MW) | Capacity Factor | ICC (2014$/kW) | O&M (2014$/kW) |
| NPD 1 | 3-30 | 0.5-10 | 15.4 | 4.8 | 0.62 | 5,969.33 | 111.73 |
| NPD 2 | 3-30 | 10+ | 15.9 | 82.2 | 0.64 | 5,433.24 | 30.74 |
| NPD 3 | 30+ | 0.5-10 | 89.6 | 4.2 | 0.60 | 3,997.79 | 118.67 |
| NPD 4 | 30+ | 10+ | 81.3 | 44.7 | 0.60 | 3,769.22 | 40.54 |
| NSD 1 | 3-30 | 1-10 | 15.7 | 3.7 | 0.66 | 7,034.81 | 125.01 |
| NSD 2 | 3-30 | 10+ | 19.6 | 44.1 | 0.66 | 6,280.15 | 40.76 |
| NSD 3 | 30+ | 1-10 | 46.8 | 4.3 | 0.62 | 6,151.05 | 117.61 |
| NSD 4 | 30+ | 10+ | 45.3 | 94.0 | 0.66 | 5,537.34 | 28.93 |
The reference plants shown above were developed using the average characteristics (weighted by capacity) of the resource plants within each set of ranges. For example, NPD 1 is constructed from the capacity-weighted average values of NPD sites with 3-330 feet of head and 0.5-30 MW of capacity.
The weighted-average values were used as input to the cost formulas (O'Connor et al. (2015a)) in order to calculate site CAPEX and O&M costs.
CAPEX for each plant is based on statistical analysis of historical plant data from 1980 to 2015 as a function of key design parameters, plant capacity, and hydraulic head (O'Connor et al. (2015a)).
Where P is capacity in megawatts, and H is head in feet. The first term represents the initial capital costs, while the second represents licensing.
Future Projections
Projections developed for the Hydropower Vision study (DOE (2016)) using technological learning assumptions and bottom-up analysis of process and/or technology improvements provide a range of future cost outcomes. Three different CAPEX projections were developed for scenario modeling as bounding levels:
- Constant Technology Cost Scenario:
- NPD and NSD CAPEX unchanged from the Base Year; consistent across all renewable energy technologies in the ATB
- Mid Technology Cost Scenario: consistent with Reference in Hydropower Vision:
- NSD CAPEX reduced 5% in 2035 and 8.6% in 2050
- NPD CAPEX unchanged from the Base Year
- Low Technology Cost Scenario: consistent with Advanced Technology in Hydropower Vision:
- Low head NPD/All NSD CAPEX reduced 30% in 2035 and 35.3% in 2050. Low Head NPD is NPD-1 and NPD-2
- High head NPD CAPEX reduced 25% in 2035 and 32.7% in 2050; High Head NPD is NPD-3 and NPD-4
A detailed description of the methodology for developing future year projections is found in Projections Methodology.
Technology innovations that could impact future O&M costs are summarized in LCOE Projections.
Standard Scenarios Model Results
ATB CAPEX, O&M, and capacity factor assumptions for the Base Year and future projections through 2050 for Constant, Mid, and Low technology cost scenarios are used to develop the NREL Standard Scenarios using the ReEDS model. See ATB and Standard Scenarios.
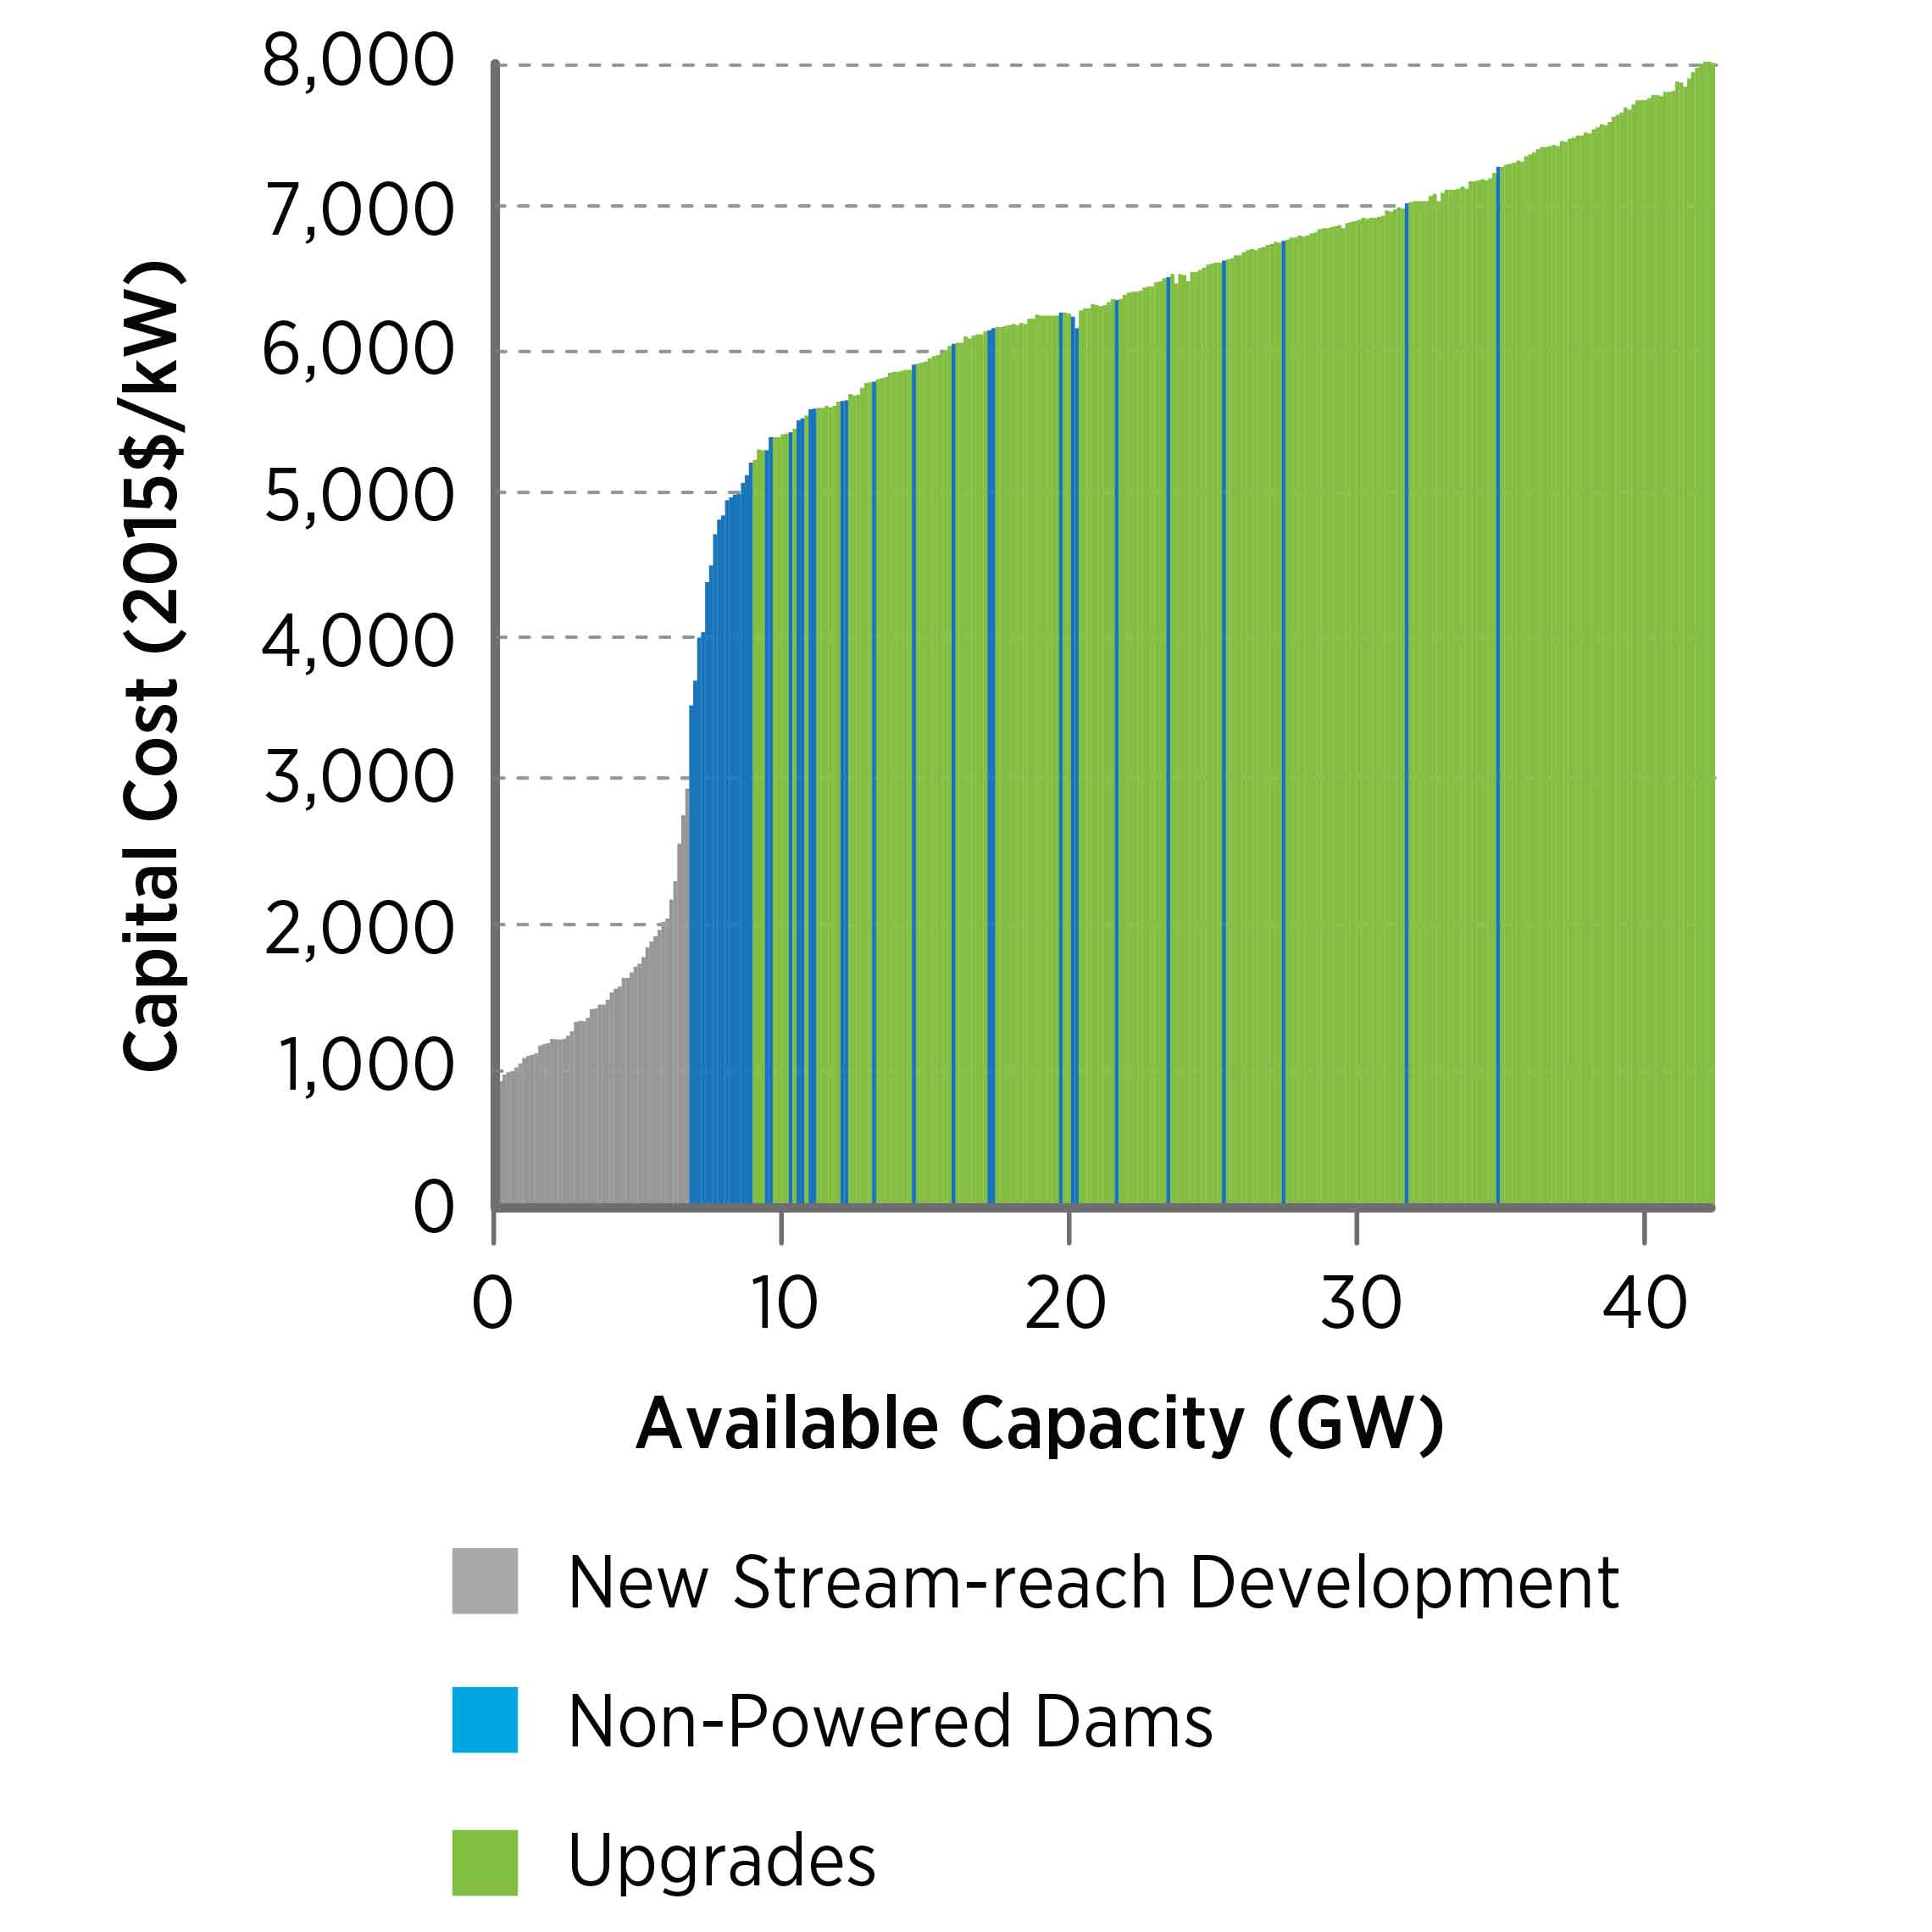
ReEDS Version 2017.1 standard scenario model results use resource/cost supply curves representing estimates at each individual facility (~700 NPD and ~8,000 NSD).
The ReEDS model represents cost and performance for NPD and NSD potential in 5 bins for each of 134 geographic regions, which results in CAPEX ranges of $2,750/kW-$9,000/kW for NPD resource and $5,200/kW-$15,600/kW for NSD.
The ReEDS model represents cost and performance for NPD and NSD potential in 5 bins for each of 134 geographic regions, which results in capacity factor ranges of 38%-80% for NPD resource and 53%-81% for NSD.
References
DOE (U.S. Department of Energy). 2016. Hydropower Vision: A New Chapter for America's Renewable Electricity Source. Washington, D.C.: U.S. Department of Energy. DOE/GO-102016-4869. July 2016. https://energy.gov/sites/prod/files/2016/10/f33/Hydropower-Vision-10262016_0.pdf.
O'Connor, Patrick W., Scott T. DeNeale, Dol Raj Chalise, Emma Centurion, and Abigail Maloof. 2015. Hydropower Baseline Cost Modeling, Version 2. Oak Ridge, TN: Oak Ridge National Laboratory. ORNL/TM-2015/471. September 2015. http://info.ornl.gov/sites/publications/files/Pub58666.pdf.