Annual Technology Baseline 2018
National Renewable Energy Laboratory
Recommended Citation:
NREL (National Renewable Energy Laboratory). 2018. 2018 Annual Technology Baseline. Golden, CO: National Renewable Energy Laboratory. http://atb.nrel.gov/.
Please consult Guidelines for Using ATB Data:
https://atb.nrel.gov/electricity/user-guidance.html
Concentrating Solar Power
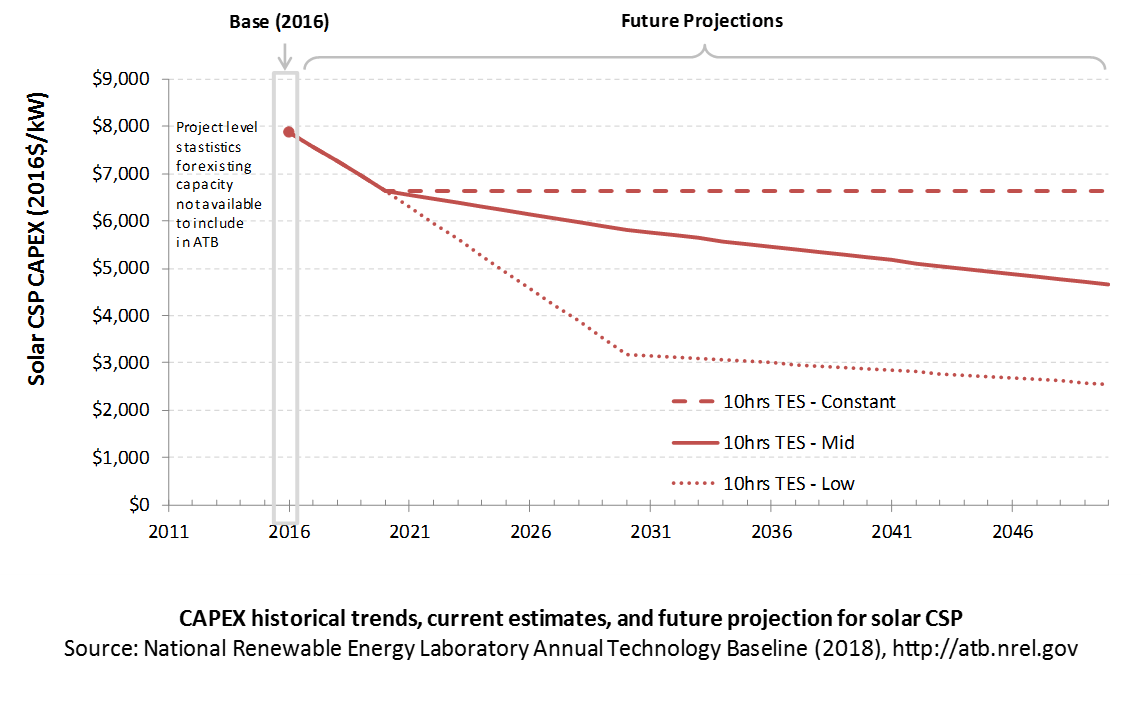
CAPital EXpenditures (CAPEX): Historical Trends, Current Estimates, and Future Projections
Capital expenditures (CAPEX) are expenditures required to achieve commercial operation in a given year. These expenditures include the generation plant, the balance of system (e.g., site preparation, installation, and electrical infrastructure), and financial costs (e.g., development costs, and interest during construction) and are detailed in CAPEX Definition. In the ATB, CAPEX reflects typical plants and does not include differences in regional costs associated with labor, materials, taxes, or system requirements. The related Standard Scenarios product uses regional CAPEX adjustments. The range of CAPEX demonstrates variation with resource in the contiguous United States.
The following figure shows the Base Year estimate and future year projections for CAPEX costs. Three cost scenarios are represented: Constant, Mid, and Low. The estimate for a given year represents CAPEX of a new plant that reaches commercial operation in that year.
Base Year Estimates
CAPEX is unchanged for resource class because the same plant is assumed to be built in each location. The capacity factor will change with resource.
TES increases plant CAPEX but also increases capacity factor and annual efficiency. TES generally lowers LCOE for power towers.
The CAPEX estimate (with a base year of 2016) is approximately $7,870/kWe in $2016. It is for a representative power tower with 10 hours of storage and a solar multiple of 2.4. Based on recent assessment of the industry and expected project completion in 2020, the CAPEX estimate for 2020 is $6,640/kWe in $2016 .
Future Year Projections
Three cost projections are developed for CSP technologies:
- Constant Technology Cost Scenario: no change in CAPEX, O&M, or capacity factor from current estimates (2020 for CSP) to 2050; consistent across all renewable energy technologies in the ATB
- Mid Technology Cost Scenario: the median of published literature projections for future CAPEX; it is expected based on literature that there could be a 25% CAPEX reduction by 2030 from the 2015 costs (Feldman et al. (2017)). From 2030 to 2050, a further 20% reduction in CAPEX is assumed
- Low Technology Cost Scenario: originates from the lowest CAPEX projections to 2025 (IRENA 2016) and is extended to later years based on DOE research targets.
A detailed description of the methodology for developing future year projections is found in Projections Methodology.
Technology innovations that could impact future O&M costs are summarized in LCOE Projections.
References
The Power to Change: Solar and Wind Cost Reduction Potential to 2025. June 2016. Paris: International Renewable Energy Agency. http://www.irena.org/DocumentDownloads/Publications/IRENA_Power_to_Change_2016.pdf.
Feldman, David, Jack Hoskins, and Robert Margolis. 2017. Q2/Q3 2017 Solar Industry Update. U.S. Department of Energy. NREL/PR-6A42-70406. November 13, 2017. https://www.nrel.gov/docs/fy18osti/70406.pdf.