Annual Technology Baseline 2018
National Renewable Energy Laboratory
Recommended Citation:
NREL (National Renewable Energy Laboratory). 2018. 2018 Annual Technology Baseline. Golden, CO: National Renewable Energy Laboratory. http://atb.nrel.gov/.
Please consult Guidelines for Using ATB Data:
https://atb.nrel.gov/electricity/user-guidance.html
Utility-Scale PV
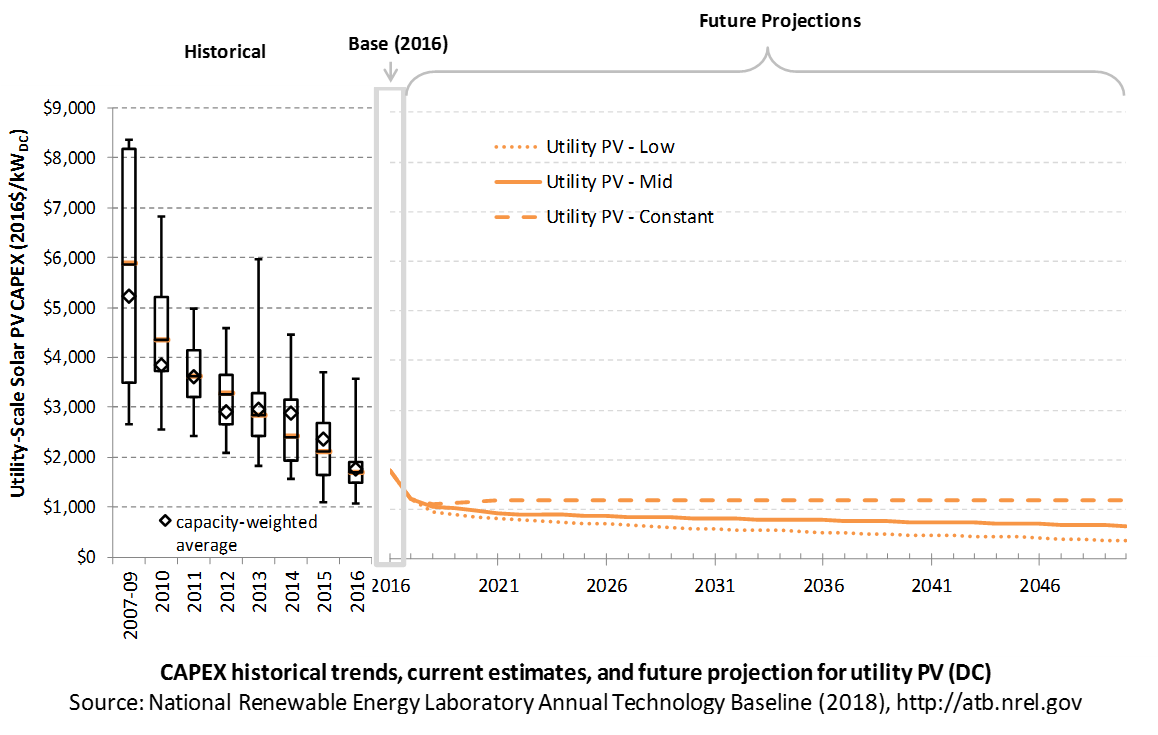
CAPital EXpenditures (CAPEX): Historical Trends, Current Estimates, and Future Projections
Capital expenditures (CAPEX) are expenditures required to achieve commercial operation in a given year. These expenditures include the hardware, the balance of system (e.g., site preparation, installation, and electrical infrastructure), and financial costs (e.g., development costs, onsite electrical equipment, and interest during construction) and are detailed in CAPEX Definition. In the ATB, CAPEX reflects typical plants and does not include differences in regional costs associated with labor, materials, taxes, or system requirements. The related Standard Scenarios product uses regional CAPEX adjustments. The range of CAPEX demonstrates variation with resource in the contiguous United States.
The following figures show the Base Year estimate and future year projections for CAPEX costs in terms of $/kWDC or $/kWAC. Three cost scenarios are represented: Constant, Mid, and Low technology cost. Historical data from utility-scale PV plants installed in the United States are shown for comparison to the ATB Base Year estimates. The estimate for a given year represents CAPEX of a new plant that reaches commercial operation in that year.
The PV industry typically refers to PV CAPEX in terms of $/kWDC based on the aggregated module capacity. The electric utility industry typically refers to PV CAPEX in terms of $/kWAC based on the aggregated inverter capacity. See Solar PV AC-DC Translation for details. The figures illustrate the CAPEX historical trends, current estimates, and future projections in terms of $/kWDC or $/kWAC; current estimates and future projections assume an inverter loading ratio of 1.3 while historical numbers represent reported values.
Recent Trends
Reported historical utility-scale PV plant CAPEX (Bolinger et al. (2017)) is shown in box-and-whiskers format for comparison to the ATB current CAPEX estimates and future projections. Bolinger et al. (2017) provide statistical representation of CAPEX for 88% of all utility-scale PV capacity.
PV pricing and capacities are quoted in kWDC (i.e., module rated capacity) unlike other generation technologies, which are quoted in kWAC. For PV, this would correspond to the combined rated capacity of all inverters. This is done because kWDC is the unit that most of the PV industry uses. Although costs are reported in kWDC, the total CAPEX includes the cost of the inverter, which has a capacity measured in kWAC.
CAPEX estimates for 2016 reflect continued rapid decline supported by analysis of recent power purchase agreement pricing (Bolinger et al. (2017)) for projects that will become operational in 2016 and beyond.
Base Year Estimates
For illustration in the ATB, a representative utility-scale PV plant is shown. Although the PV technologies vary, typical plant costs are represented with a single estimate because the CAPEX does not vary with solar resource.
Although the technology market share may shift over time with new developments, the typical plant cost is represented with the projections above.
A system price of $1.75/WDC in 2016 represents the capacity-weighted average price of a utility-scale PV system installed in 2016 as reported in Bolinger et al. (2017) and adjusted to remove regional cost multipliers based on geographic location of projects installed in 2016. The $1.20/WDC price in 2017 is based on modeled pricing for one-axis tracking systems quoted in Q1 2017 as reported in Fu et al. (2017), adjusted for inflation, and accounting for $0.1/W higher than expected module prices due to tariff concerns in the R&D + Market sensitivity case. These figures are in line with other estimated system prices reported in Feldman et al. (2017).
The Base Year CAPEX estimates should tend toward the low end of reported pricing because no regional impacts, time-lagged system prices, or spur line costs are included. These effects are represented in the historical market data.
For example, in 2014, the reported capacity-weighted average system price was higher than 80% of system prices in 2014 due to very large systems, with multi-year construction schedules, installed in that year. Developers of these large systems negotiated contracts and installed portions of their systems when module and other costs were higher.
Future Year Projections
Projections of future utility-scale PV plant CAPEX are based on 15 system price projections from 9 separate institutions with short-term projections (BNEF (2017a); GTM Research (2016); EIA (2017a); EIA (2016a); IHS (2017)) (BNEF (2017a); GTM Research (2016); EIA 2017; IEA (2016); IHS (2017) made in the past year and long-term projections (ABB (2017); BNEF (2017b); Carlsson et al. (2014); Fraunhofer ISE (2015); Teske et al. (2015)) made in the last four years. We adjusted the " min," " median," and " max" projections in a few different ways. All 2016 pricing is based on the capacity-weighted average utility-scale system price as reported in Utility-Scale Solar 2016 (Bolinger et al. (2017)) and adjusted by the ReEDS state-level capital cost multipliers to remove geographic price distortions from 2016 reported pricing. All 2017 pricing is based on the bottom-up benchmark analysis reported in U.S. Solar Photovoltaic System Cost Benchmark Q1 2017 (adjusted for inflation, and accounting for $0.1/W higher than expected module prices due to tariff concerns in the R&D + Market sensitivity case) (Fu et al. (2017)). These figures are in line with other estimated system prices reported in Feldman et al. (2017).
We adjusted the Mid and Low projections for 2018-2050 to remove distortions caused by the combination of forecasts with different time horizons and based on internal judgment of price trends. In addition, because the projections were made before the Section 201 proclamation implementing a tariff on imported PV modules and cells, we adjusted projections to incorporate Section 201 tariff per pricing from internal NREL analysis in the R&D + Market sensitivity case. The Constant cost scenario is kept constant at the 2017 CAPEX value, assuming no improvements beyond2017.
The largest annual reductions in CAPEX for the Mid and Low projections occur from 2016 to 2017, dropping 32%. While reported CAPEX values have not been collected for all systems built in 2017 and 2018, historical CAPEX information has been consistent with utility-scale benchmarks after adjusting for installation data and system size.
Initial reported pricing for utility-scale power purchase agreements (PPAs) placed in service in 2016 fell to approximately $60/MWh, which is consistent in price with PPAs executed in 2013 and 2014, representing a two- to three-year lag from execution to installation. The capacity average executed PPA price in 2016 was approximately $35/MWh. If PPAs executed in 2016 follow a similar two-year lag, we would expect those systems to be installed in 2018-2019; therefore, we could see the capacity-weighted average PPA price for systems installed in the year fall from $60/MWh in 2016 to $35/MWh in 2018, or 41% less. The capacity average executed PPA price in 2016 was 41% lower than the capacity-weighted average PPA price for a system installed in 2016. While PPA pricing and CAPEX are not perfectly correlated, from 2010 to 2016, the capacity-weighted average PPA price and CAPEX for systems installed in that year fell 63% and 54% respectively (Bolinger et al. (2017)).
A detailed description of the methodology for developing future year projections is found in Projections Methodology.
Technology innovations that could impact future CAPEX costs are summarized in LCOE Projections.
References
Annual Energy Outlook 2017 with Projections to 2050. Washington, D.C.: U.S. Department of Energy. January 5, 2017. http://www.eia.gov/outlooks/aeo/pdf/0383(2017).pdf.
H2 2017 US PV Market Outlook. December 13, 2017. New York: BNEF.
PV Market Outlook, Q4 2017. November 17, 2017. New York: BNEF.
ABB. 2017. Spring 2017 Power Reference Case: Preview of key changes & potential impacts. ABB Enterprise Software. April 5, 2017.
Bolinger, Mark, Joachim Seel, and Kristina Hamachi LaCommare. 2017. Utility-Scale Solar 2016: An Empirical Analysis of Project Cost, Performance, and Pricing Trends in the United States. Berkeley, CA: Lawrence Berkeley National Laboratory. LBNL- 2001055. September 2017. http://eta-publications.lbl.gov/sites/default/files/utility-scale_solar_2016_report.pdf.
Carlsson, J., M. del Mar Perez Fortes, G. de Marco, J. Giuntoli, M. Jakubcionis, A. Jäger-Waldau, R. Lacal-Arantegui, S. Lazarou, D. Magagna, C. Moles, B. Sigfusson, A. Spisto, M. Vallei, and E. Weidner. 2014. ETRI 2014: Energy Technology Reference Indicator, Projections for 2010-2050. European Commission: JRC Science and Policy Reports. http://publications.jrc.ec.europa.eu/repository/bitstream/JRC92496/ldna26950enn.pdf.
EIA (U.S. Energy Information Administration). 2016a. Capital Cost Estimates for Utility Scale Electricity Generating Plants. Washington, D.C.: U.S. Department of Energy. November 2016. https://www.eia.gov/analysis/studies/powerplants/capitalcost/pdf/capcost_assumption.pdf.
Feldman, David, Jack Hoskins, and Robert Margolis. 2017. Q2/Q3 2017 Solar Industry Update. U.S. Department of Energy. NREL/PR-6A42-70406. November 13, 2017. https://www.nrel.gov/docs/fy18osti/70406.pdf.
Fraunhofer ISE. 2015. Current and Future Cost of Photovoltaics: Long-term Scenarios for Market Development, System Prices and LCOE of Utility-Scale PV Systems. Prepared for Agora Energiewende. Freiburg, Germany: Fraunhofer-Institute for Solar Energy Systems (ISE). 059/01-S-2015/EN. February 2015. https://www.agora-energiewende.de/fileadmin/Projekte/2014/Kosten-Photovoltaik-2050/AgoraEnergiewende_Current_and_Future_Cost_of_PV_Feb2015_web.pdf.
Fu, Ran, David Feldman, Robert Margolis, Mike Woodhouse, and Kristen Ardani. 2017. U.S. Solar Photovoltaic System Cost Benchmark: Q1 2017. Golden, CO: National Renewable Energy Laboratory. NREL/TP-6A20-68925. https://www.nrel.gov/docs/fy17osti/68925.pdf.
GTM Research. 2016. U.S. PV System Pricing H1 2017: System Pricing, Breakdowns and Forecasts. Boston, MA: GTM Research. June 2017.
IEA (International Energy Agency). 2016. World Energy Outlook 2016. Paris: International Energy Agency. December 2016.
IHS. 2017. PV Demand Market Tracker. Q4 2017. IHS. December 8, 2017. https://technology.ihs.com/572649/pv-demand-market-tracker-q4-2017.
IRENA (International Renewable Energy Agency). n.d. "IRENA Renewable Cost Database." Accessed 2017: http://www.irena.org/costs.
Teske, Sven, Steve Sawyer, and Oliver Schäfer, Thomas Pregger, Sonja Simon, and Tobias Naegler. 2015. Energy [r]evolution: A Sustainable World Energy Outlook 2015. Global Wind Energy Council, Solar Power Europe & Greenpeace. September 2015.