Annual Technology Baseline 2018
National Renewable Energy Laboratory
Recommended Citation:
NREL (National Renewable Energy Laboratory). 2018. 2018 Annual Technology Baseline. Golden, CO: National Renewable Energy Laboratory. http://atb.nrel.gov/.
Please consult Guidelines for Using ATB Data:
https://atb.nrel.gov/electricity/user-guidance.html
Offshore Wind
CAPital EXpenditures (CAPEX): Historical Trends, Current Estimates, and Future Projections
Capital expenditures (CAPEX) are expenditures required to achieve commercial operation in a given year. These expenditures include the wind turbine, the balance of system (e.g., site preparation, installation, and electrical infrastructure), and financial costs (e.g., development costs, onsite electrical equipment, and interest during construction) and are detailed in CAPEX Definition. In the ATB, CAPEX reflects typical plants and does not include differences in regional costs associated with labor, materials, taxes, or system requirements. The related Standard Scenarios product uses regional CAPEX adjustments. The range of CAPEX demonstrates variation with wind resource in the contiguous United States.
The following figure shows the Base Year estimate and future year projections for CAPEX costs. Three cost scenarios are represented: Constant, Mid, and Low technology cost cases. Historical data from land-based wind plants installed in the United States are shown for comparison to the ATB Base Year estimates. The estimate for a given year represents CAPEX of a new plant that reaches commercial operation in that year.
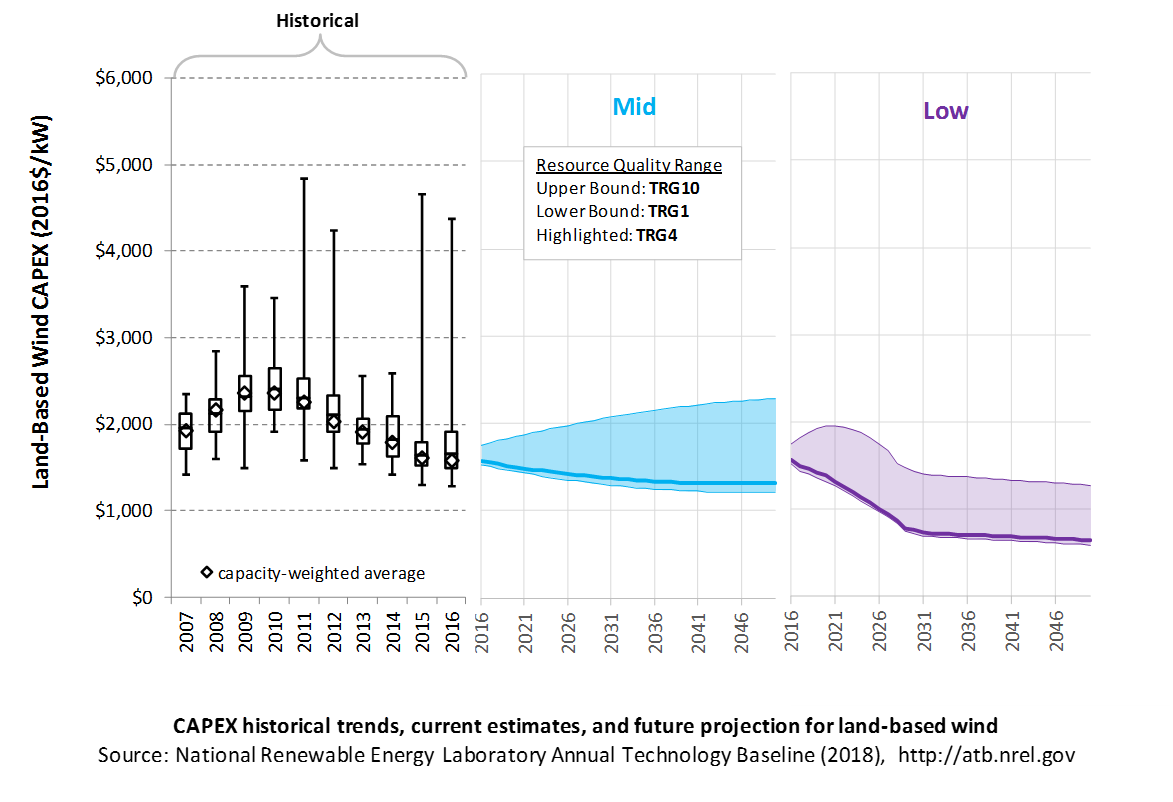
CAPEX estimates for 2016 correspond well with market data for plants installed in 2016. Projections reflect a continuation of the downward trend observed in the recent past and are anticipated to continue based on preliminary data for 2017 projects.
In the lower wind resource areas represented by TRGs 6-10, CAPEX is expected to grow as future wind turbine technology transitions to new platforms, including taller towers, larger rotors, and higher machine ratings. In the higher wind resource areas represented by TRGs 1-5, optimization of current wind turbine platforms will lead to lower CAPEX in future years.
Recent Trends
Actual land-based wind plant CAPEX (Wiser and Bolinger (2017)) is shown in box-and-whiskers format for comparison to the ATB current CAPEX estimates and future projections. provide statistical representation of CAPEX for about 65% of wind plants installed in the United States since 2007. CAPEX estimates should tend toward the low end of observed cost because no regional impacts or spur line costs are included. These effects are represented in the market data.
Base Year Estimates
For illustration in the ATB, all potential land-based wind plant areas were represented in 10 TRGs. These were defined by resource potential (GW) and have higher resolution on the highest-quality TRGs, as these are the most likely sites to be deployed, based on their economics.
TRG 1 represents the best 100 GW of wind, as determined by LCOE. TRG 2 represents the next best 200 GW, while TRG 3 represents the next best 400 GW, and TRG 4 represents the next best 800 GW. TRGs 5-9 all represent 1,600 GW of resource potential. TRG 10 represents the remaining 1,148 GW of available potential. This representation is based on the approach described in DOE (2015) and implemented with 2015 market data in Moné et al. (2017).
The following table summarizes the annual average wind speed range for each TRG, capacity-weighted average wind speed, cost and performance parameters for each TRG, and resource potential in terms of capacity and energy for each TRG. Typical land-based wind installations in 2015 and 2016 are associated with TRG4.
TRG Definitions for Land-Based Wind
| Techno-Resource Group (TRG) | Wind Speed Range (m/s) | Weighted Average Wind Speed (m/s) | Weighted Average CAPEX ($/kW) | Weighted Average OPEX ($/kW-yr) | Weighted Average Net CF (%) | Potential Wind Plant Capacity (GW) | Potential Wind Plant Energy (TWh) |
|---|---|---|---|---|---|---|---|
| TRG1 | 8.2-13.5 | 8.7 | 1,573 | 51 | 47.4% | 100 | 414 |
| TRG2 | 8.0-10.9 | 8.4 | 1,592 | 51 | 46.2% | 200 | 810 |
| TRG3 | 7.7-11.1 | 8.2 | 1,599 | 51 | 45.0% | 400 | 1,576 |
| TRG4 | 7.5-13.1 | 7.9 | 1,605 | 51 | 43.5% | 800 | 3,050 |
| TRG5 | 6.9-11.1 | 7.5 | 1,616 | 51 | 40.7% | 1,600 | 5,708 |
| TRG6 | 6.1-9.4 | 6.9 | 1,642 | 51 | 36.4% | 1,600 | 5,098 |
| TRG7 | 5.4-8.3 | 6.2 | 1,678 | 51 | 30.8% | 1,600 | 4,320 |
| TRG8 | 4.7-6.9 | 5.5 | 1,708 | 51 | 24.6% | 1,600 | 3,443 |
| TRG9 | 4.0-6.0 | 4.8 | 1,713 | 51 | 18.3% | 1,600 | 2,558 |
| TRG10 | 1.0-5.3 | 4.0 | 1,713 | 51 | 11.1% | 1,148 | 1,116 |
| Total | 10,648 | 28,092 | |||||
Future Year Projections
Mid: Projections of future LCOE were derived from a survey of wind industry experts (Wiser et al. (2016)) for scenarios that are associated with a 50% probability level in 2030 and 2050. Projections of future land-based wind plant CAPEX were determined based on adjustments to CAPEX, fixed O&M (FOM), and capacity factor in each year to result in a predetermined LCOE value derived from Wiser et al. (2016).
In order to achieve the overall LCOE reduction associated with the median and low projections from the expert survey, CAPEX was used to accommodate all improvement aspects other than O&M and capacity factor survey results. In the lower wind resource areas represented by TRGs 6-10, CAPEX is expected to grow as future wind turbine technology transitions to new platforms, including taller towers, larger rotors, and higher machine ratings. In the higher wind resource areas represented by TRGs 1-5, optimization of current wind turbine platforms will lead to lower CAPEX.
Low: Projections of future LCOE for the Low cost scenario were derived from an accelerated development pathway that included incremental improvements to technology through scaling and learning as well as innovation enabled by the DOE's Atmosphere to Electrons research program and anticipated scientific advances (Dykes et al. (2017)). The reductions in turbine and balance-of-system CAPEX were estimated by a survey of wind industry experts (Wiser et al. (2016)) focusing on detailed line item cost reduction potential. The results of the survey show a reduction in turbine and balance-of-system CAPEX by 2030 through turbine scaling with less material use and use of more efficient manufacturing processes. The accelerated decline in CAPEX is expected for all TRGs through 2030 except TRGs 9 and 10, where CAPEX is expected to slightly increase in the near term and then begin to decline at the same rate as the remaining TRGs. After 2030, the rate of CAPEX reduction is expected to continue but at a slower rate. As stated in Dykes et al. (2017), the wind turbine industry is expected to continue trends in scaling seen over the past several decades while learning processes will keep the per-unit power costs of these turbines at or below current levels. In addition, the turbine size increases will lead to economies of scale for the wind power plant through reductions in plant infrastructure and erection costs while science-enabled R&D pathways in turbine design will push materials and manufacturing costs of per-unit power to levels lower than those observed today.
A detailed description of the methodology for developing future year projections is found in Projections Methodology.
Technology innovations that could impact future O&M costs are summarized in LCOE Projections.
References
DOE (U.S. Department of Energy). 2015. Wind Vision: A New Era for Wind Power in the United States. U.S. Department of Energy. DOE/GO-102015-4557. March 2015. http://energy.gov/sites/prod/files/2015/03/f20/wv_full_report.pdf.
Dykes, K., M. Hand, T. Stehly, P. Veers, M. Robinson, E. Lantz. 2017. Enabling the SMART Wind Power Plant of the Future Through Science-Based Innovation (Technical Report), NREL/TP-5000-68123. National Renewable Energy Laboratory (NREL). Golden, CO (US). https://www.nrel.gov/docs/fy17osti/68123.pdf.
Moné, Christopher, Maureen Hand, Mark Bolinger, Joseph Rand, Donna Heimiller, and Jonathan Ho. 2017. 2015 Cost of Wind Energy Review. Golden, CO: National Renewable Energy Laboratory. NREL/TP-6A20-66861. http://www.nrel.gov/docs/fy17osti/66861.pdf.
Wiser, Ryan, and Mark Bolinger. 2014. 2014 Wind Technologies Market Report. U.S. Department of Energy. DOE/GO-102015-4702. https://energy.gov/sites/prod/files/2015/08/f25/2014-Wind-Technologies-Market-Report-8.7.pdf.
Wiser, Ryan, and Mark Bolinger. 2017. 2016 Wind Technologies Market Report. https://www.energy.gov/sites/prod/files/2017/10/f37/2016_Wind_Technologies_Market_Report_101317.pdf.
Wiser, Ryan, Karen Jenni, Joachim Seel, Erin Baker, Maureen Hand, Eric Lantz, and Aaron Smith. 2016. Forecasting Wind Energy Costs and Cost Drivers: The Views of the World's Leading Experts. Berkeley, CA: Lawrence Berkeley National Laboratory. LBNL-1005717. June 2016. https://emp.lbl.gov/publications/forecasting-wind-energy-costs-and.