Annual Technology Baseline 2018
National Renewable Energy Laboratory
Recommended Citation:
NREL (National Renewable Energy Laboratory). 2018. 2018 Annual Technology Baseline. Golden, CO: National Renewable Energy Laboratory. http://atb.nrel.gov/.
Please consult Guidelines for Using ATB Data:
https://atb.nrel.gov/electricity/user-guidance.html
Commercial PV
CAPital EXpenditures (CAPEX): Historical Trends, Current Estimates, and Future Projections
Capital expenditures (CAPEX) are expenditures required to achieve commercial operation in a given year. These expenditures include the hardware, the balance of system (e.g., site preparation, installation, and electrical infrastructure), and financial costs (e.g., development costs, onsite electrical equipment, and interest during construction) and are detailed in CAPEX Definition. In the ATB, CAPEX reflects typical plants and does not include differences in regional costs associated with labor, materials, taxes, or system requirements. The related Standard Scenarios product uses regional CAPEX adjustments. The range of CAPEX demonstrates variation with resource in the contiguous United States.
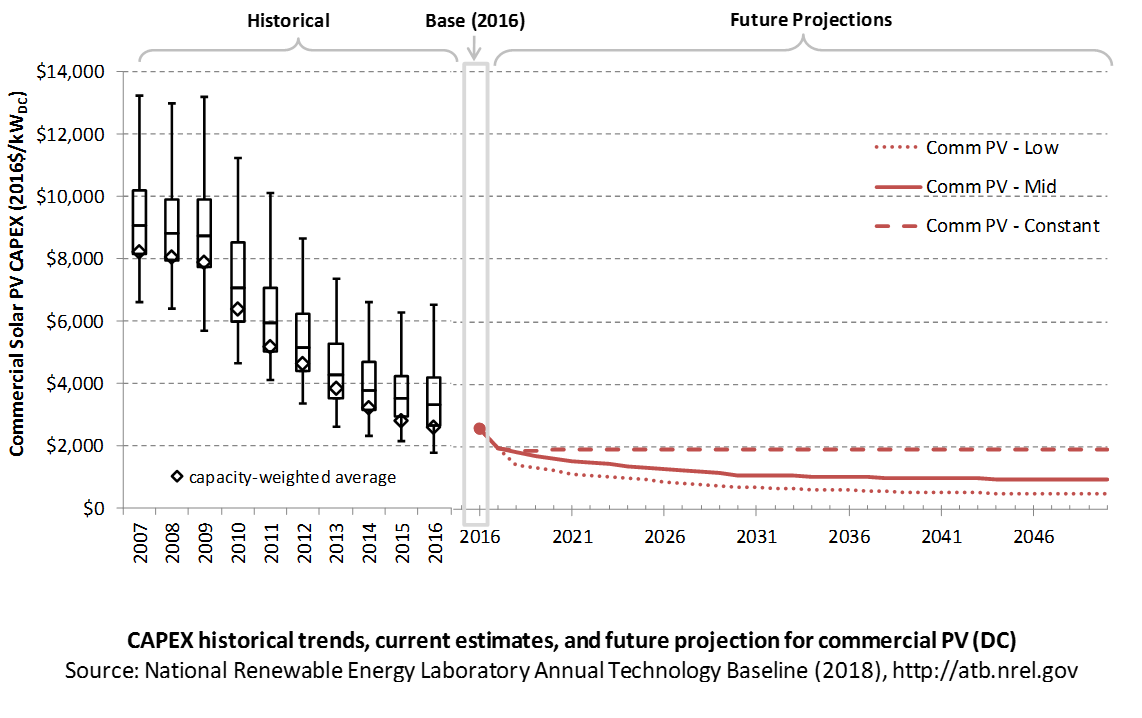
The following figure shows the Base Year estimate and future year projections for CAPEX costs. Three technology cost scenarios are represented: Constant, Mid, and Low. Historical data from commercial PV installed in the United States are shown for comparison to the ATB Base Year estimates. The estimate for a given year represents CAPEX of a new plant that reaches commercial operation in that year.
Recent Trends
Reported historical commercial-scale PV installation CAPEX (Barbose and Dargouth (2017)) is shown in box-and-whiskers format for comparison to the ATB current CAPEX estimates and future projections. The data in Barbose and Dargouth (2017) represent 83% of all U.S. residential and commercial PV capacity installed through 2016 and 76% of capacity installed in 2016.
PV pricing and capacities are quoted in kWDC (i.e., module rated capacity) unlike other generation technologies, which are quoted in kWAC. For PV, this would correspond to the combined rated capacity of all inverters. This is done because kWDC is the unit that the majority of the PV industry uses. Although costs are reported in kWDC, the total CAPEX includes the cost of the inverter, which has a capacity measured in kWAC.
CAPEX estimates for 2016 reflect continued rapid decline in pricing supported by analysis of recent system pricing for projects that became operational in 2016 (Feldman et al. (2017)).
The range in CAPEX estimates reflects the heterogeneous composition of the commercial PV market in the United States.
Base Year Estimates
For illustration in the ATB, a representative commercial-scale PV installation is shown. Although the PV technologies vary, typical installation costs are represented with a single estimate because the CAPEX does not vary with solar resource.
Although the technology market share may shift over time with new developments, the typical installation cost is represented with the projections above.
A system price of $2.56/WDC in 2016 represents the capacity-weighted average reported price of a commercial PV system installed in 2016 reported in Tracking the Sun X (Barbose and Dargouth (2017)) and adjusted to remove regional cost multipliers based on geographic location of projects installed in 2016. The $1.95/WDC in 2017 is based on bottom-up benchmark analysis reported in U.S. Solar Photovoltaic System Cost Benchmark Q1 2017 (adjusted for inflation, and accounting for $0.1/W higher than expected module prices due to tariff concerns in the R&D + Market sensitivity case) (Fu et al. (2017)). These figures are in line with other estimated system prices reported in Feldman et al. (2017).
The Base Year CAPEX estimates should tend toward the low end of observed cost because no regional impacts are included. These effects are represented in the historical market data.
Future Year Projections
Projections of future commercial PV installation CAPEX are based on 12 system price projections from 6 separate institutions. We adjusted the " min," " median," and " max" projections in a few different ways. All 2016 pricing is based on the capacity-weighted average historically reported commercial PV prices reported in Tracking the Sun X (Barbose and Dargouth (2017)). All 2017 pricing is based on the bottom-up benchmark analysis reported in U.S. Solar Photovoltaic System Cost Benchmark Q1 2017 (adjusted for inflation, and accounting for $0.1/W higher than expected module prices due to tariff concerns in the R&D + Market sensitivity case) (Fu et al. (2017)). These figures are in line with other estimated system prices reported in Feldman et al. (2017).
We adjusted the Mid and Low projections for 2018-2050 to remove distortions caused by the combination of forecasts with different time horizons and based on internal judgment of price trends. In addition, because the projections were made before the Section 201 proclamation implementing a tariff on imported PV modules and cells, we adjusted projections to incorporate Section 201 tariff per pricing from internal NREL analysis in the R&D + Market sensitivity case. For the Constant technology cost scenario the 2017 CAPEX value is held constant, assuming no improvements beyond2017.
A detailed description of the methodology for developing future year projections is found in Projections Methodology.
Technology innovations that could impact future CAPEX costs are summarized in LCOE Projections.
References
Barbose, Galen, and Naïm Dargouth. 2017. Tracking the Sun X: The Installed Price of Residential and Non-Residential Photovoltaic Systems in the United States. Berkeley, CA: Lawrence Berkeley National Laboratory. LBNL-2001062. September 2017. http://eta-publications.lbl.gov/sites/default/files/tracking_the_sun_10_report.pdf.
Feldman, David, Jack Hoskins, and Robert Margolis. 2017. Q2/Q3 2017 Solar Industry Update. U.S. Department of Energy. NREL/PR-6A42-70406. November 13, 2017. https://www.nrel.gov/docs/fy18osti/70406.pdf.
Fu, Ran, David Feldman, Robert Margolis, Mike Woodhouse, and Kristen Ardani. 2017. U.S. Solar Photovoltaic System Cost Benchmark: Q1 2017. Golden, CO: National Renewable Energy Laboratory. NREL/TP-6A20-68925. https://www.nrel.gov/docs/fy17osti/68925.pdf.