
Coal
The ATB includes three coal power plant types: coal-new, coal-IGCC, and coal-CCS. The cost and performance characteristics of these plants are adapted from EIA data rather than derived from original analysis.
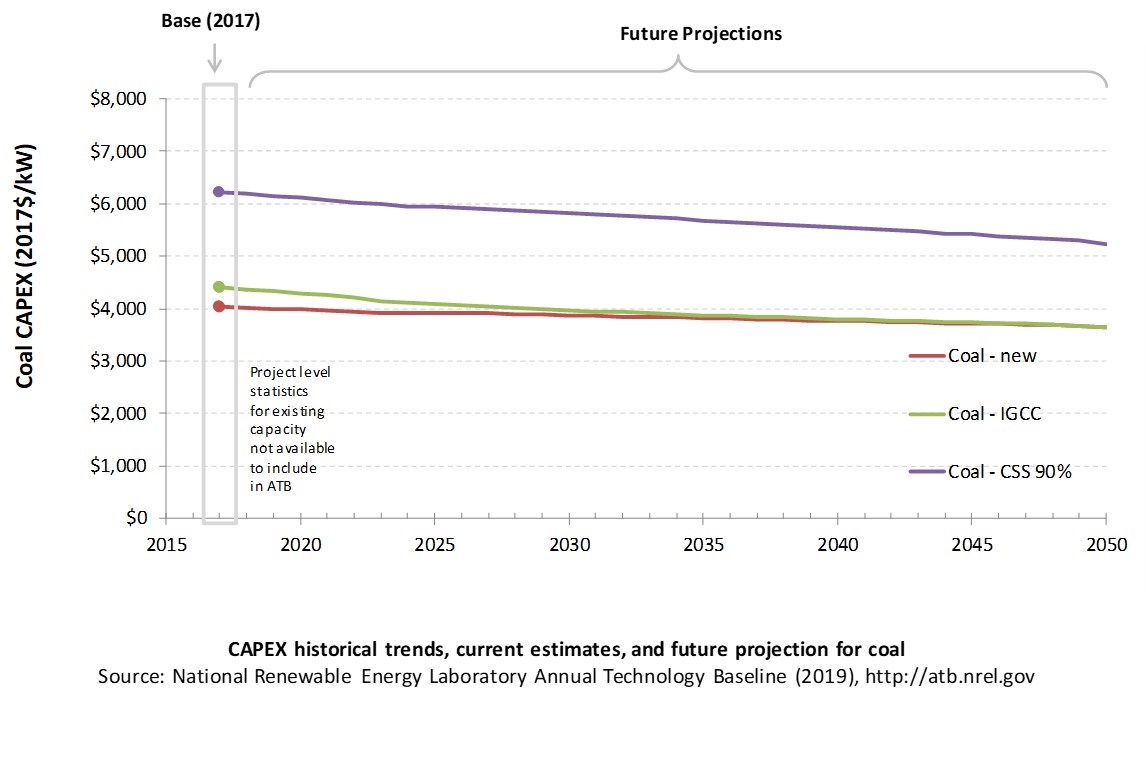
Capital Expenditures (CAPEX): Historical Trends, Current Estimates, and Future Projections
Coal power plant CAPEX is taken from the AEO2019 Reference Scenario (EIA, 2019a) with the adjustments discussed in the CAPEX definition section. The ATB includes only a single CAPEX projection for each type of coal plant.
Comparison with Other Sources
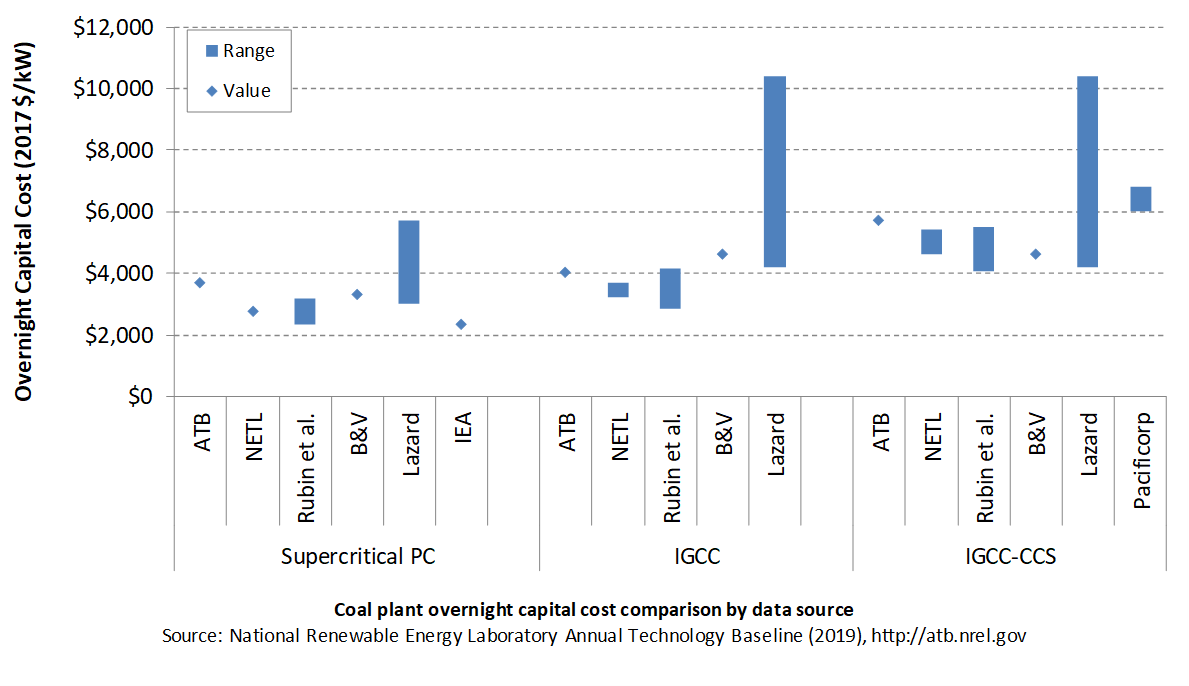
Lazard (2016) does not explicitly define its ranges with and without CCS; thus, the high end of their pulverized coal and IGCC ranges and the low end of their IGCC-CCS range are assumed to be the middle of the full reported range. All sources have been normalized to the same dollar year. Costs vary due to differences in system design (e.g., coal rank), methodology, and plant cost definitions. The coal capital costs include environmental controls to meet current federal regulations.
CAPEX Definition
Capital expenditures (CAPEX) are expenditures required to achieve commercial operation in a given year.
For coal power plants, CAPEX equals interest during construction (ConFinFactor) times the overnight capital cost (OCC).
Overnight capital costs are modified from AEO2019 (EIA, 2019a). The EIA projections were adjusted by removing the material price index. The material price index accounts for projected changes in the price index for metals and metals products, and it is independent of the learning-based cost reductions applied in the EIA projections.
For the ATB, coal-CCS technology is ultra-supercritical pulverized coal technology fitted with CCS. Both 30% capture and 90% capture options are included for the coal-CCS technology. The CCS plant configuration includes only the cost of capturing and compressing the CO2. It does not include CO2 delivery and storage.
| Overnight Capital Cost ($/kW) | Construction Financing Factor (ConFinFactor) | CAPEX ($/kW) | |
| Coal-new: Ultra-supercritical pulverized coal with SO2 and NOx controls | $3,711 | 1.087 | $4,036 |
| Coal-IGCC: Integrated gasification combined cycle (IGCC) | $4,055 | 1.087 | $4,409 |
| Coal-CCS: Ultra-supercritical pulverized coal with carbon capture and sequestration (CCS) options (30% / 90% capture) | $5,180 / $5,728 | 1.087 | $5,633 / $6,229 |
CAPEX can be determined for a plant in a specific geographic location as follows:
Regional cost variations and geographically specific grid connection costs are not included in the ATB (CapRegMult = 1; GCC = 0). In the ATB, the input value is overnight capital cost (OCC) and details to calculate interest during construction (ConFinFactor).
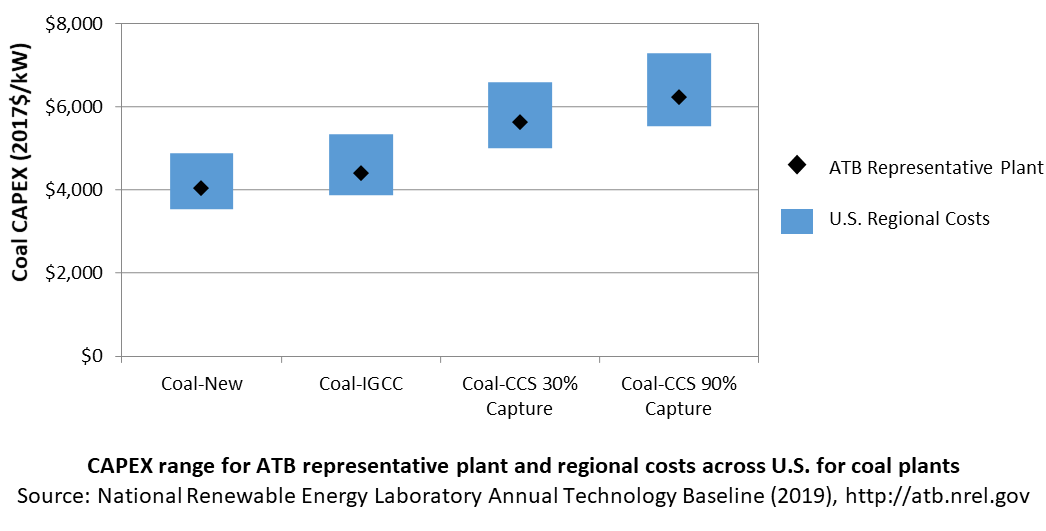
In the ATB, CAPEX represents each type of coal plant with a unique value. Regional cost effects associated with labor rates, material costs, and other regional effects as defined by (EIA, 2016) expand the range of CAPEX. Unique land-based spur line costs based on distance and transmission line costs are not estimated. The following figure illustrates the ATB representative plant relative to the range of CAPEX including regional costs across the contiguous United States. The ATB representative plants are associated with a regional multiplier of 1.0.
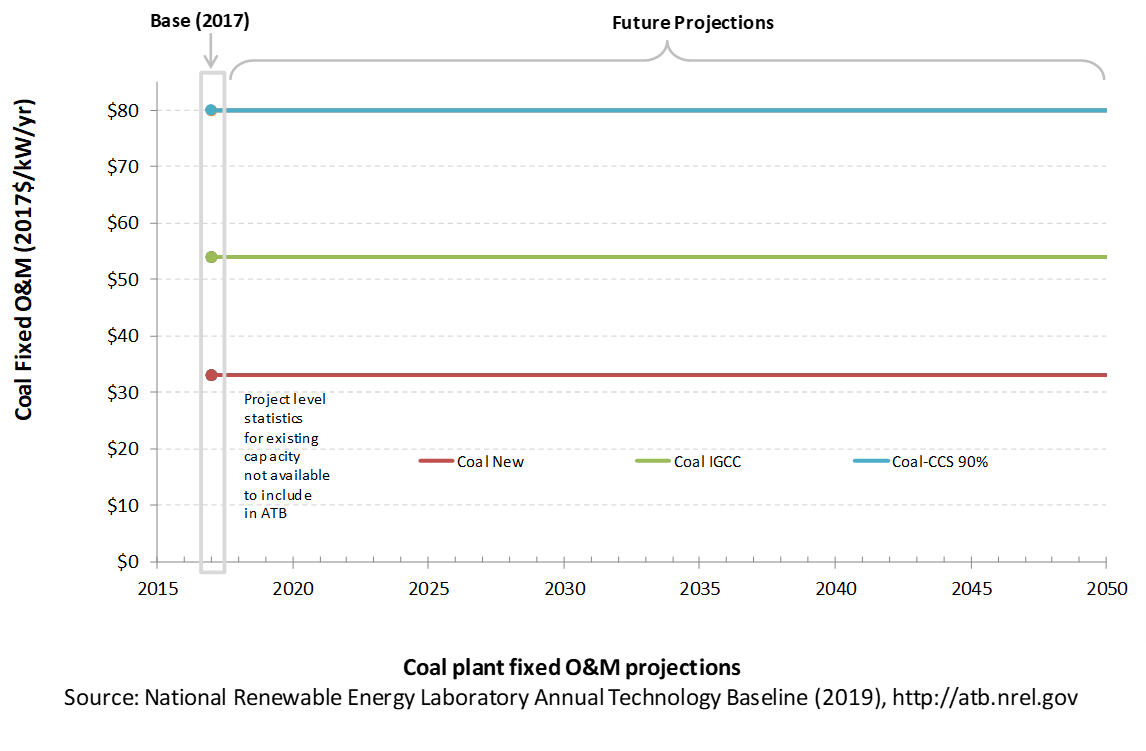
Operation and Maintenance (O&M) Costs
Coal power plant fixed and variable O&M costs are taken from table 8.2 of the AEO2019, and they are assumed to be constant over time.
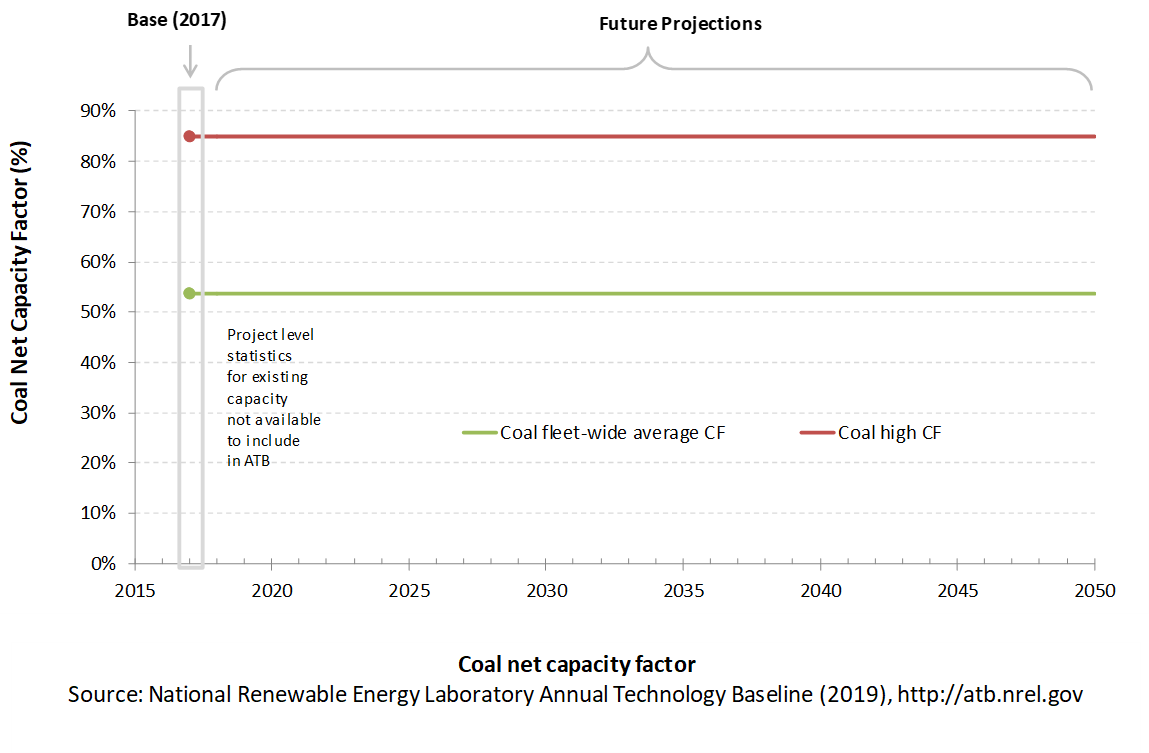
Capacity Factor: Expected Annual Average Energy Production Over Lifetime
The capacity factor represents the assumed annual energy production divided by the total possible annual energy production, assuming the plant operates at rated capacity for every hour of the year. For coal plants, the capacity factors are typically lower than their availability factors. Coal plant availability factors have a wide range depending on system design and maintenance schedules.
The capacity factor of dispatchable units is typically a function of the unit's marginal costs and local grid needs (e.g., need for voltage support or limits due to transmission congestion).
Coal power plants have typically been operated as baseload units, although that has changed in many locations due to low natural gas prices and increased penetration of variable renewable technologies. The average capacity factor used in the ATB is the fleet-wide average reported by EIA for 2017. The high capacity factor represents a new plant that would operate as a baseload unit. New coal plants would likely be more efficient than existing coal plants, and therefore would be more likely to be dispatched more often, resulting in capacity factors closer to the "high" level than the "average" level, but actual capacity factors will vary based on local grid conditions and needs.
Even though IGCC and coal with CCS have experienced limited deployment in the United States, it is expected that their performance characteristics would be similar to new coal power plants.
Levelized Cost of Energy (LCOE) Projections
Levelized cost of energy (LCOE) is a summary metric that combines the primary technology cost and performance parameters: CAPEX, O&M, and capacity factor. It is included in the ATB for illustrative purposes. The ATB focuses on defining the primary cost and performance parameters for use in electric sector modeling or other analysis where more sophisticated comparisons among technologies are made. The LCOE accounts for the energy component of electric system planning and operation. The LCOE uses an annual average capacity factor when spreading costs over the anticipated energy generation. This annual capacity factor ignores specific operating behavior such as ramping, start-up, and shutdown that could be relevant for more detailed evaluations of generator cost and value. Electricity generation technologies have different capabilities to provide such services. For example, wind and PV are primarily energy service providers, while the other electricity generation technologies provide capacity and flexibility services in addition to energy. These capacity and flexibility services are difficult to value and depend strongly on the system in which a new generation plant is introduced. These services are represented in electric sector models such as the ReEDS model and corresponding analysis results such as the Standard Scenarios.
References
The following references are specific to this page; for all references in this ATB, see References.Black & Veatch. (2012). Cost and Performance Data for Power Generation Technologies. Retrieved from Black & Veatch Corporation website: https://www.bv.com/docs/reports-studies/nrel-cost-report.pdf
EIA. (2016b). Capital Cost Estimates for Utility Scale Electricity Generating Plants. Retrieved from U.S. Energy Information Administration website: https://www.eia.gov/analysis/studies/powerplants/capitalcost/pdf/capcost_assumption.pdf
EIA. (2019a). Annual Energy Outlook 2019 with Projections to 2050. Retrieved from U.S. Energy Information Administration website: https://www.eia.gov/outlooks/aeo/pdf/AEO2019.pdf
Lazard. (2016). Lazard's Levelized Cost of Energy Analysis: Version 10.0. Retrieved from Lazard website: https://www.lazard.com/media/438038/levelized-cost-of-energy-v100.pdf
Rubin, E. S., Davison, J. E., & Herzog, H. J. (2015). The Cost of CO2 Capture and Storage. International Journal of Greenhouse Gas Control, 40, 378–400. https://doi.org/10.1016/j.ijggc.2015.05.018
Zoelle, A., Keairns, D., Pinkerton, L. L., Turner, M. J., Woods, M., Kuehn, N., … Chou, V. (2015). Cost and Performance Baseline for Fossil Energy Plants Volume 1a: Bituminous Coal (PC) and Natural Gas to Electricity Revision 3 (No. DOE/NETL-2015/1723). https://doi.org/10.2172/1480987