
Natural Gas Plants
The ATB includes three natural gas power plant types: a natural gas combustion turbine (gas-CT) and a natural gas combined cycle system (gas-CC) and a natural gas combined cycled system with carbon capture and storage (gas-CC-CCS). The cost and performance characteristics of these plants are adapted from EIA data rather than derived from original analysis.
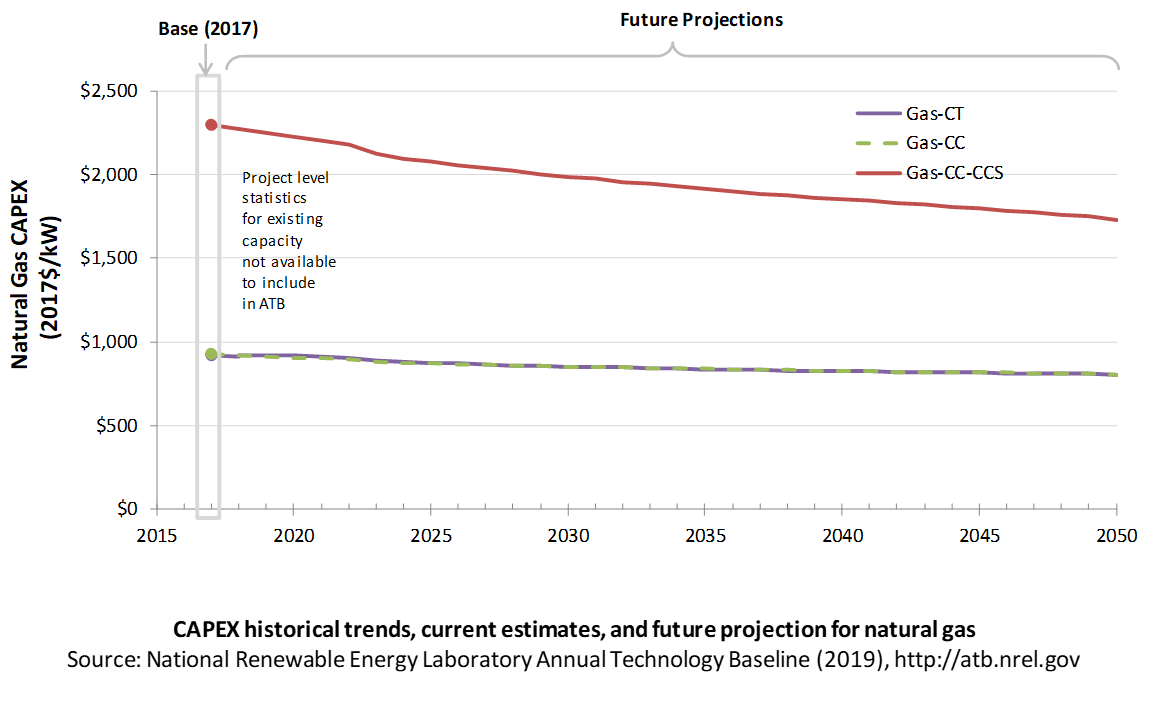
Natural gas plant CAPEX is taken from the AEO2019 (EIA, 2019a) with the adjustments discussed in the CAPEX definition section. The ATB includes only a single CAPEX projection for each type of natural gas plant.
Comparison with Other Sources
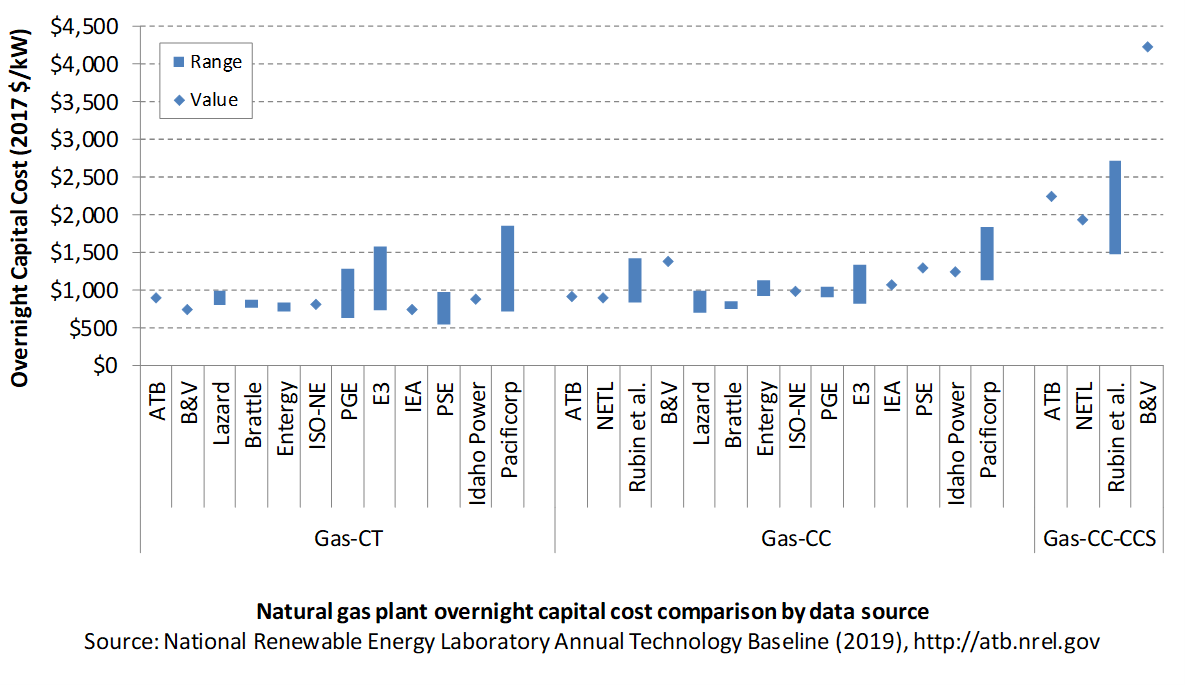
Costs vary due to differences in configuration (e.g., 2x1 versus 1x1), turbine class, and methodology. All costs were converted to the same dollar year.
CAPEX Definition
Capital expenditures (CAPEX) are expenditures required to achieve commercial operation in a given year.
Overnight capital costs are modified from Table 123 of the AEO2019 Reference scenario (EIA, 2019a).
EIA reports two types of gas-CT and gas-CC technologies in EIA's Annual Energy Outlook: advanced (H-class for gas-CC, F-class for gas-CT) and conventional (F-class for gas-CC, LM-6000 for gas-CT). Because we represent a single gas-CT and gas-CC technology in the ATB, the characteristics for the ATB plants are taken to be the average of the advanced and conventional systems as reported by EIA. For example, the overnight capital cost for the gas-CC technology in the ATB is the average of the capital cost of the advanced and conventional combined cycle technologies from the Annual Energy Outlook. The EIA only has a single advanced technology for gas-CC-CCS, which we use as the basis for that plant type in the ATB. The CCS plant configuration includes only the cost of capturing and compressing the CO2. It does not include CO2 delivery and storage.
The EIA projections were further adjusted by removing the material price index. The material price index accounts for projected changes in the price index for metals and metals products, and it is independent of the learning-based cost reductions applied in the EIA projections.
| Overnight Capital Cost ($/kW) | Construction Financing Factor (ConFinFactor) | CAPEX ($/kW) | |
| Gas-CT: National-gas-fired combustion turbine | $899 | 1.022 | $919 |
| Gas-CC: National-gas-fired combined cycle | $906 | 1.022 | $927 |
| Gas-CC-CCS: Combined cycle with carbon capture sequestration | $2,242 | 1.022 | $2,292 |
CAPEX can be determined for a plant in a specific geographic location as follows:
Regional cost variations and geographically specific grid connection costs are not included in the ATB (CapRegMult = 1; GCC = 0). In the ATB, the input value is overnight capital cost (OCC) and details to calculate interest during construction (ConFinFactor).
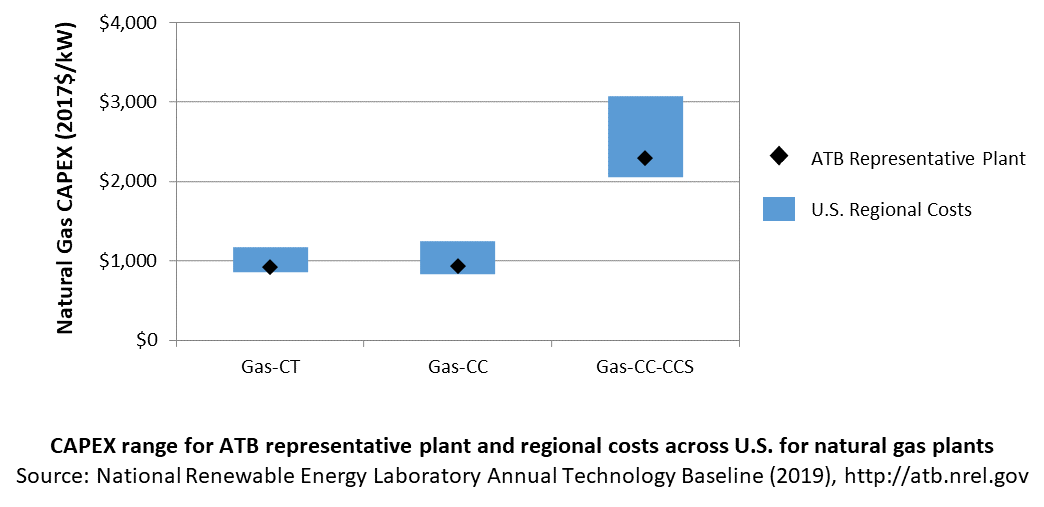
In the ATB, CAPEX represents each type of gas plant with a unique value. Regional cost effects associated with labor rates, material costs, and other regional effects as defined by (EIA, 2016) expand the range of CAPEX. Unique land-based spur line costs based on distance and transmission line costs are not estimated. The following figure illustrates the ATB representative plant relative to the range of CAPEX including regional costs across the contiguous United States. The ATB representative plants are associated with a regional multiplier of 1.0.
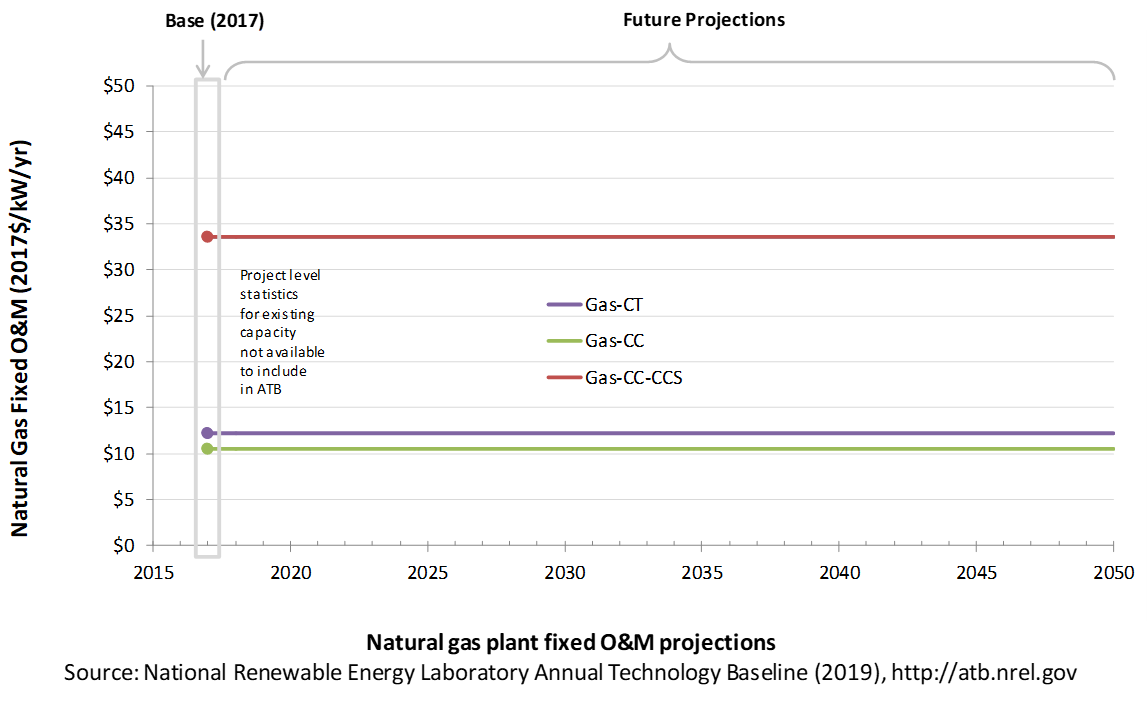
Operation and Maintenance (O&M) Costs
Natural gas plant fixed and variable O&M costs are taken from table 8.2 of the AEO2019, and they are assumed to be constant over time.
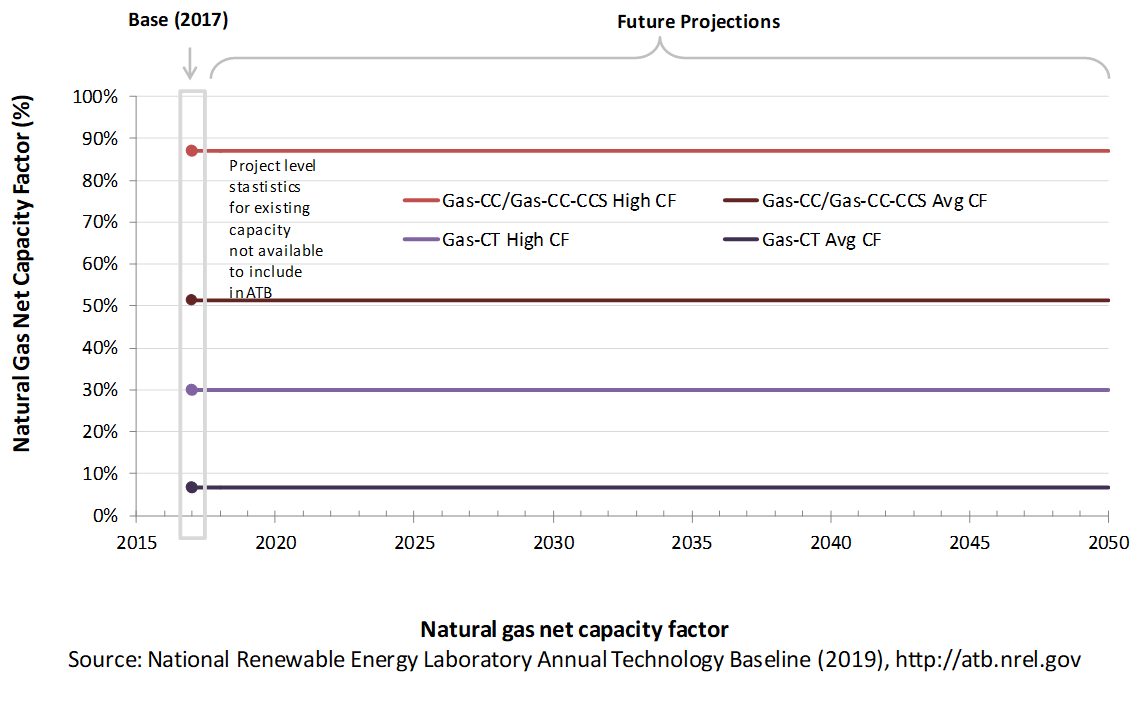
Capacity Factor: Expected Annual Average Energy Production Over Lifetime
The capacity factor represents the assumed annual energy production divided by the total possible annual energy production, assuming the plant operates at rated capacity for every hour of the year. For natural gas plants, the capacity factor is typically lower (and, in the case of combustion turbines, much lower) than their availability factor. Natural gas plants have availability factors approaching 100%.
The capacity factors of dispatchable units is typically a function of the unit's marginal costs and local grid needs (e.g., need for voltage support or limits due to transmission congestion). The average capacity factor is the average fleet-wide capacity factor for these plant types in 2017. The high capacity factor is taken from Table 1a of (EIA, 2019a) for a new power plant and represents a high bound of operation for a plant of this type.
Gas-CT power plants are less efficient than gas-CC power plants, and they tend to run as intermediate or peaker plants.
Gas-CC with CCS has not yet been built, but when built it is expected to operate as a baseload unit.
Levelized Cost of Energy (LCOE) Projections
Levelized cost of energy (LCOE) is a summary metric that combines the primary technology cost and performance parameters: CAPEX, O&M, and capacity factor. It is included in the ATB for illustrative purposes. The ATB focuses on defining the primary cost and performance parameters for use in electric sector modeling or other analysis where more sophisticated comparisons among technologies are made. The LCOE accounts for the energy component of electric system planning and operation. The LCOE uses an annual average capacity factor when spreading costs over the anticipated energy generation. This annual capacity factor ignores specific operating behavior such as ramping, start-up, and shutdown that could be relevant for more detailed evaluations of generator cost and value. Electricity generation technologies have different capabilities to provide such services. For example, wind and PV are primarily energy service providers, while the other electricity generation technologies provide capacity and flexibility services in addition to energy. These capacity and flexibility services are difficult to value and depend strongly on the system in which a new generation plant is introduced. These services are represented in electric sector models such as the ReEDS model and corresponding analysis results such as the Standard Scenarios.
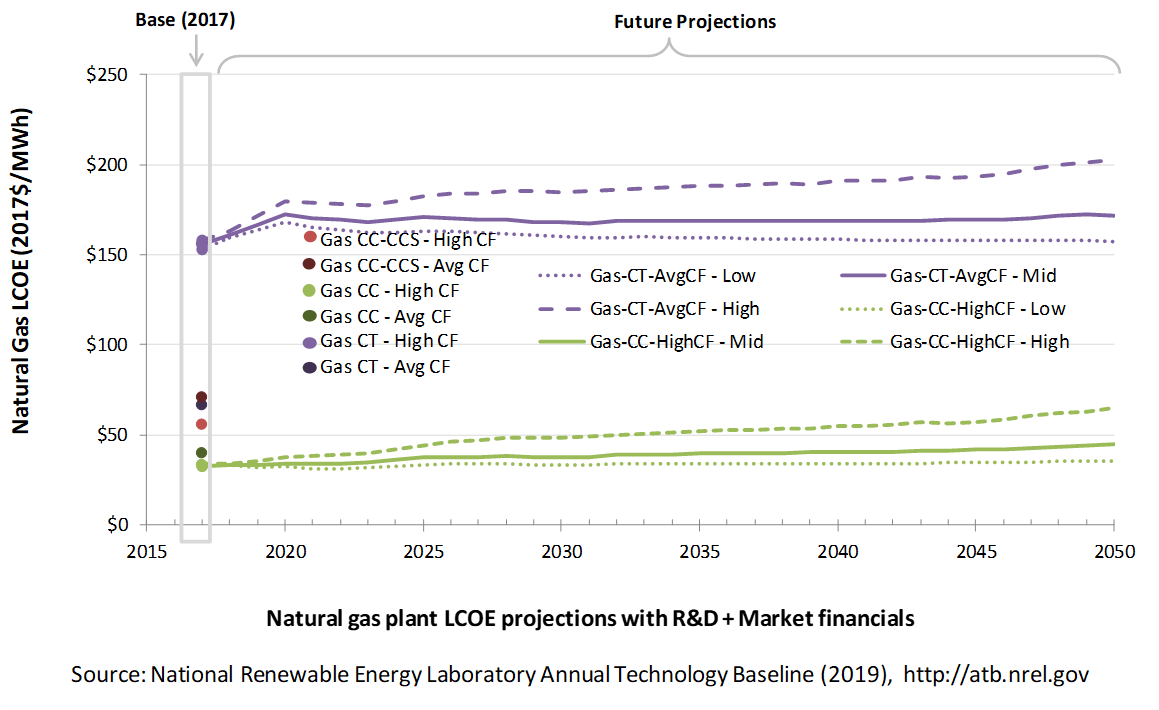
The following three figures illustrate LCOE, which includes the combined impact of CAPEX, O&M, fuel prices, and capacity factor projections for natural gas in the contiguous United States. For the purposes of the ATB, the costs associated with technology and project risk in the U.S. market are represented in the financing costs but not in the upfront capital costs (e.g., developer fees and contingencies). An individual technology may receive more favorable financing terms outside the United States, due to less technology and project risk, caused by more project development experience (e.g., offshore wind in Europe) or more government or market guarantees. The R&D Only LCOE sensitivity cases present the range of LCOE based on financial conditions that are held constant over time unless R&D affects them, and they reflect different levels of technology risk. This case excludes effects of tax reform, tax credits, and changing interest rates over time. The R&D + Market LCOE case adds to these financial assumptions: (1) the changes over time consistent with projections in the Annual Energy Outlook and (2) the effects of tax reform and tax credits (the 45Q tax credits are not included in this year's ATB). The ATB representative plant characteristics that best align with those of recently installed or anticipated near-term natural gas plants are associated with Gas-CC-HighCF. Data for all the resource categories can be found in the ATB Data spreadsheet; for simplicity, not all resource categories are shown in the figures; for simplicity, not all resource categories are shown in the figures. Variations in LCOE among the low, mid, and high projections for natural gas plants are driven by fuel price differences only.
R&D Only | R&D + Market
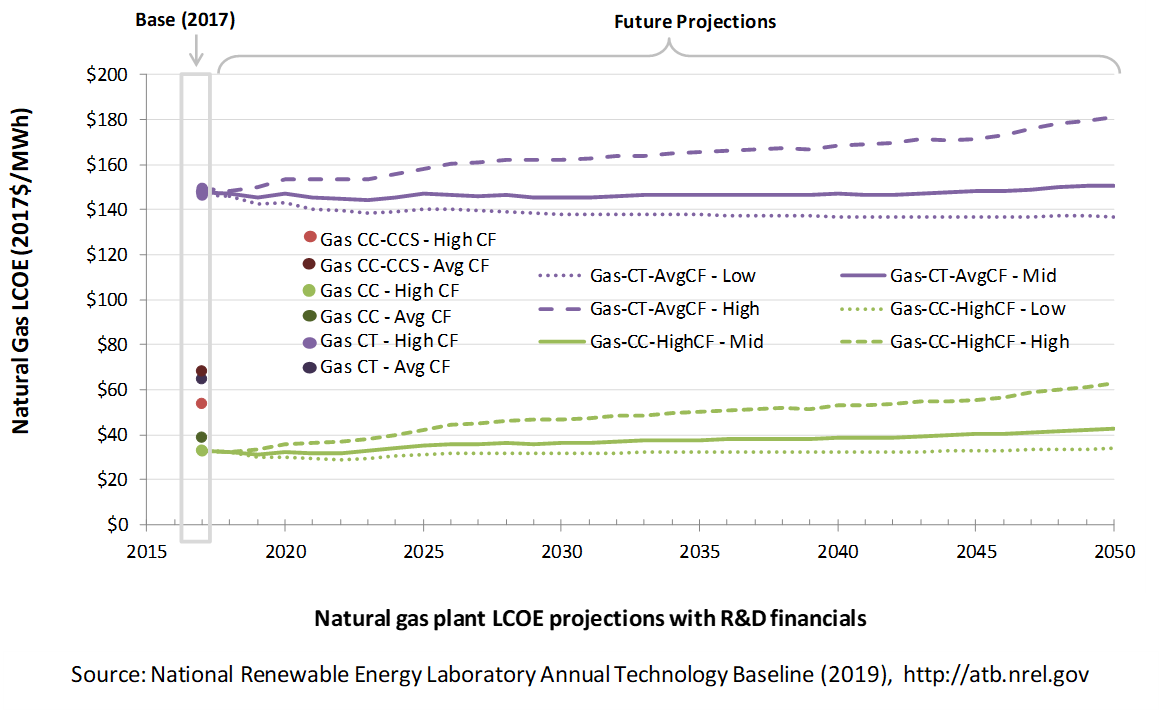
The LCOE of natural gas plants is directly impacted by the price of the natural gas fuel, so we include low, mid, and high natural gas price trajectories. The LCOE is also impacted by variations in the heat rate and O&M costs. Because the reference and high natural gas price projections from AEO2019 (EIA, 2019a) are rising over time, the LCOE of new natural gas plants can increase over time if the gas prices rise faster than the capital costs decline. For a given year, the LCOE assumes that the fuel prices from that year continue throughout the lifetime of the plant.
These projections do not include any cost of carbon, which would influence the LCOE of fossil units. Also, for CCS plants, the potential revenue from selling the captured carbon is not included (e.g., enhanced oil recovery operations may purchase CO2 from a CCS plant).
Fuel prices are based on the AEO2019.
LCOE is sensitive to assumptions about the financing of electricity generation projects. Two project finance structures are used within the ATB:
- R&D Only Financial Assumptions: This sensitivity case allows technology-specific changes to debt interest rates, return on equity rates, and debt fraction to reflect effects of R&D on technological risk perception, but it holds background rates constant at 2017 values from AEO2019 (EIA, 2019a) and excludes effects of tax reform and tax credits. A constant cost recovery period-or period over which the initial capital investment is recovered-of 30 years is assumed for all technologies.
- R&D Only + Market Financial Assumptions: This sensitivity case retains the technology-specific changes to debt interest, return on equity rates, and debt fraction from the R&D Only case and adds in the variation over time consistent with AEO2019 (EIA, 2019a) as well as effects of tax reform and tax credits. As in the R&D Only case, a constant cost recovery period-or period over which the initial capital investment is recovered-of 30 years is assumed for all technologies. For a detailed discussion of these assumptions, see Project Finance Impact on LCOE.
A constant cost recovery period-over which the initial capital investment is recovered-is assumed for all technologies throughout this website and can be varied in the ATB Data spreadsheet.
The equations and variables used to estimate LCOE are defined on the Equations and Variables page. For illustration of the impact of changing financial structures such as WACC, see Project Finance Impact on LCOE. For LCOE estimates for the Constant, Mid, and Low technology cost scenarios for all technologies, see 2019 ATB Cost and Performance Summary.
References
The following references are specific to this page; for all references in this ATB, see References.EIA. (2016b). Capital Cost Estimates for Utility Scale Electricity Generating Plants. Retrieved from U.S. Energy Information Administration website: https://www.eia.gov/analysis/studies/powerplants/capitalcost/pdf/capcost_assumption.pdf
EIA. (2019a). Annual Energy Outlook 2019 with Projections to 2050. Retrieved from U.S. Energy Information Administration website: https://www.eia.gov/outlooks/aeo/pdf/AEO2019.pdf